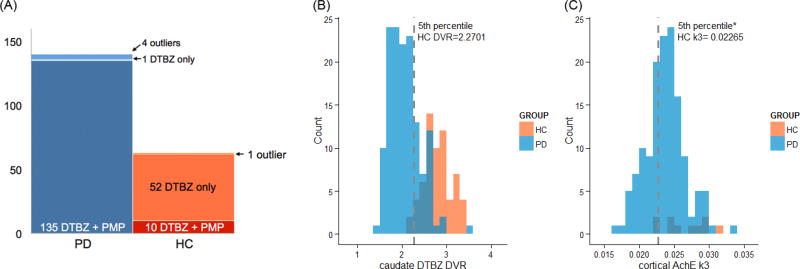
Figure 2. Sample size of the PET data and distributions of the caudate DVR and cortical k3 levels.
(A) Both types of PET scans were obtained for 135 out of total number of 140 PD patients. Dopaminergic PET was obtained for 62 HC, but cholinergic PET was limited to 10 HC. (B) The caudate DTBZ DVR measures of the PD patients are distributed in the lower range of the values obtained from the HC. 74.1% of the PD patients fall into the low caudate dopaminergic function group defined by the 5th percentile of the healthy controls. (C) Compared to the distribution of caudate DTBZ DVR measures, there is substantial overlap between the PD patient and HC distributions of the cortical AChE k3. About 30.4% of the PD patients fell into the low cortical cholinergic group defined by the 5th percentile of the healthy controls.

