

Abstract
The ability of MRI to differentiate between normal and radioresistant cancer was investigated in prostate tumour xenografts in mice. Specifically, the process of magnetization exchange between water and other molecules was studied. It was found that magnetization transfer from semisolid macromolecules (MT) and chemical exchange saturation transfer (CEST) combined were significantly different between groups (p < 0.01). Further, the T2 relaxation of the semisolid macromolecular pool (T2,B), a parameter specific to MT, was found to be significantly different (p < 0.01). Also significantly different were the rNOE contributions associated with methine groups at −0.9 ppm with a saturation B1 of 0.5 µT (p < 0.01) and with other aliphatic groups at −3.3 ppm with 0.5 and 2 µT (both p < 0.05). Independently, using a live-cell metabolic assay, normal cells were found to have a greater metabolic rate than radioresistant ones. Thus, MRI provides a novel, in vivo method to quantify the metabolic rate of tumours and predict their radiosensitivity.
Introduction
Prostate cancer is the most prevalent non-skin cancer in men and one of the leading causes of cancer death. Both surgery and radiotherapy are well established modalities used in its treatment. Unfortunately, almost one-third of high-risk prostate cancer patients develop recurrence following external beam radiation treatment as assessed by rising prostate-specific antigen levels1. Recurrent tumours, which have survived radiation (i.e., radioresistant tumours), tend to display an aggressive phenotype including increased proliferation, clinically manifest as larger tumours that are typically associated with lymph node metastases, and generally have a worse prognosis2–7. Indeed, up to a third of patients with recurrent prostate cancer will die from their cancer8,9.
We believe that development of improved detection of prostate cancer radioresistance is essential for further improving patient outcomes. The non-invasive detection of radioresistant prostate cancer through quantitative MRI will allow rapid and tailored treatment decisions to be made, such as the addition of radiosensitizers or, alternatively, the use of surgical resection in place of radiation treatment.
Previous studies have assessed tumour response to therapy using diffusion-weighted MRI10,11 (DW-MRI), dynamic contrast-enhanced MRI12 (DCE-MRI), and positron emission tomography13,14 (PET). Some of these techniques were able to detect radioresistance as early as a few weeks or a month. Confounding factors include sensitivity to multiple tissue features such as microstructural geometry and permeability which may not be specific to radiation resistance11,15. Furthermore, DCE-MRI requires the injection of contrast agent16, and PET exposes the patient to ionizing radiation and has a limited resolution17.
Chemical exchange saturation transfer18 (CEST) and the relayed nuclear Overhauser effect19 (rNOE) are promising magnetic resonance contrast mechanisms that are sensitive to metabolism20, can provide contrast without an exogenous contrast agent, and can potentially predict tumour response before treatment21. They are measured using magnetization transfer-prepared pulse sequences, which are sensitive to the exchange of magnetization between the hydrogen nuclei in water and other molecules. CEST is the physical exchange of hydrogen atoms in chemical groups in dissolved proteins (e.g., amide22, amine18, guanidinium23,24, and hydroxyl18) with water. rNOE is the exchange of magnetization intramolecularly through space between chemical groups (e.g., methine25,26 and other aliphatic19) with other hydrogen nuclei, which then undergo CEST27. In addition to CEST and rNOE, magnetization transfer-prepared pulse sequences can measure the exchange of magnetization between semisolid macromolecules (mostly lipid bilayers) and water, which is termed magnetization transfer28,29 (MT).
In magnetization transfer-prepared pulse sequences, magnetization is reduced by a radiofrequency saturation pulse (of amplitude B1) across the various frequencies of the exchanging molecules. The ratio of this reduced water signal (S) to the signal without saturation (S0) is calculated for each frequency offset, and from this the magnetization transfer ratio (MTR) can be calculated as: 1 – S/S0. In addition to the exchange rates of magnetization between hydrogen nuclei in the semisolid macromolecular, CEST, and rNOE pools with those in water, the MTR is also sensitive to the sizes and longitudinal and transverse relaxation times (T1 and T2, respectively) of each pool. It is also common to present the CEST data in a form of a “Z-spectrum”, which is a plot of measured water signal as a function of saturation pulse frequency offset (Δω) acquired over multiple excitations.
A radioresistant prostate cancer cell line has been developed to further investigate radioresistance30. Tumours arising from radioresistant cells are structurally similar to the parental ones and have similar standard MR properties such as T1 and T2 relaxation times and diffusion properties. We have demonstrated in vitro that radioresistant cells possess altered metabolism compared to normal (parental) ones and, consistent with this, discovered that they exhibit different MT, CEST, and rNOE effects in vivo – MRI contrasts that are sensitive to the chemical environment. In this work, we show that normal and radioresistant tumours in an animal model can be differentiated by MTR and isolate the underlying MT and rNOE contributions.
Results
In this work, the CEST effect was measured for 7 parental and 6 radioresistant DU145 prostate tumours xenografts in vivo. We have also analyzed the contributions of several MRI effects to the CEST spectra which allowed us to determine which of the many MRI processes (relaxation, MT, CEST, or rNOE) are the major contributor for the observed changes between parental and radioresistant tumour xenografts.
In the parental group, three tumours were substantially heterogeneous on the T2-weighted image (Supplementary Fig. S1) and large regions of elevated T1 and T2 indicating significant necrosis (not shown) were seen on T1 and T2 maps. Their Z-spectra were also substantially different than those of the other parental and all the radioresistant tumours (Fig. 1). On these bases, they were excluded from further analysis.
Figure 1.

Measured Z-spectra with saturation B1s of 0.5 and 2 µT of all homogeneous and heterogeneous tumours, both derived from the parental cell line, and tumours derived from the radioresistant cell line.
Z-spectrum analysis
The averaged Z-spectra of the remaining homogeneous parental and radioresistant tumours are shown in Fig. 2a at saturation B1s of 0.5 (blue) and 2 µT (orange). The mean Z-spectra for parental and radioresistant tumours, although similar in shape, exhibited significant differences, which are more visible in the enlarged plots in Fig. 2a. Figure 2b shows the difference between the mean Z-spectra for two measured saturation amplitudes demonstrating the presence of several maxima per saturation B1. The MTR with a saturation B1 of 0.5 µT at Δω = −0.9 ppm (p = 0.002; Fig. 3b) is significantly different. CEST contrast images are in Supplementary Fig. S2. Observed T1s (from the inversion recovery images) for parental and radioresistant tumours were 2260 ± 100 and 2300 ± 70 ms, respectively, while observed T2s (from the inversion recovery images and WASSR spectrum) were 61 ± 7 and 64 ± 4 ms, respectively, neither of which was significantly different between groups. T1 and MTR histograms are in Supplementary Fig. S3. Repeatability of the MTR was found to be good (Supplementary Fig. S5a,b).
Figure 2.

Z-spectra of parental (solid lines) and radioresistant (dashed lines) tumours. (a) The mean for parental (Par, n = 4), and radioresistant tumour (RR, n = 6) Z-spectra (shaded areas represent the standard deviations) with saturation B1s of 0.5 (blue) and 2 µT (orange). (b) Differences between Par and RR showing several maxima (arrows) per saturation B1. (c) Magnetization transfer-prepared images (with Rician noise bias and B0 correction) overlaid on the CEST reference images for representative tumours with a saturation B1 of 0.5 µT at a frequency offset of −0.9 ppm are also shown.
Figure 3.

Statistical comparison of the magnetization transfer ratios (MTRs) between parental (Par) and radioresistant tumours (RR) at the offsets indicated (arrows) in Fig. 2b. **p < 0.01.
Isolating MT, CEST, and rNOE contributions
Z-spectra for saturation B1s of 3 and 6 µT, were fitted to a two-pool MT model (Fig. 4). Table 1 shows that, of all the parameters fitted, only the T2 of the semisolid macromolecular pool T2,B was significantly different (p = 0.008) between the parental and radioresistant groups. These fitted parameters were used to extrapolate the MT model Z-spectra to the CEST- and rNOE-sensitive saturation B1s of 0.5 and 2 µT. A schematic is in Supplementary Fig. S4. The difference between this modelled MT and the measured Z-spectra was calculated in order to isolate the contributions of CEST and rNOE (Fig. 5). Also significantly different are the rNOE contributions associated with methine groups at −0.9 ppm with a saturation B1 of 0.5 µT (p = 0.001; Fig. 6c) and with other aliphatic groups at −3.3 ppm with 0.5 µT (p = 0.015; Fig. 6d) and 2 µT (p = 0.018; Fig. 6h). Repeatability of the CEST and rNOE contributions was also found to be good (Supplementary Fig. S5c–f).
Figure 4.

Results (lines) of simultaneously fitting the measured MT-sensitive Z-spectra (points) at saturation B1s of 3 and 6 µT to the two-pool MT model for representative parental and radioresistant tumours. Fitting residuals are also shown.
Table 1.
Estimated parameters of the two-pool MT model from fitting the Z-spectra with saturation B1s of 3 and 6 µT of the parental and radioresistant tumours.
| Parameter | Parental | Radioresistant | p-value |
|---|---|---|---|
| R1,W (1/s) | 0.43 ± 0.02 | 0.42 ± 0.01 | 0.419 |
| T2,W (ms) | 58 ± 6 | 61 ± 4 | 0.347 |
| R (Hz) | 36 ± 2 | 37 ± 7 | 0.851 |
| M0,B (%) | 3.0 ± 0.2 | 3.3 ± 0.2 | 0.102 |
| T 2, B (µs) | 8.44 ± 0.29 | 8.02 ± 0.05 | 0.008** |
This model has one calculated parameter: R1 of the water pool (R1,W) and four free parameters: T2 of the water pool (T2,W), exchange rate from the semisolid macromolecular pool to the water pool (R), initial magnetization of semisolid macromolecular pool (M0,B) relative to that of the water pool (defined as unity) and T2 of the semisolid macromolecular pool (T2,B). **p < 0.01.
Figure 5.

The CEST and rNOE contributions of parental (Par) and radioresistant (RR) tumours. Mean CEST and rNOE contributions to the MTR (shaded areas indicate the standard deviations), given by the difference between extrapolated semisolid molecular MT (MText) and measured Z-spectra, at saturation B1s of (a) 0.5 and (b) 2 µT and (c,d) their respective differences. Arrows indicate the commonly identified CEST and rNOE pool frequency offsets. The methine pool is not usually identified in literature because its Z-spectrum peak is close to that of water and not always distinguishable.
Figure 6.

Statistical comparison of the CEST and rNOE contributions between parental (Par) and radioresistant (RR) tumours. Boxplots of the CEST and rNOE contributions to the MTR with saturation B1s of (a–d) 0.5 and (e–h) 2 µT at the frequency offsets indicated by the arrows in Fig. 5c and d. *p < 0.05. **p < 0.01.
Oxygen consumption rate measurement
We also measured modulation of the oxygen consumption rate of parental and radioresistant cells (Fig. 7) using an extracellular flux analyzer. The sections of the plot between injections indicate, from left to right, that parental cells have higher basal respiration, proton leak, maximal respiration, and non-mitochondrial respiration than radioresistant cells. Overall, this demonstrates that parental cells have a greater metabolic rate than radioresistant cells (i.e., they consume more oxygen in the basal state and have a larger spare respiratory capacity), which provides biological correlation with our observed CEST and rNOE findings.
Figure 7.
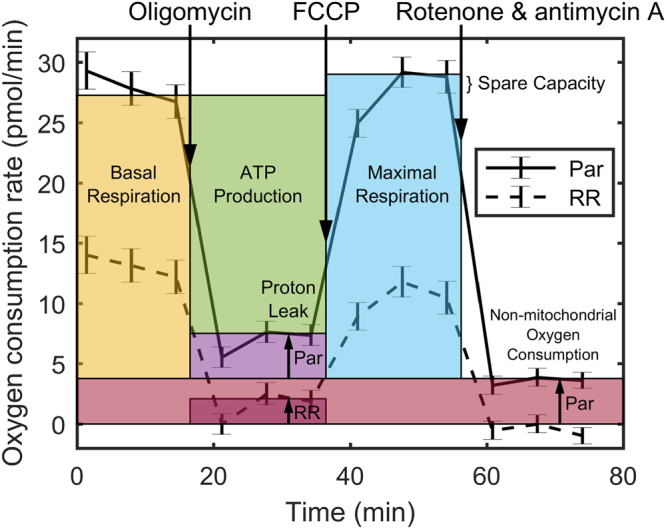
Oxygen consumption rate of parental (Par) and radioresistant (RR) cells. Mean oxygen consumption rate (error bars are standard error) modulated by serial injections (downward arrows) of oligomycin, which inhibited ATP synthase, but allowed the facilitated diffusion of protons or “proton leak” across the inner mitochondrial membrane to continue; p-trifluoromethoxy carbonyl cyanide phenylhydrazone (FCCP), which maximized oxygen consumption; and rotenone and antimycin A, which stopped all mitochondrial respiration.
Discussion
We have demonstrated that radioresistant and parental prostate tumour xenografts can be differentiated using only the magnetization transfer ratio (MTR) at a single, low saturation B1 (Fig. 3), which is a relatively simple MRI measurement. The acquisition of two MT-sensitive Z-spectra (acquired at high saturation amplitudes) and a T1 map, permitted fitting of MT parameters which showed the significant difference in T2,B between radioresistant and prostate tumour (Table 1). Additional acquisition of full Z-spectra at low saturation B1s (0.5 and 2.0 µT), in combination with the modelled MT contribution extrapolated to these B1s, separated out the relative contributions of CEST and rNOE in both tumour types (Fig. 5). Tumours were automatically segmented by thresholding a T2 map calculated from the T1 map and a WASSR Z-spectrum using Eq. 2.
Both the semisolid macromolecular and aliphatic rNOE pools contributed to the difference in MTR between the two tumour groups (Table 1 and Fig. 6). The ability to distinguish the contributions from the semisolid macromolecular and aliphatic rNOE pools provided additional specificity. The simple MTR measure was also affected by the direct water saturation27,29, which is a function of T1 and T2. However, the relaxation values of parental and radioresistant tumours were similar indicating that the differences in the MTR originated primarily from semisolid macromolecular MT and rNOE.
This dual contribution to the MTR signal was also the reason we do not use MTR asymmetry31 (MTRasym), a common metric to identify CEST contrast. It is calculated by subtracting the Z-spectrum at positive offsets from the corresponding negative offsets. MTRasym combines the contrast from CEST and rNOE, which in this case actually decreased the difference between parental and radioresistant groups.
The observation that radioresistant tumours exhibited lower CEST and rNOE (Fig. 5a) was consistent with the in vitro observation that radioresistant tumour cells had lower metabolism than the parental ones (Fig. 6). Our previous clinical studies have also found significant pre-treatment rNOE differences between gliomas responsive and non-responsive to stereotactic radiosurgery21 and MT, CEST, and rNOE differences between radiation necrosis and tumour progression in brain metastases32.
Of the semisolid macromolecular MT parameters, the only one showing significant difference was the semisolid macromolecular relaxation time T2,B. It was slightly lower in radioresistant tumours (8.02 ± 0.05 µs) than parental (8.44 ± 0.29 µs). T2,B has been found to vary with tissue type33, and changes in T2,B have also been attributed to the degree of cross-linking of molecules (i.e., in polyacrylamide gels with T2,B varying inversely with rigidity34). Decreased T2,B has been observed in spinal cord neuropathy where it was interpreted as a change in macromolecular structure of myelin35. We believe that this is the first observation of this phenomenon in cancer tissue where it may indicate slight changes in the rigidity of cell membrane lipids which are believed to be responsible for MT effects in tumours.
Our isolation of the CEST and rNOE contributions differed from the extrapolated semi-solid magnetization transfer reference (EMR) method by Heo et al.36 in several respects. First, we acquired Z-spectra at logarithmically spaced frequency offsets from 300 to 3 ppm, whereas Heo et al. acquired Z-spectra with linearly spaced offsets from 21 to −21 ppm, excluding the range from 7 to −7 ppm to avoid CEST and rNOE effects. Note that the semisolid macromolecular MT Z-spectrum has a feature around 50 ppm37 that necessitates data collection beyond 21 ppm. Second, we simultaneously fitted the Z-spectra and T1 map to the two-pool MT model, whereas Heo et al. fitted the Z-spectra alone to yield parameters lumped together with the T1 of the water pool and then isolated the parameters using the T1 map. We feel that simultaneous analysis of all the data allowed the fitting algorithm to better constrain the parameter estimates. Third, after subtracting the semisolid macromolecular MT contribution from the low B1 Z-spectra, we compared the CEST- and rNOE-only MTRs, whereas Heo et al. fitted the Bloch–McConnell38 magnetization exchange equations to estimate the pool sizes, exchange rates, and T2s of the amide (3.5 ppm) and rNOE pools (−2.5 to −5 ppm). Each has a unique advantage. The benefit of fitting the Bloch–McConnell equations is that the parameters are B1-independent. The benefit of comparing CEST- and rNOE-only MTRs is that it does not require the collection of full Z-spectra at lower B1. We attempted fitting of the Bloch–McConnell equations with amide (3.5 ppm), guanidinium (2 ppm), and rNOE pools (−3.3 ppm) to the CEST- and rNOE-only Z-spectra as well as all the data (all Z-spectra and the T1 map), but there was structure in the residuals and this was left to future work. Some misfitting is also seen in the work by Heo et al. (Fig. 3, solid lines with a saturation B1 of 0.5 µT), possibly due to the lack of a pool in their model at 2 ppm.
Another challenge to the modelling and interpretation of CEST and rNOE data is that our understanding of the rNOE contributions is limited. rNOE is thought to be composed of several peaks corresponding to different aliphatic groups. However, even at the extremely high field of 21.1 T39 it appears as one broad peak, instead of multiple peaks. Phantom studies would help, but it is difficult to produce a simple phantom with an aliphatic rNOE pool. Ex vivo rNOE has been measured using protein-free brain lipids extracted from mice, but not in synthetic liposomes40. It has also been studied using water-exchange (WEX) filter spectroscopy experiments, which showed that the rNOE process exchanges magnetization with water over hundreds of milliseconds, much slower than the CEST exchange rate (<100 ms)19.
The T2-weighted structural image gave better contrast between muscle, tumour, and liquid voxels, which was needed for accurate tumour segmentation. However, a T2 map would have the desirable property over a T2-weighted image of not being TR- and TE-dependent. Unfortunately, a T2 map was not part of the original imaging protocol and was generated from the T1 and WASSR data instead, which is not conventionally done. In our opinion, a more standard CPMG-calculated41,42 T2 map would be free of any potential cumulative errors from the T1 and WASSR scans and does not take long to acquire for a single slice. A CPMG sequence will be included in future studies.
There is likely a difference in pH between the two tumours types to which CEST may be sensitive. Although we have not assayed pH or reactive oxygen species levels in our tumours to date, based on the reduced oxygen consumption rate of the radioresistant cells relative to parental cells, this could translate to reduced hypoxia and less acidosis in the radioresistant cells. It is also possible that, given tumour heterogeneity, the exported lactate (resulting from a reduction in oxygen consumption and conversion of pyruvate to lactate by lactate dehydrogenase) is used as fuel by neighbouring cells, so an increase in acidosis may not be seen. This is further corroborated by the following CEST-derived metric. Ward and Balaban43 demonstrated that pH is a function of the expression:
| 1 |
where Mz is the measured CEST contrast, M0 is the contrast in the absence of radiofrequency saturation or under control saturation, and the sites refer to different chemical groups that are saturated. McVicar et al.44 showed that, when Site 2 is assigned to amine (2.75 ppm) and Site 1 to amide (3.5 ppm), Eq. 1 is inversely proportional to pH. Desmond45 reported a similar finding with guanidinium (2 ppm) in place of amine. Eq. 1 was applied to our Z-spectrum measurements with saturation B1s of 0.5 and 2 µT with Site 2 assigned to guanidinium and Site 1 to amide and M0 defined as unity. Eq. 1 had a lower value in the radioresistant tumours compared to parental (Supplementary Fig. S6), indicating that the radioresistant tumours may have a higher pH than parental ones. However, the results are not statistically significant, nor could they be translated to pH values without a calibrated standard curve. Additionally, we acknowledge that since we did not measure tumour pH and lactate, the exact mechanism remains to be elucidated.
For applications in vivo, the acquisition of all the Z-spectra, as performed in this work, would be too time consuming. Fortunately, to arrive at the conclusions presented requires much less data collection: two Z-spectra with high saturation B1 (3 and 6 µT) in order to extrapolate the semisolid macromolecular contribution to low saturation B1 (≈ 0.5 µT), a partial Z-spectrum with the lower saturation B1 around −0.9 ppm frequency offset to isolate the methine rNOE contribution and/or −3.3 ppm to isolate other aliphatic rNOE contributions or both (as single measurements at each of these offsets would be insufficient in the presence of B0 inhomogeneity), a WASSR scan for B0 correction, and a T1 map for two-pool MT model fitting.
We chose to use magnetization transfer-prepared FLASH to ensure that the net magnetization is in steady state with respect to saturation (i.e., saturation duration > 5 × T1). This simplifies quantitative MT modelling and future work in quantitative CEST because the effective saturation duration is 16 s (32 phase-encoding lines to reach the centre of k-space × 500 ms TR). Note that this should not to be confused with equilibrium magnetization reached after repeated TRs. In clinical imaging, faster readouts are used, where magnetization is not in steady state with respect to saturation46 and measurements at fewer frequency offsets are made, but these may be necessary trade-offs. Hardware limitations include lower RF amplitude and RF duty cycle, which may limit the saturation duration, require pulsed saturation (complicating modelling), and add dead time in each TR. All of this reduces image contrast relative to that from experiments on animal scanners. The clinical research magnetization transfer-prepared protocol for head imaging in our lab consists of single slice MT-prepared turbo field echo sequence with a saturation B1 of 0.5 µT made of four 242 ms block pulses, at 64 frequency offsets and 5 reference scans (1 mm × 1 mm in-plane resolution, 1.5 mm through-plane; 10 min in total) and one average each with B1s of 3 and 5 µT at 11 frequency offsets (3.5 min in total); WASABI47 for B0 and B1 mapping (1 min); a series of low flip angle fast field echo scans for T1 mapping (2 min); and a CPMG sequence for T2 mapping (1.5 min) for a total of 18 min. The trade-off between frequency offsets and number of slices for increased coverage should also be considered.
Methods
Animal model
Two cell lines were used in this study: a parental line, DU145 human prostate adenocarcinoma (ATCC, Manassas, VA; denoted “Par”) and a radiation-resistant line30 (denoted “RR”) generated by treatment of parental cells with radiation mimicking a clinical treatment schedule. Approximately 3 × 10⁶ cells mixed in a 1:1 ratio with growth factor reduced Matrigel matrix (BD Canada, Mississauga, ON) were injected in the right hind limbs of female athymic nude mice (Charles River Canada, Saint-Constant, QC) and allowed to grow into tumours (nPar = 7, and nRR = 6). Tumours were allowed to grow until they reached a volume of at least 100 mm3 measured using calipers every 1–4 days and calculated using the formula volume = length × width2/2 and until they were at least 34 days post-injection to allow time for cell differentiation. All experimental procedures in this study were approved by the Animal Care Committee of the Sunnybrook Research Institute, which adheres to the Policies and Guidelines of the Canadian Council on Animal Care and meets all the requirements of the Animals for Research Act of Ontario and the Health of Animals Act of Canada.
Magnetic resonance imaging
All tumours were scanned at 7 T (BioSpec 70/30 USR with BGA-12SHP gradients running ParaVision 6.0.1, Bruker BioSpin, Billerica, MA) using a 86 mm inner diameter volume coil (T12053V3) for transmit and a 20 mm diameter loop surface coil (T115534) for receive. A 2D axial T2-weighted rapid acquisition with refocused echoes48 (RARE; TR = 2500 ms; TE = 9.2 ms; FOV = 20 mm × 20 mm × 7.5 mm; slice thickness = 0.5 mm; matrix = 128 × 128; RARE factor = 12; bandwidth = 33 kHz; averages = 4; 6 min, 40 s) was used for prescribing the slice of interest, chosen to be at the thickest point of the tumour. B0-map-based shimming (map shim) was performed in an ellipsoidal volume enclosing the tumour in the slice of interest. Flip angle scale factor maps (Supplementary Fig. S7) were calculated49 for four mice using a series of 3D high flip angle FLASH scans and the T1 map for the slice of interest and the flip angle in the tumour region of interest (ROI) was found to be within 6% of nominal. Thus, B1 correction was deemed unnecessary, given the time constraints. Z-spectra (plots of water signal normalized by a reference signal vs saturation frequency offset, where water = 0 ppm) composed of single slice images were calculated from magnetization transfer-prepared (block saturation pulse; duration per k-space line = 490 ms) fast low angle shot50 (FLASH; TR = 500 ms; TE = 3 ms; flip angle = 30°; FOV = 20 mm × 20 mm × 1 mm; matrix = 64 × 64; bandwidth = 50 kHz) as in our previous work51. The cumulative saturation time when acquiring the centre of k-space is ≈ 16 s. Five Z-spectra were acquired: two spectra sensitive to the direct water saturation effect (DE), CEST, and MT contributions with radiofrequency saturation amplitudes, B1s, of 0.5 and 2 µT at 66 frequency offsets Δω (= ω − ω0, where ω is the saturation frequency and ω0, the water resonance frequency) between ±5 ppm; two spectra mainly sensitive to the DE and magnetization transfer from semisolid macromolecules (MT) with saturation B1s of 3 and 6 µT at 11 logarithmically spaced offsets between 300 and 3 ppm; and one DE-sensitive water saturation shift referencing52 (WASSR) spectrum with a saturation B1 of 0.1 μT at 21 linearly spaced offsets between ±0.5 ppm. After every five Z-spectrum measurements, a reference scan at an offset of 667 ppm was interleaved for baseline correction. In addition, two initial and one final reference scans were acquired for each Z-spectrum. The scan time for the Z-spectra including reference scans with saturation B1s of 0.5 and 2 µT was 44 min/spectrum; 3 and 6 µT, 8.5 min/spectrum; and 0.1 µT, 15 min. Five inversion recovery RARE53 scans (TR = 10,000 ms; TE = 6 ms; TI = 30, 110, 390, 1400, 5000 ms; same FOV and matrix as FLASH; RARE factor = 4; bandwidth = 77 kHz; 2 min each) were also acquired for a T1 map. The total acquisition time including scout and shimming per animal was 2.5 h.
Animal monitoring
Anaesthesia in the animals was induced with 5% isoflurane in oxygen flowing at 1.5 L/min. 200 µL of saline solution was injected subcutaneously at the start of the scan to maintain hydration. Monitoring was performed with a temperature probe and respiratory pillow (Small Animal Instruments, Inc., Stony Brook, NY), both placed under the belly against the skin. Heating was supplied by a water bed system (same manufacturer). Skin temperature was kept at 36 °C and the isoflurane concentration adjusted around 1.75% such that the respiratory rate was maintained around 90 breaths/min.
Image analysis
The first reference scan of each Z-spectrum was discarded in case it was not in a steady state. The distribution of signal in a manually drawn background ROI was confirmed to be Rician and Rician noise bias correction54 was applied to all Z-spectra. For each animal, images were registered using a rigid body transform to the first reference image with a saturation B1 of 0.5 µT. Z-spectrum images with less than 75% of the mean signal of the reference scan were considered to have insufficient signal-to-noise ratio (SNR) for the calculation of a transform matrix and were registered using the last matrix with sufficient SNR (typically an interleaved reference scan, which were acquired frequently and had high SNR). To correct for baseline drift, the measurements of each Z-spectrum were normalized to a line fitted to the reference measurements interleaved with the Z-spectrum measurements (reference measurements are not shown). To correct for B0 inhomogeneity, which introduces a shift in the Z-spectrum along the frequency offset axis, the sum of two Lorentzians (corresponding to DE and semisolid macromolecular pools) was fitted to the Z-spectra with saturation B1s of 0.5 and 2 µT at offsets between ±0.5 ppm. The Z-spectra were re-centred to the peak position of the water-pool Lorentzian and linearly interpolated to the frequency offsets measured originally. Similarly, for the WASSR spectrum, a single Lorentzian was fitted for B0 correction (since there is negligible semisolid macromolecular MT for low B1 saturation amplitudes). This spectrum-wise B0 correction was chosen, instead of using WASSR to correct all spectra, in case B0 drifted during acquisition.
A T1 map was calculated from the inversion recovery scans by fitting to the inversion recovery RARE signal equation53. Then, a T2 map was evaluated from the T1 map and WASSR spectrum (Supplementary Fig. S4, upper left) using the steady-state direct water saturation signal intensity
| 2 |
where R1/2 = 1/T1/2 and ω1 = γB1; γ is the gyromagnetic ratio of the hydrogen nucleus. The tumour ROI was defined in each animal as voxels with T1 < 2600 ms to exclude liquid and T2 ≥ 45 ms to exclude muscle and thrombus (Supplementary Fig. S4, upper right). The mean signal of each tumour ROI was calculated and Z-spectra at each saturation B1 were generated. The MTR between parental and radioresistant tumour groups were compared at the offsets with the largest signal differences.
The MTR contains contributions from the water, semisolid macromolecular (MT pool), CEST, and rNOE pools and are dependent on saturation B1, so further processing was used to disentangle the source of any differences between groups. The Z-spectra with saturation B1s of 3 and 6 µT and T1 map (Supplementary Fig. S4, centre left) were fitted to a two-pool MT model55 with a super-Lorentzian lineshape for the semisolid pool to quantify MR parameters of the tumours that are independent of saturation B1. This model has four fitted parameters: T2 of the water pool (T2,W), exchange rate from the semisolid macromolecular pool to the water pool (R), initial magnetization of semisolid macromolecular pool (M0,B) relative to that of the water pool (defined as unity) and T2 of the semisolid macromolecular pool (T2,B) and one calculated parameter: R1 of the water pool (R1,W), evaluated from the T1 map and fitted parameters. These parameters, describing only the direct effect and magnetization transfer of semisolid macromolecules, were also compared between groups.
Finally, a method to isolate CEST and rNOE contributions, similar to the extrapolated semisolid magnetization transfer reference (EMR) technique36, was employed. Two Z-spectra containing only semisolid macromolecular MT and water contributions were forward modelled using the estimated two-pool MT model parameters for saturation B1s of 0.5 and 2 µT (Supplementary Fig. S4, centre) and experimental Z-spectra with the same saturation B1 were subtracted to isolate the CEST and rNOE contributions (Supplementary Fig. S4, bottom). The contributions are artificially negative around 0 ppm likely because the exchange of water magnetization with the semisolid macromolecular pool is overly weighted, even though it also exchanges with the CEST and rNOE pools, because the semisolid macromolecular model is fitted first. However, this does not affect the estimated contributions at the CEST and rNOE peak locations. The contributions at peak offsets of 3.5 ppm (amide; CEST), 2.0 ppm (guanidinium; CEST), −0.9 ppm (methine; rNOE), and −3.3 ppm (other aliphatic; rNOE) were compared between groups. All statistical significance was measured by the unpaired, two-tailed Student’s t-test with an alpha level of 0.05. All analysis was performed in MATLAB (R2016b, The MathWorks, Natick, MA).
Oxygen consumption rate measurement
An independent measurement of the metabolic rate of the two DU145 cell types was also performed in vitro. Oxygen consumption rate profiles of the parental and radioresistant cells were measured (n = 8 wells per group) using a live cell metabolic assay platform (Seahorse XF analyzer with Cell Mito Stress Test kit, Agilent, Santa Clara, CA) in the presence of 10 mM glucose, 1 mM pyruvate, and 2 mM glutamine56. The cells were subjected to serial injections of 2.0 µM oligomycin, which inhibited ATP synthase, but allowed the facilitated diffusion of protons or “proton leak” across the inner mitochondrial membrane; 1.0 µM p-trifluoromethoxy carbonyl cyanide phenylhydrazone (FCCP), which dissipated the inner mitochondrial membrane potential and maximized oxygen consumption; and 0.5 µM rotenone and antimycin A, which inhibited complexes I and III of the electron transport chain and stopped all mitochondrial respiration. This allowed the measurement of the oxygen consumption rate due to ATP production, the proton leak, and maximal respiration and the non-mitochondrial oxygen consumption rate, respectively, so that relative metabolic rate could be compared to relative CEST and rNOE contrast (an indirect measure of metabolism) between parental and radioresistant cells.
Data availability
The data that support the findings of this study are available from the corresponding author upon reasonable request.
Electronic supplementary material
Acknowledgements
Financial support was provided by the Terry Fox Research Institute (Project 1034), Prostate Cancer Canada (Movember Discovery Grant D2017–1813), and the Canadian Institutes of Health Research (Grant PJT148660).
Author Contributions
W.W.L., W.O., and G.J.S. conceived and designed the study. S.K.L. created the radioresistant cell line and provided both cell lines. L.M. and M.M.K. injected the cells and measured the growing tumours. W.W.L., W.O., and L.M. performed the imaging experiments. J.K. performed preliminary imaging experiments. W.W.L. analyzed the imaging data. C.I., R.A.S., and W.C. coordinated and performed the oxygen consumption rate measurements. W.W.L., W.O., and G.J.S. wrote the manuscript with assistance from the other authors. G.J.S. supervised the project.
Competing Interests
The authors declare no competing interests.
Footnotes
Electronic supplementary material
Supplementary information accompanies this paper at 10.1038/s41598-018-28731-0.
Publisher's note: Springer Nature remains neutral with regard to jurisdictional claims in published maps and institutional affiliations.
References
- 1.Viani GA, Stefano EJ, Afonso SL. Higher-Than-Conventional Radiation Doses in Localized Prostate Cancer Treatment: A Meta-analysis of Randomized, Controlled Trials. Int. J. Radiat. Oncol. 2009;74:1405–1418. doi: 10.1016/j.ijrobp.2008.10.091. [DOI] [PubMed] [Google Scholar]
- 2.Grossfeld GD, et al. Locally recurrent prostate tumors following either radiation therapy or radical prostatectomy have changes in Ki-67 labeling index, p53 and bcl-2 immunoreactivity. J. Urol. 1998;159:1437–1443. doi: 10.1097/00005392-199805000-00004. [DOI] [PubMed] [Google Scholar]
- 3.Wheeler JA, Zagars GK, Ayala AG. Dedifferentiation of locally recurrent prostate cancer after radiation therapy. Evidence for tumor progression. Cancer. 1993;71:3783–3787. doi: 10.1002/1097-0142(19930601)71:11<3783::aid-cncr2820711149>3.0.co;2-x. [DOI] [PubMed] [Google Scholar]
- 4.Stamey TA, Ferrari MK, Schmid H-P. The Value of Serial Prostate Specific Antigen Determinations 5 Years after Radiotherapy: Steeply Increasing Values Characterize 80% of Patients. J. Urol. 1993;150:1856–1859. doi: 10.1016/S0022-5347(17)35914-1. [DOI] [PubMed] [Google Scholar]
- 5.Siders DB, Lee F. Histologic changes of irradiated prostatic carcinoma diagnosed by transrectal ultrasound. Hum. Pathol. 1992;23:344–351. doi: 10.1016/0046-8177(92)90080-M. [DOI] [PubMed] [Google Scholar]
- 6.Lerner SE, Blute ML, Zincke H. Critical Evaluation of Salvage Surgery for Radio-Recurrent/Resistant Prostate Cancer. J. Urol. 1995;154:1103–1109. doi: 10.1016/S0022-5347(01)66988-X. [DOI] [PubMed] [Google Scholar]
- 7.Leibovici D, et al. Pathological Characteristics of Prostate Cancer Recurrence After Radiation Therapy: Implications for Focal Salvage Therapy. J. Urol. 2012;188:98–102. doi: 10.1016/j.juro.2012.02.2571. [DOI] [PubMed] [Google Scholar]
- 8.Agarwal PK, Sadetsky N, Konety BR, Resnick MI, Carroll PR. Treatment failure after primary and salvage therapy for prostate cancer. Cancer. 2008;112:307–314. doi: 10.1002/cncr.23161. [DOI] [PubMed] [Google Scholar]
- 9.Dawson LA, et al. A comparison of ventilatory prostate movement in four treatment positions. Int. J. Radiat. Oncol. 2000;48:319–323. doi: 10.1016/S0360-3016(00)00751-3. [DOI] [PubMed] [Google Scholar]
- 10.Dhermain FG, Hau P, Lanfermann H, Jacobs AH, van den Bent MJ. Advanced MRI and PET imaging for assessment of treatment response in patients with gliomas. Lancet Neurol. 2010;9:906–920. doi: 10.1016/S1474-4422(10)70181-2. [DOI] [PubMed] [Google Scholar]
- 11.Thoeny HC, Ross BD. Predicting and monitoring cancer treatment response with diffusion-weighted MRI. J. Magn. Reson. Imaging. 2010;32:2–16. doi: 10.1002/jmri.22167. [DOI] [PMC free article] [PubMed] [Google Scholar]
- 12.Li SP, Padhani AR. Tumor response assessments with diffusion and perfusion MRI. J. Magn. Reson. Imaging. 2012;35:745–763. doi: 10.1002/jmri.22838. [DOI] [PubMed] [Google Scholar]
- 13.Hoekstra CJ, et al. Monitoring response to therapy in cancer using [18F]-2-fluoro-2-deoxy-D-glucose and positron emission tomography: An overview of different analytical methods. Eur. J. Nucl. Med. Mol. Imaging. 2000;27:731–743. doi: 10.1007/s002590050570. [DOI] [PubMed] [Google Scholar]
- 14.de Geus-Oei L-F, Vriens D, van Laarhoven HWM, van der Graaf WTA, Oyen WJG. Monitoring and Predicting Response to Therapy with 18F-FDG PET in Colorectal Cancer: A Systematic Review. J. Nucl. Med. 2009;50:43S–54S. doi: 10.2967/jnumed.108.057224. [DOI] [PubMed] [Google Scholar]
- 15.Winston GP. The physical and biological basis of quantitative parameters derived from diffusion MRI. Quant. Imaging Med. Surg. 2012;2:254–65. doi: 10.3978/j.issn.2223-4292.2012.12.05. [DOI] [PMC free article] [PubMed] [Google Scholar]
- 16.Kaewlai R, Abujudeh H. Nephrogenic Systemic Fibrosis. Am. J. Roentgenol. 2012;199:W17–W23. doi: 10.2214/AJR.11.8144. [DOI] [PubMed] [Google Scholar]
- 17.Moses WW. Fundamental limits of spatial resolution in PET. Nucl. Instruments Methods Phys. Res. Sect. A Accel. Spectrometers, Detect. Assoc. Equip. 2011;648:S236–S240. doi: 10.1016/j.nima.2010.11.092. [DOI] [PMC free article] [PubMed] [Google Scholar]
- 18.Ward KM, Aletras AH, Balaban RS. A New Class of Contrast Agents for MRI Based on Proton Chemical Exchange Dependent Saturation Transfer (CEST) J. Magn. Reson. 2000;143:79–87. doi: 10.1006/jmre.1999.1956. [DOI] [PubMed] [Google Scholar]
- 19.van Zijl PCM, et al. Mechanism of magnetization transfer during on-resonance water saturation. A new approach to detect mobile proteins, peptides, and lipids. Magn. Reson. Med. 2003;49:440–449. doi: 10.1002/mrm.10398. [DOI] [PubMed] [Google Scholar]
- 20.Goldenberg, J. M. & Pagel, M. D. Assessments of tumor metabolism with CEST MRI. NMR Biomed.10.1002/nbm.3943 (2018). [DOI] [PMC free article] [PubMed]
- 21.Desmond KL, et al. Chemical exchange saturation transfer for predicting response to stereotactic radiosurgery in human brain metastasis. Magn. Reson. Med. 2017;78:1110–1120. doi: 10.1002/mrm.26470. [DOI] [PubMed] [Google Scholar]
- 22.Zhou J, Lal B, Wilson DA, Laterra J, Van Zijl PCM. Amide Proton Transfer (APT) Contrast for Imaging of Brain Tumors. Magn. Reson. Med. 2003;50:1120–1126. doi: 10.1002/mrm.10651. [DOI] [PubMed] [Google Scholar]
- 23.Goerke S, Zaiss M, Bachert P. Characterization of creatine guanidinium proton exchange by water-exchange (WEX) spectroscopy for absolute-pH CEST imaging in vitro. NMR Biomed. 2014;27:507–518. doi: 10.1002/nbm.3086. [DOI] [PubMed] [Google Scholar]
- 24.Zhang X-Y, et al. Assignment of the molecular origins of CEST signals at 2 ppm in rat brain. Magn. Reson. Med. 2017;78:881–887. doi: 10.1002/mrm.26802. [DOI] [PMC free article] [PubMed] [Google Scholar]
- 25.Swanson SD. Protein Mediated Magnetic Coupling between Lactate and Water Protons. J. Magn. Reson. 1998;135:248–255. doi: 10.1006/jmre.1998.1535. [DOI] [PubMed] [Google Scholar]
- 26.Ling W, Regatte RR, Navon G, Jerschow A. Assessment of glycosaminoglycan concentration in vivo by chemical exchange-dependent saturation transfer (gagCEST) Proc. Natl. Acad. Sci. USA. 2008;105:2266–2270. doi: 10.1073/pnas.0707666105. [DOI] [PMC free article] [PubMed] [Google Scholar]
- 27.van Zijl PCM, Lam WW, Xu J, Knutsson L, Stanisz GJ. Magnetization Transfer Contrast and Chemical Exchange Saturation Transfer MRI. Features and analysis of the field-dependent saturation spectrum. Neuroimage. 2018;168:222–241. doi: 10.1016/j.neuroimage.2017.04.045. [DOI] [PMC free article] [PubMed] [Google Scholar]
- 28.Wolff SD, Balaban RS. Magnetization transfer contrast (MTC) and tissue water proton relaxation in vivo. Magn. Reson. Med. 1989;10:135–144. doi: 10.1002/mrm.1910100113. [DOI] [PubMed] [Google Scholar]
- 29.Henkelman RM, Stanisz GJ, Graham SJ. Magnetization transfer in MRI: A review. NMR Biomed. 2001;14:57–64. doi: 10.1002/nbm.683. [DOI] [PubMed] [Google Scholar]
- 30.Fotouhi Ghiam A, et al. Long non-coding RNA urothelial carcinoma associated 1 (UCA1) mediates radiation response in prostate cancer. Oncotarget. 2017;8:4668–4689. doi: 10.18632/oncotarget.13576. [DOI] [PMC free article] [PubMed] [Google Scholar]
- 31.Zhou J, Payen J-F, Wilson DA, Traystman RJ, van Zijl PCM. Using the amide proton signals of intracellular proteins and peptides to detect pH effects in MRI. Nat. Med. 2003;9:1085–1090. doi: 10.1038/nm907. [DOI] [PubMed] [Google Scholar]
- 32.Mehrabian H, Desmond KL, Soliman H, Sahgal A, Stanisz GJ. Differentiation between Radiation Necrosis and Tumor Progression Using Chemical Exchange Saturation Transfer. Clin. Cancer Res. 2017;23:3667–3675. doi: 10.1158/1078-0432.CCR-16-2265. [DOI] [PubMed] [Google Scholar]
- 33.Stanisz GJ, et al. T1, T2 relaxation and magnetization transfer in tissue at 3T. Magn. Reson. Med. 2005;54:507–512. doi: 10.1002/mrm.20605. [DOI] [PubMed] [Google Scholar]
- 34.Kennan RP, Richardson KA, Zhong J, Maryanski MJ, Gore JC. The Effects of Cross-Link Density and Chemical Exchange on Magnetization Transfer in PolyacrylamideGels. J. Magn. Reson. Ser. B. 1996;110:267–277. doi: 10.1006/jmrb.1996.0042. [DOI] [PubMed] [Google Scholar]
- 35.Smith SA, et al. Quantitative magnetization transfer characteristics of the human cervical spinal cord in vivo: Application to Adrenomyeloneuropathy. Magn. Reson. Med. 2009;61:22–27. doi: 10.1002/mrm.21827. [DOI] [PMC free article] [PubMed] [Google Scholar]
- 36.Heo H-Y, Zhang Y, Lee D-H, Hong X, Zhou J. Quantitative Assessment of Amide Proton Transfer (APT) and Nuclear Overhauser Enhancement (NOE) Imaging with Extrapolated Semi-Solid Magnetization Transfer Reference (EMR) Signals: Application to a Rat Glioma Model at 4.7 Tesla. Magn. Reson. Med. 2016;75:137–149. doi: 10.1002/mrm.25581. [DOI] [PMC free article] [PubMed] [Google Scholar]
- 37.Morrison C, Henkelman RM. A model for magnetization transfer in tissues. Magn. Reson. Med. 1995;33:475–482. doi: 10.1002/mrm.1910330404. [DOI] [PubMed] [Google Scholar]
- 38.McConnell HM. Reaction rates by nuclear magnetic resonance. J. Chem. Phys. 1958;28:430–431. doi: 10.1063/1.1744152. [DOI] [Google Scholar]
- 39.Roussel, T., Rosenberg, J. T., Grant, S. C. & Frydman, L. CEST-weighted MRI at 21.1 T: Application to glioma and ischemic rat model. In Proceedings of the 25th Annual Meeting of ISMRM 997 (2017).
- 40.Goerke, S. et al. CEST Signals of Lipids. In Proceedings of the 25th Annual Meeting of ISMRM 201 (2017).
- 41.Carr HY, Purcell EM. Effects of diffusion on free precession in nuclear magnetic resonance experiments. Phys. Rev. 1954;94:630–638. doi: 10.1103/PhysRev.94.630. [DOI] [Google Scholar]
- 42.Meiboom S, Gill D. Modified spin echo method for measuring nuclear relaxation times. Rev. Sci. Instrum. 1958;29:688–691. doi: 10.1063/1.1716296. [DOI] [Google Scholar]
- 43.Ward KM, Balaban RS. Determination of pH using water protons and chemical exchange dependent saturation transfer (CEST) Magn. Reson. Med. 2000;44:799–802. doi: 10.1002/1522-2594(200011)44:5<799::AID-MRM18>3.0.CO;2-S. [DOI] [PubMed] [Google Scholar]
- 44.McVicar N, et al. Quantitative Tissue Ph Measurement during Cerebral Ischemia Using Amine and Amide Concentration-Independent Detection (AACID) with MRI. J. Cereb. Blood Flow Metab. 2014;34:690–698. doi: 10.1038/jcbfm.2014.12. [DOI] [PMC free article] [PubMed] [Google Scholar]
- 45.Desmond, K. L. Endogenous Chemical Exchange Saturation Transfer: Quantitative Modelling and Application in Cancer. At http://hdl.handle.net/1807/73783 (University of Toronto, 2014).
- 46.Khlebnikov, V. et al. Comparison of pulsed three-dimensional CEST acquisition schemes at 7 tesla: Steady state versus pseudosteady state. Magn. Reson. Med. 77, 2280–2287 (2017). [DOI] [PMC free article] [PubMed]
- 47.Schuenke, P. et al. Simultaneous mapping of water shift and B1 (WASABI)—Application to field-inhomogeneity correction of CEST MRI data. Magn. Reson. Med.77, 571–580 (2017). [DOI] [PubMed]
- 48.Hennig J, Nauerth A, Friedburg H. RARE imaging: A fast imaging method for clinical MR. Magn. Reson. Med. 1986;3:823–833. doi: 10.1002/mrm.1910030602. [DOI] [PubMed] [Google Scholar]
- 49.Wang J, Qiu M, Kim H, Constable RT. T1 Measurements incorporating flip angle calibration and correction in vivo. J. Magn. Reson. 2006;182:283–292. doi: 10.1016/j.jmr.2006.07.005. [DOI] [PubMed] [Google Scholar]
- 50.Frahm J, Haase A, Matthaei D. Rapid NMR imaging of dynamic processes using the FLASH technique. Magn. Reson. Med. 1986;3:321–327. doi: 10.1002/mrm.1910030217. [DOI] [PubMed] [Google Scholar]
- 51.Desmond KL, Moosvi F, Stanisz GJ. Mapping of amide, amine, and aliphatic peaks in the CEST spectra of murine xenografts at 7 T. Magn. Reson. Med. 2014;71:1841–1853. doi: 10.1002/mrm.24822. [DOI] [PubMed] [Google Scholar]
- 52.Kim M, Gillen J, Landman BA, Zhou J, van Zijl PCM. Water saturation shift referencing (WASSR) for chemical exchange saturation transfer (CEST) experiments. Magn. Reson. Med. 2009;61:1441–1450. doi: 10.1002/mrm.21873. [DOI] [PMC free article] [PubMed] [Google Scholar]
- 53.Rydberg JN, Riederer SJ, Rydberg CH, Jack CR. Contrast optimization of fluid-attenuated inversion recovery (FLAIR) imaging. Magn. Reson. Med. 1995;34:868–877. doi: 10.1002/mrm.1910340612. [DOI] [PubMed] [Google Scholar]
- 54.Henkelman RM. Measurement of signal intensities in the presence of noise in MR images. Medical Physics. 1985;12:232–233. doi: 10.1118/1.595711. [DOI] [PubMed] [Google Scholar]
- 55.Henkelman RM, et al. Quantitative interpretation of magnetization transfer. Magn. Reson. Med. 1993;29:759–766. doi: 10.1002/mrm.1910290607. [DOI] [PubMed] [Google Scholar]
- 56.Norton M, et al. ROMO1 Is an Essential Redox-Dependent Regulator of MitochondrialDynamics. Sci. Signal. 2014;7:ra10. doi: 10.1126/scisignal.2004374. [DOI] [PubMed] [Google Scholar]
Associated Data
This section collects any data citations, data availability statements, or supplementary materials included in this article.
Supplementary Materials
Data Availability Statement
The data that support the findings of this study are available from the corresponding author upon reasonable request.