
FIG 2 .
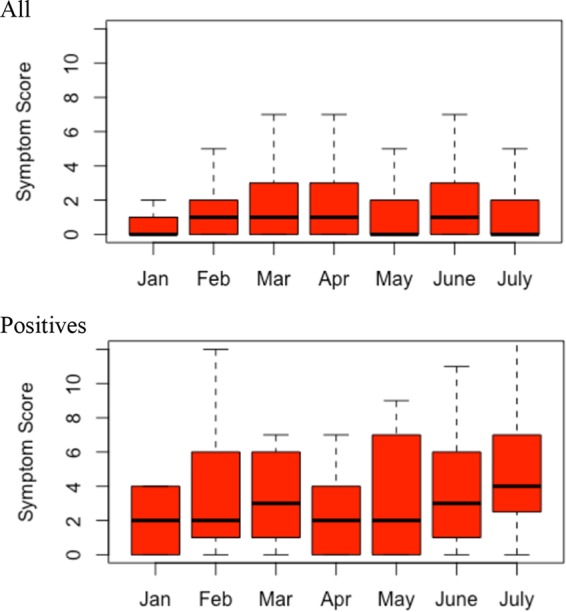
Symptom scores by month. This figure shows mean symptom scores by month among all participants (top) and among the participants testing positive (bottom). There were statistically significant differences in mean symptom scores by month among all participants (P < 0.001 [ANOVA]) but not among only those testing positive (P = 0.914 [ANOVA]), indicating that it is likely that higher respiratory virus prevalence during some months explains the variations in symptom scores over seasons. Note that the sampling in January did not start until near the end of the month, so the sample size was small and may not reflect the true mean symptom scores.