

Abstract
Motivation
Several molecular events are known to be cancer-related, including genomic aberrations, hypermethylation of gene promoter regions and differential expression of microRNAs. These aberration events are very heterogeneous across tumors and it is poorly understood how they affect the molecular makeup of the cell, including the transcriptome and proteome. Protein interaction networks can help decode the functional relationship between aberration events and changes in gene and protein expression.
Results
We developed NetICS (Network-based Integration of Multi-omics Data), a new graph diffusion-based method for prioritizing cancer genes by integrating diverse molecular data types on a directed functional interaction network. NetICS prioritizes genes by their mediator effect, defined as the proximity of the gene to upstream aberration events and to downstream differentially expressed genes and proteins in an interaction network. Genes are prioritized for individual samples separately and integrated using a robust rank aggregation technique. NetICS provides a comprehensive computational framework that can aid in explaining the heterogeneity of aberration events by their functional convergence to common differentially expressed genes and proteins. We demonstrate NetICS’ competitive performance in predicting known cancer genes and in generating robust gene lists using TCGA data from five cancer types.
Availability and implementation
NetICS is available at https://github.com/cbg-ethz/netics.
Supplementary information
Supplementary data are available at Bioinformatics online.
1 Introduction
Large-scale genomic studies have identified many aberrations in cancer genomes. However, in most cases it is not understood how the genetic aberrations contribute to cancer progression. There are many different types of genetic aberrations, including single-nucleotide variants, small and large insertions and deletions, as well as more complex genomic rearrangements (Holland et al., 2012). Genetic aberrations can be highly diverse among tumors of the same cancer type, and even among subclones of the same tumor (Burrell et al., 2013). It is assumed that only approximately 0.1% of the genetic aberrations in a tumor cell are actually driving cancer progression (Vogelstein et al., 2013), such that their detection among the large number of neutral passenger mutations is challenging. Moreover, it is difficult to detect cancer genes that are mutated only in a small number of samples by using tools that are based only on the population frequency of genetic aberrations (Lawrence et al., 2013). A promising way to address this challenge is the integration of different omics data types (Bersanelli et al., 2016) and the detection of combinatorial patterns of mutations such as mutual exclusivity and co-occurrence (Dimitrakopoulos et al., 2016). Besides genetic aberrations, other events such as epigenetic changes or miRNA differential expression can also contribute to cancer progression. For example, tumor suppressor genes can be silenced and inactivated by hypermethylation of their promoter region (Jones et al., 2002). It is also known that miRNA can control the expression of their target mRNA to facilitate invasion, angiogenesis, tumor growth and immune invasion (Choudhury et al., 2012; Stahlhut et al., 2013). The up- or downregulation of miRNA can lead to the upregulation or silencing of their mRNA targets.
Several studies have focused on detecting cancer genome alterations and understanding how they affect the expression of the genes they hit (Gatza et al., 2014), but only few investigated the changes that the genetic aberrations and epigenetic changes can provoke in other genes due to gene interactions. DriverNet (Bashashati et al., 2012) captures the effects of genetic aberrations on transcription, but takes into account only direct interactions between genetically aberrant genes and their mRNA products. HotNet2 (Leiserson et al., 2015) uses a network diffusion approach that captures the global topology of the network and detects subnetworks that are significantly mutated. However, it uses only genetic aberrations and thus does not integrate other data types. TieDIE (Paull et al., 2013) uses a network diffusion algorithm that detects how genetic aberrations affect the expression of genes. Although TieDIE is able to perform this analysis per patient, it is not capable of deriving conclusions about cancer driver genes on a patient population. None of the above-mentioned methods has studied the effects of epigenetic changes or miRNA in the progression of cancer.
Here, we present NetICS (Network-based Integration of Multi-omics Data), a cancer gene prioritization method that provides a general computational framework for integrating diverse data types on a directed functional interaction network. NetICS is able to integrate different types of aberration events with differential expression data on the transcriptome and proteome level. It predicts how the aberration events evoke expression changes through gene interactions and predicts cancer genes that orchestrate a large number of these changes. NetICS uses a per-sample bidirectional network diffusion process and derives a robust population-level gene ranking by aggregating individual sample rankings (Fig. 1).
Fig. 1.
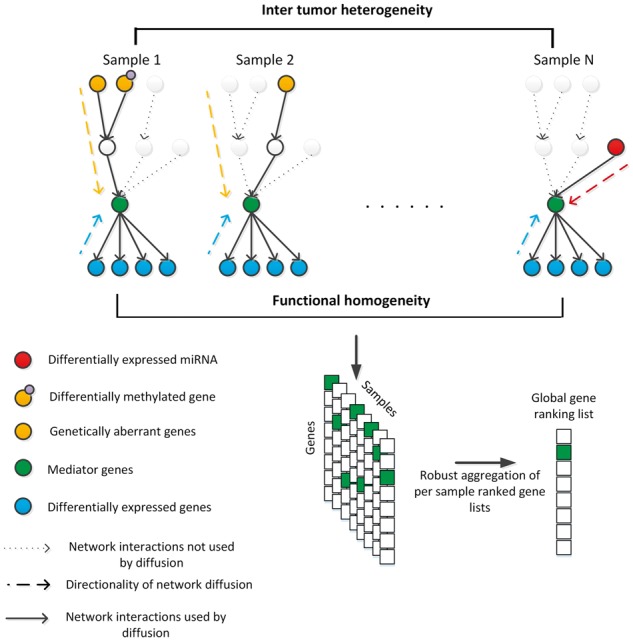
Overview of NetICS. NetICS predicts how aberrant genes or miRNAs (orange/red vertices) affect the expression of other genes (blue vertices) due to gene interactions (solid directed edges). Aberrant genes are affected by events which lead to the acquisition of cancer-related properties by the tumor cells such as uncontrolled cell proliferation. These events may include genetic aberrations, differential methylation of the gene promoter region, and interaction with differentially expressed miRNAs. A bidirectional network diffusion process that can capture the directionality of interactions (dashed lines) is used. The method attempts to detect mediator genes (green vertices) that orchestrate the expression changes downstream and are located between aberrant and differentially expressed genes. A ranked list of genes is generated for each sample separately based on the scores they acquire through network diffusion. These sample-specific lists are then fused into an overall ranked gene list representative of all samples (Color version of this figure is available at Bioinformatics online.)
We tested NetICS on five cancer types using TCGA data. We demonstrate that it is superior in prioritizing cancer genes and generates more robust gene lists when compared to network-based methods that perform network diffusion on the pooled set of aberrations across samples, such as, for example, TieDIE. We identified genes that are functionally homogeneous and participate in similar cancer-related pathways. NetICS provides a comprehensive framework that assists in understanding how sample-specific aberration events can affect the same gene targets in different ways and in explaining inter-patient mutational heterogeneity.
2 Materials and methods
2.1 Interaction network
We downloaded functional interactions from three different sources in order to construct a directed functional interaction network. The three sources included the databases Signor (Perfetto et al., 2016), Signalink (Fazekas et al., 2013) and the functional directed interaction network defined by Wu et al. (2010), who combined interactions reported in various databases, including Kegg (Kanehisa et al., 2017), Panther (Mi et al., 2017), NCI (Schaefer et al., 2009) and others, offering a large coverage of validated functional interactions. We also downloaded miRNA-gene interactions from miRTarBase (Chou et al., 2016), a database that contains experimentally validated interactions between miRNA and target genes. In order to ensure the creation of a highly confident interaction network, we only used interactions supported by experimental evidence. If an interaction was present in any of the four databases, we subsequently included the interaction in the final network.
The directionality of the interactions is essential for our method as it can help in explaining how aberration events in one gene lead to expression changes in other genes in the network. The network edges cover a variety of interaction types at different cellular levels, including (de)phosphorylation, expression/repression and activation/inhibition. By using only the interactions supported by experimental evidence, we covered 13 110 genes in total. In order for network diffusion to converge to a unique solution (steady state), we only used the largest connected component of the network, which contains 9260 genes and 351 724 interactions. We excluded self-interactions.
2.2 NetICS
NetICS predicts mediator genes, i.e. genes that are affected by proximal upstream-located aberrant genes or miRNA and affect proximal downstream-located differentially expressed genes. In the first step, aberration scores are diffused from the aberrant genes of the sample following the directionality of the network interactions. In the second step, differential expression scores are diffused from the differentially expressed genes of the sample in the opposite direction of the network edges (Fig. 1). Aberration and differential expression scores are defined as the normalized vector of aberration events or differential expression indicator variables (see below). An aberration event can disrupt a gene in different ways. It can be (i) a genetic aberration (somatic mutation or copy number variation), (ii) differential methylation in the gene’s promoter region or (iii) a differentially expressed miRNA that interacts with the corresponding gene and changes its mRNA expression significantly. We include these events only if both the miRNA and the target gene are significantly differentially expressed between tumor and normal tissue.
For network diffusion, we used the insulated heat diffusion as described in Leiserson et al. (2015). We define the normalized adjacency matrix W of the adjacency matrix A of the interaction network as
| (1) |
where D is the diagonal matrix of the out-degrees of nodes, and Aij = 1 if there is a directed edge from gene j to gene i and Aij = 0 otherwise. We define the diffusion matrix
| (2) |
which represents the connectivity between nodes j and i in entry Fij for a given restart probability β. For β, the degree of diffusion in the network, we do not know its optimal value for the network in advance. Hence, we assessed the performance of the methods for different values of β ranging from 0.001 to 1 and subsequently averaged over all the estimates. The value in Fij reflects the network proximity between nodes i and j (local topology) and the way that it is embedded in the entire network (global topology). The connectivity scores between the aberrant genes and all network genes of a sample are
| (3) |
where SM is the initial state vector of aberration scores. In order to find the influence scores of differential expression, we calculate
| (4) |
where
| (5) |
| (6) |
and is the diagonal matrix with the out-degrees of the nodes of in the diagonal, and SD is the initial state vector of differential expression scores.
The vectors SM and SD are initialized with uniform scores and respectively, where M is the number of the aberrant genes of the sample and D the number of the differentially expressed genes of the sample. The way the vectors SM and SD are defined we do not favor differentially expressed genes versus aberrant genes even if the number of the former is much higher compared to the number of the latter.
The final scores for all genes are computed as the Hadamard product
| (7) |
The vector E determines the mediator effect for each gene. A large entry in EM at position i means that gene i is proximal to many upstream-located aberrant genes or miRNA, and a large entry in ED at position i means that gene i is proximal to many downstream-located differentially expressed genes. The diffused matrix F is asymmetric and is able to capture the directionality of the network interactions. The directionality of the interactions is important in order to capture the situation where an upstream aberrant gene or miRNA leads to an expression change of its direct or indirect downstream interaction partners.
For each sample, a ranked list of all genes is generated according to the entries in the vector E. The sample-specific ranks of each gene are combined into a global ranking reflecting the importance of the gene across all samples. We expect a cancer gene to be highly ranked across many samples as this would indicate that it is functioning as a mediator gene. We model this by computing the area under the curve that connects the ranks of specific genes across different samples. To rank the genes, we used the sum of the per-sample ranks, which is proportional to the area under this curve (Supplementary Fig. S5). A small area implies a high number of low ranks. When more than one source of differential expression measurements are available, we use Fishers method (Mosteller and Fisher, 1948) to combine the P-values as
| (8) |
where pi is the P-value computed from the ith experiment and k the total number of independent experiments. The random variable X follows a chi-square distribution with 2k degrees of freedom. In our application of NetICS, the different data sources are RNA-seq-based gene expression measurements and protein abundance measured with the reverse phase protein array (RPPA) technique.
2.3 Evaluating performance in predicting known cancer genes
We defined the sets of known cancer genes for each cancer type by using two publicly available databases (Supplementary Section S1.1). In our classification problem, positives are the known cancer genes and negatives are all other network genes not in the positive set. For evaluating and comparing the performance of NetICS, we used the partial ROC measure, which accounts for the number of true positives that score higher than the nth highest scoring negative, measured for all values from 1 to n. It is defined as
| (9) |
where T is the total number of known cancer genes and Ti is the number of positives that score higher than the ith highest scoring negative (Scott et al., 2007). We use the partial ROC measure, because we are interested in comparing methods at low false positive rates (i.e. small n).
2.4 Pathway enrichment
For computing the enrichment of a given pathway in mediator, aberrant or differentially expressed genes, we used the hypergeometric distribution to compute the P-value
| (10) |
where M is the number of all network genes except the genes tested, K the number of genes in a known pathway, N the number of genes tested and x the number of common genes between the genes of the known pathway and the tested genes. P-values were adjusted for multiple testing by the Benjamini-Hochberg method (Yekutieli et al., 1999). We downloaded nine signaling pathways from the Reactome database (Croft et al., 2011), whose connection has been previously studied in cancer, such as Wnt and PI3K/AKT signaling.
2.5 Aberration events and RNA differential expression
We tested NetICS on five TCGA datasets, including uterine corpus endometrial carcinoma, liver hepatocellular carcinoma, bladder urothelial carcinoma, breast invasive carcinoma and lung squamous cell carcinoma. We downloaded the genetic aberrations (somatic mutations and copy number variations) from https://gdac.broadinstitute.org/. The ultramutator samples reported in syn1729383 as well as synonymous mutations were excluded. For mRNA and miRNA differential expression, we downloaded RNA-seq data from the same source. For the miRNA expression, we downloaded the Illumina HiSeq miRNA sequencing data. We performed differential gene expression analysis by using DESeq2 (Love et al., 2014). We compared each tumor sample against all normal samples and pooled genes being differentially expressed for each sample. We considered as significant the genes detected with an adjusted P-value lower than 0.05.
For the invasive breast carcinoma dataset, both RNA-seq and RPPA data for tumor and normal samples were available. For the RNA-seq data, we used DESeq2 to generate a P-value for the difference between the expression of tumor and normal samples. We modeled the RPPA data of each sample as a normal distribution and then computed a P-value for the tumor sample as
| (11) |
where is the cumulative distribution function of the standard normal distribution, m is the mean and s the standard deviation of the RPPA data, and t the RPPA value for the specific tumor sample. We used the Kolmogorov-Smirnov test to assess if the RPPA data of each sample follows a normal distribution. We combined the P-values for RNA and RPPA by using Fisher’s method. After FDR correction (Yekutieli et al., 1999), we kept only those genes with a P-value of less than 0.05.
For the methylation data, we first downloaded the infinium HumanMethylation450 Manifest file from the Illumina website. The file contains information on 486 428 methylation sites, each named with a unique cg-number ID and provides several informative features such as the original gene name and the gene region. We only used methylation sites in the 5′ untranslated region, where the promoter binds and which is often differentially methylated in tumor samples (Jones et al., 2002). A total of 65 535 methylation sites were located in this region. For each cancer type, we used the Human Methylation 450 dataset that is available at https://gdac.broadinstitute.org/. For each gene, we performed a Wilcoxon test between the beta values of the methylation sites located in the 5′ untranslated region between the tumor and the matched normal sample. We only used significantly differentially methylated genes that exhibited an adjusted P-value below 0.05. To adjust the P-values we used a false discovery rate of 0.05.
3 Results
We have developed NetICS, a network-based method for prioritizing cancer genes by integrating multi-omics data (Fig. 1), including genetic aberrations, mRNA and miRNA expression, as well as differential methylation at the gene promoter region. NetICS performs a per-sample bidirectional network diffusion on a directed functional interaction network and creates a ranked gene list for each sample. It then integrates the sample-specific ranked gene lists to generate a global ranking for all samples by using a robust rank aggregation technique (Supplementary Fig. S4).
3.1 Prediction of known cancer genes
NetICS ranks genes according to their predicted involvement in cancer progression. To assess the rankings, we predicted known cancer genes (Supplementary Section S1.1). As negative examples in the prediction task, we used all other network genes that are not in the positive set of known cancer genes.
We compared NetICS to two other methods that perform network diffusion by using gene scores pooled over all samples. By Pool1dir we denote the method that pools aberrant genes across all samples by initializing the gene scores with their population frequencies before propagating them through the network. Pool1dir is the network diffusion process used in HotNet2 (Leiserson et al., 2015). By Pool2dir, we denote the method that pools both the aberrant and the differentially expressed genes across all samples. In Pool2dir, the gene scores are initialized with their aberration or differential expression frequencies, before bidirectional diffusion propagates them through the network, by diffusing the aberration scores towards the directionality of the network’s interactions and the differential expression scores opposite of the directionality of the network’s interactions. After that, these two scores are integrated by computing their minimum as suggested by Paull et al. (2013) for TieDIE. For network diffusion, we used insulated heat diffusion as implemented in HotNet2 (Leiserson et al., 2015) for all the methods. We also tested two simple prioritization schemes that prioritize the genes based on their aberration frequency (Aber. Fr.) and their differential expression frequency (RNA DE Fr.) in the population without using any network information.
For computing performance as the partial AUC measure AUCn, we executed every method 10 times by bootstrapping the available samples. The same 10 datasets of the samples derived from bootstrapping were used in each method. We computed AUCn for n = 50, 100 and 150. With these performance estimates, we focus on the highest ranked genes because those are the genes that one would consider for further biological interpretation or experimental validation.
We observed that NetICS has a better performance than the other methods for all datasets meaning that it is able to rank the known cancer genes higher (Fig. 2, Supplementary Fig. S9). We also observed that NetICS exhibits on average a higher performance for any individual value of the restart probability, as compared to the pooling-based network diffusion methods (Supplementary Fig. S3). The restart probability determines the degree of diffusion, namely how far the random walker can move in the network. Pool2dir exhibited the worst performance indicating that using mRNA data by pooling all samples is less efficient in predicting cancer genes than using each sample individually for diffusion. Pool1dir exhibited in general a lower performance compared to NetICS and reached its highest AUC for restart probabilities lower than 0.5, for all cancer types (Fig. 2). This is because a random walker starting at an aberrant gene needs a restart probability of more than 1/2 in order to weight the neighbors of the aberrant gene more than the gene itself at the equilibrium state (Eq. 2). Depending on the average distance of the mediator genes from their upstream aberrant genes, Pool1dir reaches its optimal performance for a relatively low value of the restart probability in all cancer types (Supplementary Fig. S3). This fact does not hold for NetICS where we observe that the maximum performance is achieved on average for a low value of the restart probability but there is a wider range of restart probabilities for which a performance close to the maximum is reached. Thus, NetICS is more robust to changes of the restart probability due to the transformation of the diffusion scores into ranks, and most often a value between 0.2 and 0.6 gives close to optimal performance for any cancer type. The ranking also accounts for differences in the scale of diffusion scores among samples. NetICS’ robustness to changes in the restart probability is illustrated in a small example of 4 samples and 13 genes in Supplementary Figures S1 and S2.
Fig. 2.
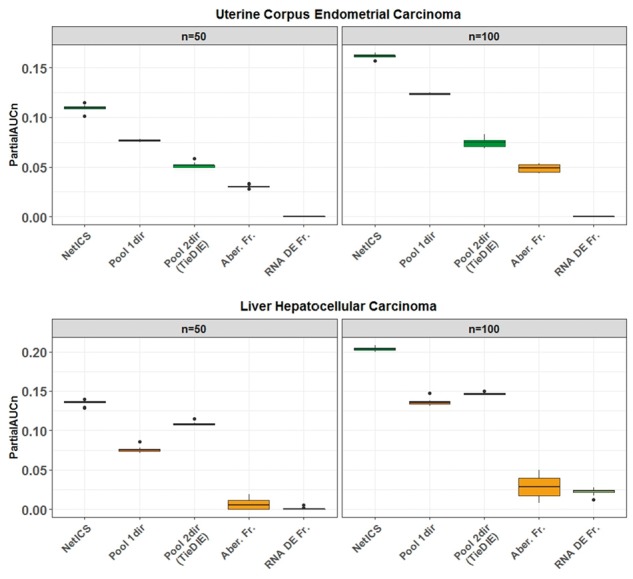
Comparison of gene prioritization methods. We compared the performance of NetICS to four methods including pooling aberrant genes from all samples before diffusion (Pool1dir), pooling both aberrant and differentially expressed genes from all samples before bidirectional diffusion (Pool2dir), ranking by frequency of aberrant genes across all samples (Aber. Fr.) and ranking by frequency of differentially expressed genes across all samples (RNA DE Fr.). By bootstrapping the available samples 10 times, we computed the partial AUC for n = 50, 100 (x-axis). The performance was tested on the TCGA datasets of uterine corpus endometrial carcinoma (top) and liver hepatocellular carcinoma (bottom)
Overall, NetICS’ performance was statistically higher than all other methods. In specific, NetICS’ AUC50 was statistically higher than the next highest performing method which was Pool1dir (Wilcoxon ranksum, ) in the uterine corpus endometrial carcinoma dataset. Similarly, NetICS’ AUC50 was statistically higher than the next highest performing method which was Pool2dir (Wilcoxon ranksum, ) in the liver hepatocellular carcinoma dataset.
The two simple prioritization schemes that prioritize the genes based on their aberration (Aber. Fr.) or differential expression frequency (RNA DE Fr.) in the population without using any network information exhibited the worst performance, indicating the importance of using network interactions in the task of cancer gene prioritization (Fig. 2 and Supplementary Fig. S9). The main difference between the network-based methods is that Pool1dir and Pool2dir perform network diffusion by first pooling all aberration events and therefore prioritization is performed by taking into account the network distance between aberrant genes or miRNA across all samples. By contrast, NetICS performs a per-sample network diffusion and is able to capture the sample-specific causes of the same gene expression changes.
3.2 Stability of cancer gene predictions
We tested the stability of rankings obtained by the different methods using bootstrapping. We assessed stability by computing the Spearman correlation between the 10 ranked gene lists that resulted from the bootstrapping repeats. For each method, we computed the Spearman correlation between all the possible pairs of the 10 ranked lists. We found that NetICS is more stable compared to the other methods exhibiting on average a close to 100% correlation between the ranked gene lists that resulted from bootstrapping, whereas Pool1dir and Pool2dir exhibited correlation ranging from 92 to 99% (Fig. 3 and Supplementary Fig. S10). The higher stability of NetICS can be attributed to aggregating the per-sample ranks. Pool2dir is less stable than Pool1dir, because there are more differences in the initial gene scores for network diffusion in the different bootstrap repeats, because Pool2dir initializes genes based on their frequency for both aberrations and differential expression.
Fig. 3.
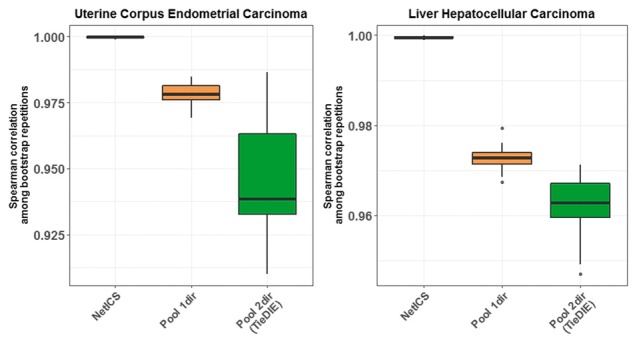
Stability of ranked gene lists. Shown are box plots demonstrating the stability between the ranked gene lists of each method among 10 bootstrap repeats. The boxes represent the average Spearman correlation (y-axis) between all possible pairs of the 10 ranked gene lists produced from the 10 bootstrap repeats. We compared three methods (x-axis) including NetICS, Pool1dir and Pool2dir. Stability was tested on the TCGA datasets of uterine corpus endometrial carcinoma (left) and liver hepatocellular carcinoma (right)
We also tested the stability of the methods when the network was perturbed by randomly deleting, adding or reversing edges. We tested different percentages of deleted, added and reversed edges ranging from 10 to 90% with respect to the total number of network’s edges. We computed the Spearman correlation between the ranked gene list when methods were used with the original network and the ranked gene lists when methods were used with the perturbed networks. We observed that all methods are robust to changes in the edges of the network, with NetICS and Pool1dir being more robust than Pool2dir (Supplementary Figs S11–S13). Specifically, NetICS exhibited on average 84% correlation with the gene ranks from the original network when as much as 90% of the total edges were removed. Pool2dir exhibited on average 65% correlation for the same experiment. All methods were more robust to the addition of random edges compared to the random deletion of existing edges. NetICS exhibited on average 92% correlation with the gene ranks on the original network when 90% random edges of the initial number of network edges were added. Pool2dir exhibited on average 70% correlation for the same experiment.
3.3 Pathway enrichment
We used the highest ranked mediator genes for each cancer type to perform pathway enrichment analysis and compared the findings to those obtained from ranked genes based on aberration or differential expression frequency across the samples (Supplementary Fig. S6). We downloaded the genes of nine signaling pathways from the Reactome database. These are signaling pathways whose properties have been previously studied in cancer, such as the Wnt and the PI3K/AKT signaling pathways. We found that the highest ranked mediator genes are more enriched in the signaling pathways compared to genes ranked based on aberration and differential expression frequency. This trend was observed in all tested cancer types. Hence, the mediator genes detected by NetICS are more functionally homogeneous with respect to the specific signaling pathways. The fact that mediator genes are more functionally homogeneous than aberrant genes is in line with the assumption of NetICS that heterogeneity in aberration events across samples can be explained by convergence in the network to functionally homogeneous mediator genes (Fig. 1).
3.4 Specific examples of mediator genes
As a proof of concept, we analyzed two mediators that NetICS predicted for breast cancer, namely EP300 and TP53, in more detail and examined their upstream aberrant and downstream differentially expressed genes (Supplementary Figs S7 and S8). Both EP300 (Gayther et al., 2000) and TP53 are well-characterized tumor suppressors.
EP300 protein is a histone acetyltransferase for all four-core histones in nucleosomes. Breast carcinomas express extremely low levels of EP300. However, mutations in EP300 are not very common ( breast cancer samples with EP300 mutations in Cosmic). NetICS predicted that EP300 is a mediator gene for breast cancer. Specifically, it identified five direct upstream aberrant genes or miRNAs in 50% of the tumor samples, namely ARNT, MED13, MED24, CITED1 and HSA-MIR-429, and three direct downstream differentially expressed genes which are known to be cancer-related, namely TP53, AKT1 and MYC (Supplementary Fig. S7a). ARNT (or HIF-1β) is a gene that acts in complex with EP300 and was found mutated in 7% of the tumor samples. Specifically, HIF-1α or HIF-2α dimerize with HIF-1β to form the HIF-1 or HIF-2 transcription factor, respectively. HIF1/2 transcription factors bind to the HRE (HIF1/2 response element) in the presence of EP300 coactivator, to regulate the transcription of target genes like VEGFA, which is an oncogene. Although ARNT was downregulated in most samples, in the samples where it is amplified, it was found to be upregulated. Hence, when amplified, ARNT appears to lead to upregulation of the oncogene VEGFA with the help of EP300 as a mediator.
Moreover, MED13 and MED24 are proteins that act in complex with EP300 and are less explored in the context of tumorigenesis. Our method suggests that MED13 and MED24 should be further investigated for their role in downregulating EP300 in tumorigenesis. CITED1 is a gene that is hypermethylated at the promoter region and therefore, downregulated at its mRNA level. Its downregulation is a possible cause for EP300’s down regulation. Reports suggest that miR-429 expression is up-regulated in human colorectal cancer (Li et al., 2013) and serous ovarian carcinoma tissues (Nam et al., 2008), and this high expression is associated with increased tumor size and poor prognosis. NetICS has classified miR-429 as an upstream regulator of EP300 (Mees et al., 2009). Thus, an increase in miR-429 levels could reduce EP300 expression. EP300 controls the stability of TP53, an important tumor suppressor. Reduced expression of EP300 can lead to a lower expression of TP53. In addition, EP300 in complex with other proteins induce acetylation and inactivation of AKT. The lower expression of EP300 could be the cause of increased AKT1 stability that aids tumorigenesis. Further, EP300 is able to maintain genomic integrity by negatively regulating MYC (Sankar et al., 2009). Loss of EP300 expression could be a potential cause of MYC upregulation, a known oncogene in breast cancer. We detected a mutually exclusive mutation pattern in the samples among ARNT, TP53, MYC and AKT1, further enhancing the idea that aberrations in these four genes might be alternative ways to disrupt the same cellular pathway (Supplementary Fig. S7b).
The tumor suppressor TP53 is crucial to sense and respond to a variety of cellular stresses and induce cell cycle arrest or senescence. NetICS predicted that TP53 is a mediator gene for breast cancer and has five direct upstream genes, namely AKT1, BDNF, MYC, CREBBP and miR-425, which together exhibit aberrations in about 50% of the available breast cancer samples. Directly downstream, TP53 interacts with 4 other genes, namely BAI, TSC1, DDB2 and GADD45A, which are significantly down-regulated in tumor samples as compared to normal samples (Supplementary Fig. S8a). AKT1 is a member of AKT signaling and it is known that active AKT signaling mediates degradation of the tumor suppressor TP53 (Abraham et al., 2014). Hence, overexpression of AKT1 could be the cause of TP53 downregulation. Somatic mutations detected in AKT1 (E17K) are known to exhibit oncogenic properties and activate downstream signaling by localizing AKT to the plasma membrane (Carpten et al., 2007).
Interestingly, TP53 has been suggested to be indirectly regulated by MYC with the help of MDM2 (Phesse et al., 2014), and it would be interesting to examine how aberrations in MYC affect the expression of TP53. More precisely, MYC overexpression leads to MDM2 overexpression which is known to inhibit TP53 via binding to its N-terminal domain and leading to its proteolytic digestion (Zhou et al., 2016). Finally, CREBBP is an important coactivator of TP53 responsible for its transcriptional activity (Roeder et al., 1997). Thus, loss of CREBBP function by mutations mimics and abolishes TP53 function. Some of the upstream genes, for example, TP53, AKT1, MYC and CREBBP, follow a mutually exclusive mutation pattern (Supplementary Fig. S8b), implying that they might be alternative hits to disrupt the expression of TP53. Downstream of TP53, there are several genes whose expression is controlled by TP53. Upon downregulation of TP53, the expression of these genes is also downregulated. Some of them have tumor suppressive properties. For example, TSC1 is a strong tumor suppressor and BAI1 is an angiogenesis inhibitor.
Apart from well-studied cancer genes, NetICS was able to detect less known, recently discovered cancer genes. In lung cancer dataset, XPO1, a recently discovered oncogene, was recovered in top 1% of the ranked gene list. Inhibitors for XPO1 are a promising therapeutic strategy for lung (Kim et al., 2016) and ovarian (Chen et al., 2017) cancer. Another oncogene, PLCG1, recovered in top 1% of the ranked gene list in hepatocellular carcinoma, was recently also shown to exhibit recurrent activating mutations in angiosarcoma (Behjati et al., 2014) and somatic mutations in cutaneous T-cell lymphomas (Vaqué et al., 2014) that lead to increased cell proliferative mechanisms. Finally, GNG2, a gene shown recently to inhibit metastasis in human melanoma cells with decreased FAK activity (Yajima et al., 2014), was predicted as mediator gene (top 1%) in the uterine corpus endometrial carcinoma dataset and found downregulated in 31% of the tumor samples (Supplementary Fig. S14).
4 Discussion
We have developed NetICS, a new method for prioritizing cancer genes based on the integration of multi-omics data on a directed functional interaction network. NetICS provides a flexible computational framework for per-sample network-based integration of a variety of data sources that include causal (genetic aberrations, differential methylation of the promoter region and miRNA differential expression) and consequential cancer events (gene and protein expression measurements). In our applications of NetICS, we have integrated different types of genetic aberrations, namely somatic mutations and copy number variations as well as methylation and miRNA expression data. In the future, one may integrate additional types of more complex mutational patterns. For example, most cancer types exhibit changes in chromosome number (aneuploidy), and more complex rearrangements, such as kataegis (Nik-Zainal et al., 2012) and chromothripsis (Stephens et al., 2011), have been described. NetICS is capable of fusing different types of differential expression measurements, for example, transcriptomics and proteomics. We have used Fisher’s method to combine P-values of differential gene expression obtained from RNA-seq count data and protein expression derived from RPPA experiments (Spurrier et al., 2008). The same approach will also allow to fuse other types of differential expression measurements, for example, at the phosphoproteome level. There are several ongoing efforts for characterizing the TCGA tumors in terms of their proteome and phosphoproteome such as Koboldt et al. (2012) and Coscia et al. (2016). In the future, it will be interesting to incorporate these data at the level of differentially expressed genes (blue-colored nodes at Fig. 1).
We demonstrated that NetICS was able to detect both frequently (e.g. TP53) and infrequently (e.g. EP300) aberrant genes. A gene that is aberrant in several samples will, in general, be ranked higher than non-aberrant genes, because of the restart probability of the random walker during network diffusion. A high ranking score in the rest of the samples will imply a mediator effect for the gene, when it is not aberrant. This is the main reason why NetICS was successful in ranking high genes that are silent, i.e. not affected by mutation. Another gene detected by NetICS that exhibits low mutational frequency in breast cancer is AKT1, which is aberrant in less than 1% of the samples, while other genes exhibit high mutational frequencies, such as KRAS in lung squamous cell carcinoma which is aberrant in 26% of the sample. In the TCGA breast cancer dataset, NetICS identified in the top 5% of the list genes related to breast cancer, such as PTEN, TP53, CDH1 and ERBB2. Similarly, in the lung cancer dataset, NetICS identified known lung cancer genes such as AKT1, EGFR, KRAS, NRAS and PIK3CA among the top 5% of the ranked genes (Supplementary Tables S6–S10).
NetICS provides insight on how aberration events that are very different between samples of the same cancer type can lead to the same expression changes in other genes due to gene interactions. The aberration events include aberrations in the genome, differential methylation and significantly differentially expressed miRNA between tumor and normal tissue. This fact can aid in distinguishing driver from passenger aberration events. For example, the driver mutations will possibly be the ones affecting the same downstream targets, i.e. the mediator genes. In the same way, NetICS can help in the detection of cancer driver genes that are aberrant in a small part of the tumor samples and are difficult to detect with a frequency-based method. However, we acknowledge that NetICS can only examine the effects of genes that are present in the interaction network. Moreover, the results may be biased towards highly connected genes as these have a higher chance of having aberrant or differentially expressed genes in their network neighborhood. However, as already shown in Leiserson et al. (2015), the asymmetric diffusion function that NetICS uses (Eq. 2) is less biased towards hubs than previously used symmetric diffusion techniques.
NetICS is a general and flexible computational method for processing various cancer-related events on the network level. It can help identify new cancer genes that act either silently or explicitly in promoting cancer progression. A tumor suppressor can be mutated in one sample leading to its loss of function, whereas in another sample, the same tumor suppressor might not be mutated but still downregulated because of a nearby interacting gene which is genetically altered. By identifying the heterogeneous causal cancer events that converge to functionally related mediator genes, NetICS can elucidate the different ways in which the same pathways are affected in different samples. Eventually, new personalized diagnostic and therapeutic opportunities across cancer types may arise in this manner, for example, by drug repositioning.
Funding
This work has been supported by the SIB Fellowship Programme, ERC Synergy Grant 609883, SystemsX.ch RTD Grant 2013/150, and the EC Horizon 2020 project 633974 SOUND.
Conflict of Interest: none declared.
Supplementary Material
References
- Abraham A.G. et al. (2014) PI3k/akt-mediated regulation of p53 in cancer. Biochem. Soc. Trans., 42, 798–803. [DOI] [PubMed] [Google Scholar]
- Bashashati A. et al. (2012) DriverNet: uncovering the impact of somatic driver mutations on transcriptional networks in cancer. Genome Biol., 13, R124.. [DOI] [PMC free article] [PubMed] [Google Scholar]
- Behjati S. et al. (2014) Recurrent PTPRB and PLCG1 mutations in angiosarcoma. Nat. Genet., 46, 376–379. [DOI] [PMC free article] [PubMed] [Google Scholar]
- Bersanelli M. et al. (2016) Methods for the integration of multi-omics data: mathematical aspects. BMC Bioinformatics, 17: S15. [DOI] [PMC free article] [PubMed] [Google Scholar]
- Burrell R.A. et al. (2013) The causes and consequences of genetic heterogeneity in cancer evolution. Nature, 501, 338–345. [DOI] [PubMed] [Google Scholar]
- Carpten J.D. et al. (2007) A transforming mutation in the pleckstrin homology domain of AKT1 in cancer. Nature, 448, 439–444. [DOI] [PubMed] [Google Scholar]
- Chen Y. et al. (2017) Inhibition of the nuclear export receptor XPO1 as a therapeutic target for platinum-resistant ovarian cancer. Clin. Cancer Res., 23, 1552–1563. [DOI] [PubMed] [Google Scholar]
- Chou C.H. et al. (2016) mirtarbase 2016: updates to the experimentally validated mirna-target interactions database. Nucleic Acids Res., 44, D239.. [DOI] [PMC free article] [PubMed] [Google Scholar]
- Choudhury Y. et al. (2012) Attenuated adenosine-to-inosine editing of microrna-376a* promotes invasiveness of glioblastoma cells. J. Clin. Investig., 122, 4059–4076. [DOI] [PMC free article] [PubMed] [Google Scholar]
- Coscia F. et al. (2016) Integrative proteomic profiling of ovarian cancer cell lines reveals precursor cell associated proteins and functional status. Nat. Commun., 7, 12645.. [DOI] [PMC free article] [PubMed] [Google Scholar]
- Croft D. et al. (2011) Reactome: a database of reactions, pathways and biological processes. Nucleic Acids Res., 39, D691–D697. [DOI] [PMC free article] [PubMed] [Google Scholar]
- Dimitrakopoulos C. et al. (2016) Computational approaches for the identification of cancer genes and pathways. WIREs Syst. Biol. Med, 9, e1364. [DOI] [PMC free article] [PubMed] [Google Scholar]
- Fazekas D. et al. (2013) Signalink 2: a signaling pathway resource with multi-layered regulatory networks. BMC Syst. Biol., 7, 7–1. [DOI] [PMC free article] [PubMed] [Google Scholar]
- Gatza M.L. et al. (2014) An integrated genomics approach identifies drivers of proliferation in luminal-subtype human breast cancer. Nat. Genet., 46, 1051–1059. [DOI] [PMC free article] [PubMed] [Google Scholar]
- Gayther S.A. et al. (2000) Mutations truncating the EP300 acetylase in human cancers. Nat. Genet., 24, 300–303. [DOI] [PubMed] [Google Scholar]
- Holland A.J. et al. (2012) Chromoanagenesis and cancer: mechanisms and consequences of localized, complex chromosomal rearrangements. Nat. Med., 18, 1630–1638. [DOI] [PMC free article] [PubMed] [Google Scholar]
- Jones P.A. et al. (2002) The fundamental role of epigenetic events in cancer. Nat. Rev. Genet., 3, 415–428. [DOI] [PubMed] [Google Scholar]
- Kanehisa M. et al. (2017) KEGG: new perspectives on genomes, pathways, diseases and drugs. Nucleic Acids Res., 45, D353–D361. [DOI] [PMC free article] [PubMed] [Google Scholar]
- Kim J. et al. (2016) XPO1-dependent nuclear export is a druggable vulnerability in KRAS-mutant lung cancer. Nature, 538, 114–117. [DOI] [PMC free article] [PubMed] [Google Scholar]
- Koboldt D.C. et al. (2012) Comprehensive molecular portraits of human breast tumours. Nature, 490, 61–70. [DOI] [PMC free article] [PubMed] [Google Scholar]
- Lawrence M.S. et al. (2013) Mutational heterogeneity in cancer and the search for new cancer-associated genes. Nature, 499, 214–218. [DOI] [PMC free article] [PubMed] [Google Scholar]
- Leiserson M.D.M. et al. (2015) Pan-cancer network analysis identifies combinations of rare somatic mutations across pathways and protein complexes. Nat. Genet., 47, 106–114. [DOI] [PMC free article] [PubMed] [Google Scholar]
- Li J. et al. (2013) MiR-429 is an independent prognostic factor in colorectal cancer and exerts its anti-apoptotic function by targeting SOX2. Cancer Lett., 329, 84–90. [DOI] [PubMed] [Google Scholar]
- Love M.I. et al. (2014) Moderated estimation of fold change and dispersion for RNA-seq data with DESeq2. Genome Biol., 15, 550. [DOI] [PMC free article] [PubMed] [Google Scholar]
- Mees S.T. et al. (2009) EP300—a miRNA-regulated metastasis suppressor gene in ductal adenocarcinomas of the pancreas. Int. J. Cancer, 126, 114–124. [DOI] [PubMed] [Google Scholar]
- Mi H. et al. (2017) PANTHER version 11: expanded annotation data from gene ontology and reactome pathways, and data analysis tool enhancements. Nucleic Acids Res., 45, D183–D189. [DOI] [PMC free article] [PubMed] [Google Scholar]
- Mosteller F., Fisher R.A. (1948) Questions and answers. Am. Stat., 2, 30. [Google Scholar]
- Nam E.J. et al. (2008) MicroRNA expression profiles in serous ovarian carcinoma. Clin. Cancer Res., 14, 2690–2695. [DOI] [PubMed] [Google Scholar]
- Nik-Zainal S. et al. (2012) Mutational processes molding the genomes of 21 breast cancers. Cell, 149, 979–993. [DOI] [PMC free article] [PubMed] [Google Scholar]
- Paull E.O. et al. (2013) Discovering causal pathways linking genomic events to transcriptional states using tied diffusion through interacting events (TieDIE). Bioinformatics, 29, 2757–2764. [DOI] [PMC free article] [PubMed] [Google Scholar]
- Perfetto L. et al. (2016) Signor: a database of causal relationships between biological entities. Nucleic Acids Res., 44, D548–D554. [DOI] [PMC free article] [PubMed] [Google Scholar]
- Phesse T.J. et al. (2014) Endogenous c-myc is essential for p53-induced apoptosis in response to DNA damage in vivo. Cell Death Diff., 21, 956–966. [DOI] [PMC free article] [PubMed] [Google Scholar]
- Roeder R.G. et al. (1997) Synergistic activation of transcription by CBP and p53. Nature, 387, 819–823. [DOI] [PubMed] [Google Scholar]
- Sankar N. et al. (2009) c-myc-induced aberrant DNA synthesis and activation of DNA damage response in p300 knockdown cells. J. Biol. Chem., 284, 15193–15205. [DOI] [PMC free article] [PubMed] [Google Scholar]
- Schaefer C.F. et al. (2009) PID: the pathway interaction database. Nucleic Acids Res., 37, D674–D679. [DOI] [PMC free article] [PubMed] [Google Scholar]
- Scott M.S. et al. (2007) Probabilistic prediction and ranking of human protein-protein interactions. BMC Bioinformatics, 8, 239.. [DOI] [PMC free article] [PubMed] [Google Scholar]
- Spurrier B. et al. (2008) Reverse-phase protein lysate microarrays for cell signaling analysis. Nat. Protoc., 3, 1796–1808. [DOI] [PubMed] [Google Scholar]
- Stahlhut C. et al. (2013) Micrornas and the cancer phenotype: profiling, signatures and clinical implications. Genome Med., 5, 111.. [DOI] [PMC free article] [PubMed] [Google Scholar]
- Stephens P.J. et al. (2011) Massive genomic rearrangement acquired in a single catastrophic event during cancer development. Cell, 144, 27–40. [DOI] [PMC free article] [PubMed] [Google Scholar]
- Vaqué J.P. et al. (2014) PLCG1 mutations in cutaneous t-cell lymphomas. Blood, 123, 2034–2043. [DOI] [PubMed] [Google Scholar]
- Vogelstein B. et al. (2013) Cancer genome landscapes. Science, 339, 1546–1558. [DOI] [PMC free article] [PubMed] [Google Scholar]
- Wu G. et al. (2010) A human functional protein interaction network and its application to cancer data analysis. Genome Biol., 11, R53.. [DOI] [PMC free article] [PubMed] [Google Scholar]
- Yajima I. et al. (2014) Gng2 inhibits invasion of human malignant melanoma cells with decreased fak activity. Am. J. Cancer Res., 4, 182–188. [PMC free article] [PubMed] [Google Scholar]
- Yekutieli D. et al. (1999) Resampling-based false discovery rate controlling multiple test procedures for correlated test statistics. J. Stat. Plan. Inf., 82, 171–196. [Google Scholar]
- Zhou X. et al. (2016) Nerve growth factor receptor negates the tumor suppressor p53 as a feedback regulator. eLife, 5, [DOI] [PMC free article] [PubMed] [Google Scholar]
Associated Data
This section collects any data citations, data availability statements, or supplementary materials included in this article.