

Abstract
Fetal Alcohol Spectrum Disorders, or FASD, represent a range of adverse developmental conditions caused by prenatal ethanol exposure (PrEE) from maternal consumption of alcohol. PrEE induces neurobiological damage in the developing brain leading to cognitive-perceptual and behavioral deficits in the offspring. Alcohol-mediated alterations to epigenetic function may underlie PrEE-related brain dysfunction, with these changes potentially carried across generations to unexposed offspring. To determine the transgenerational impact of PrEE on neocortical development, we generated a mouse model of FASD and identified numerous stable phenotypes transmitted via the male germline to the unexposed third generation. These include alterations in ectopic intraneocortical connectivity, upregulation of neocortical Rzrβ and Id2 expression accompanied by both promoter hypomethylation of these genes and decreased global DNA methylation levels. DNMT expression was also suppressed in newborn PrEE cortex, providing further insight into how ethanol perturbs DNA methylation leading to altered regulation of gene transcription. These PrEE-induced, transgenerational phenotypes may be responsible for cognitive, sensorimotor, and behavioral deficits seen in humans with FASD. Thus, understanding the possible epigenetic mechanisms by which these phenotypes are generated may reveal novel targets for therapeutic intervention of FASD and lead to advances in human health.
Keywords: alcohol, behavior, epigenetics, heritability, neocortex
Introduction
The Centers for Disease Control (CDC) have issued repeated warnings about the dangers of drinking during pregnancy; however, rates of alcohol, or ethanol, consumption during pregnancy remain high, with 18.6% of pregnant women aged 30–44 reporting drinking during pregnancy (Tan et al. 2015). The most recent epidemiological data suggests that Fetal Alcohol Spectrum Disorders (FASD) and prenatal ethanol exposure (PrEE)-related developmental dysfunctions are present in at least 2–5% of the US population (Hoyme et al. 2005; May et al. 2014).
Animal studies have been critical to our understanding of how PrEE impacts brain development, leading to adverse outcomes in the developing child. Recently, our laboratory developed a novel murine model of FASD and identified a series of PrEE-induced phenotypes in offspring brain and behavior. Specifically, we found that PrEE throughout gestation induced abnormal patterns of gene expression of Rzrβ, Cad8, and Id2 within mouse neocortex, the part of the brain responsible for complex behavior and cognition in humans (El Shawa et al. 2013). The altered gene expression likely caused atypical and ectopic targeting of intraneocortical connections (INCs) in newborn sensory neocortex, as these 2 processes have been linked in the past (Huffman et al. 2004). Furthermore, 20 day-old PrEE mice demonstrated abnormal motor behavior and increased anxiety, findings consistent with other rodent models of FASD (Cullen et al. 2013; Tong et al. 2013).
Traditionally, prenatal ethanol exposure was thought to solely impact directly exposed offspring. Emerging evidence, however, suggests that the effects of PrEE could persist transgenerationally (Govorko et al. 2012). Neurobiologists have suggested that PrEE may generate tissue-specific epigenetic modifications that pass on to future generations leading to dysfunction in unexposed offspring (Bekdash et al. 2013; Mead and Sarkar 2014; Finegersh et al. 2015; Marjonen et al. 2015).
Epigenetic modifications, including alterations to DNA methylation patterns and histone methylation/acetylation, serve as a point of teratogenic interaction for ethanol during development, where it can generate permanent and widespread changes to gene expression (Renthal and Nestler 2009; Govorko et al. 2012). Altered DNA methylation in response to PrEE has been described in distinct brain regions and cell types, including hippocampal tissue and proopiomelanocortin (POMC) neurons of the hypothalamus (Bekdash et al. 2013; Marjonen et al. 2015). These alterations can be meiotically heritable and transmitted across generations, affecting gene expression in individuals not directly exposed to ethanol (Govorko et al. 2012). Data from human studies suggest that alcohol-related disorders can be transferred across generations; specifically, descendants from alcoholic maternal grandmothers exhibit higher rates of major depressive disorders that are co-morbid with alcohol-use disorders and FASD (Kvigne et al. 2008; Olino et al. 2008).
Here, we extend our previous findings in directly exposed PrEE mice by demonstrating PrEE-induced transgenerational effects on developing neocortex and behavior, persisting from the exposed offspring or first filial generation (F1) to the third generation (F3). Stable DNA hypomethylation within neocortex is believed to be critical for proper gene expression and brain development. We document PrEE-induced changes in methylation in neocortical tissues that are associated with reduced expression of 3 proteins responsible for DNA methylation: DNA methyltransferase (DNMT)1, 3A, and 3B. Additionally, we document persistent, transgenerational alterations in cortical gene expression and INCs. Transgenerationally stable deficits in sensorimotor function, as well as increases in anxiety and depressive-like states accompany the PrEE-induced abnormalities in gene expression and neuroanatomy. Although correlational data from multi-level analyses cannot confirm causal relationships with certainty, they are compelling and demonstrate important potential links. In this study, we focus on PrEE’s impact on neocortical development, as the neocortex is a primary nervous system structure for complex cognition, perception, and behavior. However, PrEE-induced structural and functional changes in subcortical neuroanatomy most certainly play a role in FASD phenotypes and will be described in a future report (Abbott et al. 2016).
Although the notion that prenatal exposure to ethanol can damage the embryo or fetus is not new, our findings represent novel multi-level analyses that provide evidence supporting the heritability of FASD. Thus, by using molecular, neuroanatomical, and behavioral techniques, we provide strong support for the hypothesis that in utero ethanol exposure generates heritable effects in subsequent generations. In order to prevent and treat the many outcomes of prenatal ethanol exposure, we must uncover the mechanisms underlying transgenerational inheritance in this model system.
Materials and Methods
Mouse Colony and Transgenerational Breeding Paradigm
All breeding and experimental studies were performed in strict agreement with protocols approved by the Institutional Animal Care and Use Committee at the University of California, Riverside. CD1 mice, initially purchased from Charles River Laboratories, were used for all experiments. P90 female mice were paired with male breeders; the male was removed from the cage after detection of the vaginal plug, and noon of that day was set as gestational day (GD) or embryonic day (E) 0.5. Pups born from ethanol-treated and control dams were cross-fostered. F2 animals were generated by breeding F1 males with control females; F3 animals were generated by breeding F2 males with control females (see Supplementary Materials 1 and 2 for detailed methods and breeding paradigm). The number of animals used in each experiment is listed in Table 1, with equal numbers (±2) of males and females included in each experiment.
Table 1.
Experimental replicates. List of replicates obtained in each experiment
| Control | F1 | F2 | F3 | |
|---|---|---|---|---|
| BEC | 7 | 15 | 7 | 7 |
| Plasma osmolality | 10 | 10 | 10 | 10 |
| Body weight | 42 | 90 | 38 | 25 |
| Brain weight | 23 | 19 | 22 | 10 |
| Cortical length | 9 | 16 | 15 | 10 |
| INC tracing/cell counts | 10 | 10 | 9 | 10 |
| RT-qPCR | 5 | 5 | 5 | 5 |
| Global 5 mC | 5 | 5 | 5 | 5 |
| Global 5 hmC | 5 | 5 | 5 | 5 |
| Promoter methylation | 5 | 5 | 5 | 5 |
| Rotarod | 9 | 8 | 8 | 9 |
| Suok test | 18 | 13 | 16 | 13 |
| Forced swim test | 9 | 8 | 14 | 9 |
Dam Ethanol Self-Administration
Experimental dams, generation F0, self-administered an ethanol solution beginning at vaginal plug detection (GD 0.5) to the day of birth (GD 19.5). Briefly, experimental dams were provided ad libitum access to 25% ethanol in water solution and standard mouse chow, while control dams received ad libitum access to water and standard mouse chow. Nursing dams used for cross-fostering and dams that birthed the F2 and F3 generations were given free access to water and standard chow.
Dam and Pup Measures
Daily measures of liquid and food intake and weight gain were recorded for experimental and control dams to eliminate confounding nutritional variations.
Maternal blood ethanol content (BEC), resulting from self-administration of a 25% ethanol in water solution or water only, was determined enzymatically from experimental maternal blood samples at GD 9 and 19. Pregnant non-ethanol-treated dams were used as negative controls to ensure proper assay analyses. To verify proper hydration in all dams, we measured blood plasma osmolality from maternal blood samples at GD 19. See Supplementary Material 1 and El Shawa et al. (2013) for detailed methods for daily dam, BEC, and plasma osmolality measures.
On the day of birth, litter sizes were recorded and pups were weighed individually. Brains of newborns used in gene expression studies were immediately extracted after birth and weighed. The neocortex was removed and carefully separated into rostral and caudal sections using a tissue matrix. Cortical lengths were measured using a micrometer.
Anatomical Tracing and Cell Counts
INC development in P0 mice was visualized using 1,1-Dioctadecyl-3,3,3,3-tetramethylindocarbocyanine (DiI; Invitrogen) and 4-(4-(dihexadecylamino)styryl)-N-methylpyridinium iodide (DiA; Invitrogen) dye crystals placed in putative somatosensory (SCx) or putative visual cortex (VCx), as described previously (Huffman et al. 2004; El Shawa et al. 2013). To ensure consistent relative size of dye placement locations (DPLs), dye spread was measured and reported as percent of cortical length. Proper DPL position was confirmed by the presence of labeled cells in specific nuclei of the dorsal thalamus. Projection zones for each DPL were determined by measuring the extent of retrogradely labeled cells from the DPL as a percentage of cortical length. The 2D reconstructions of DPLs and retrogradely labeled cells were used to generate flattened lateral views of neocortex. Additionally, we created an odds ratio (OR) forest plot with confidence intervals of rostral/caudal labeling from putative VCx and SCx to show the variability among cases. Fluorescence microscopic images of control and experimental P0 brains labeled with lipophilic dyes (DiI and DiA) in the putative VCx and SCx were used for cell counts. Only stereotaxically identical coronal sections were compared. See Supplementary Material 1 for detailed methods for tissue processing and cell counting; see Huffman et al. (2004) and Dye et al. (2011a,b) for detailed methods for projection zone analyses and 2D reconstructions.
RT-qPCR and In Situ RNA Hybridization
Total RNA from rostral and caudal regions of neocortex was isolated using the AllPrep DNA/RNA Mini Kit (Qiagen, Valencia, CA). cDNA was reverse transcribed from total RNA, and quantitative reverse transcription PCR (RT-qPCR) was run in triplicate using the SensiMix one step kit (Bioline, Luckenwalde, Germany) according to the manufacturer’s instructions using primers directed against Id2, Rzrβ, Cad8, Lhx2, Eph A7, and Ephrin A5. Primers used to detect changes in DNMT expression were obtained from Qiagen (Catalog numbers: DNMT1, PPM03685E; DNMT3A, PPM04769G; DNMT3B, PPM03690A). Relative quantification of RT-qPCR data was performed according to Pfaffl (2001), with changes in target gene expression normalized to beta actin. Primer pair sequences are listed in Table 2.
Table 2.
Primer sequences. Table consisting of forward and reverse primer sequences used in RT-qPCR experiments
| Target | Forward primer | Reverse primer |
|---|---|---|
| β Actin | CCATCATGAAGTGTGACGTGG | GTCCGCCTAGAAGCATTTGCG |
| Cad8 | TGCACCTGAGTTCCTCAATGGAC | ATAATGGCTGTTTCAGGCTCAATG |
| Eph A7 | TTGGAAGAAGGCACTGTGGT | TAGGTTTTGGTGCCTGGAAA |
| Ephrin A5 | CTACATCTCCTCTGCAATCCCA | GGCTGACTCATGTACGGTGT |
| Id2 | ACATCAGCATCCTGTCCTTGCAG | AAGGTCCATTCAACGTGTTCTCC |
| Lhx2 | CTGCCGAGGGCTCACGAAG | AGAGAACCGCCTGTAGTAGTCT |
| RZRβ | GGGCTGGGAGCTTCATGACTAC | GAAGAATCCCTTGCAGCCTTCAC |
In situ hybridization (ISH) was used to visualize neocortical Id2 and Rzrβ gene expression in coronal hemi-sections from P0 control and experimental brains using standard protocols for free-floating ISH. Id2 and Rzrβ were quantified using RT-qPCR and designated as specific genes of interest for pattern visualization. See Supplementary Material 1 for detailed methods for ISH and tissue imaging. Expression patterns shown in ISH sections were used as a qualitative measure for positional neocortical expression as a compliment to quantitative expression data.
Gene Promoter Methylation
Total DNA from rostral and caudal regions of neocortex was isolated using the AllPrep DNA/RNA Mini Kit (Qiagen, Valencia, CA), and prepared for promoter methylation analyses with the Epitect Methyl II DNA Restriction Kit (Qiagen, Valencia, CA). For qPCR-based analyses of promoter methylation for Id2 and Rzrβ for each sample, the following Epitect qPCR Methyl Promoter Primers were used: Id2, catalog number EPMM102413-1A; Rzrβ, catalog number EPMM105704-1A. Percent promoter methylation for Id2 and Rzrβ promoters was calculated for each sample (Qiagen, Valencia, CA).
Global Methylation and Hydroxymethylation
5-methylcytosine (5-mC) and 5-hydroxymethylcytosine (5-hmC) levels were measured in DNA isolated from rostral and caudal cortex using Methylflash methylated and hydroxymethylated DNA kits (Epigentek, Brooklyn, NY, USA). The level of 5-mC and 5-hmC in tissue samples are reported as the amount of methylated and hydroxymethylated cytosine relative to the genomic content of cytosine. Briefly, 100 ng and 200 ng of DNA, for 5-mC and 5-hmC, respectively, were bound to well plates treated to have high affinity for DNA. Methylated and hydroxymethylated fractions of DNA were visualized using detection antibodies and absorbance measured at 450 nm on a Victor 2 plate reader. Absolute levels of 5-mC and 5-hmC were calculated using a standard curve.
Behavioral Analyses
By using multiple behavioral assays, we were able to assess sensorimotor integration, motor ability, and rodent forms of anxiety and depression in peri-pubescent (P30) PrEE (F1–F3) and control mice. The test battery includes the Suok Test, Accelerated Rotarod, and Forced Swim test. The Suok test is an effective assay for anxiety assessment and sensorimotor integration (Kalueff et al. 2008; El Shawa et al. 2013). Motor ability, learning, and coordination were tested using an Accelerated Rotarod (Ugo Basile; Hikosaka et al. 2002; Rustay et al. 2003) and the Forced Swim test was used to screen for depressive-like behavior (Lucki et al. 2001). See Supplementary Material 1 for detailed methods for behavioral assays.
Statistical Analysis
Results are presented as mean ± SEM. Comparisons were made using 1-way, or 2-way ANOVA, with Tukey’s multiple comparison test. Statistical significance was set at P < 0.05. Experimental data were compared to controls to identify the transgenerational effects of PrEE, although comparisons between individual generations (F1 vs. F2, F1 vs. F3, F2 vs. F3) are presented in detail in Supplementary Material 3.
Results
Dam Measures
Dam health and nutrition can have a profound effect on pup development. To rule out confounding effects of poor nutrition we measured dam food intake, gestational weight gain, litter size, dam plasma osmolality (as a measure of hydration), and dam BEC (Fig. 1). We report no significant differences in food intake between control and experimental animals (Fig. 1A; control, 6.928 ± 0.314 g/day; F1, 6.987 ± 0.532 g/day, MD = −0.059, P = 0.999; F2, 7.328 ± 0.401 g/day, MD = −0.400, P = 0.914; F3, 7.244 ± 0.434 g/day, MD = −0.317, P = 0.965). Gestational weight gain was significantly reduced in F1–F3 animals when compared to controls (Fig. 1B; control, 24.44 ± 1.381 g; F1, 19.70 ± 0.770 g, MD = 4.738, P < 0.05; F2, 19.03 ± 0.894 g, MD = 5.412, P < 0.05; F3, 18.93 ± 2.153 g, MD = 5.508, P < 0.05); this was accompanied by a concomitant reduction in litter size in all 3 experimental generations (Fig. 1C; control, 11.250 ± 0.470; F1, 9.043 ± 0.571, MD = 2.207, P < 0.05; F2, 8.750 ± 0.636, MD = 2.500, P < 0.05; F3, 8.250 ± 0.560, MD = 3.000, P < 0.05). Dam plasma osmolality was consistent across all animals measured, with no significant differences detected between groups (Fig. 1D; control, 308.2 ± 1.773 mosm/kg; F1, 309.2 ± −1.645 mosm/kg, MD = −1.0, P = 0.977; F2, 310.3 ± 2.161 mosm/kg, MD = −2.1, P = 0.871; F3, 309.5 ± 2.237 mosm/kg, MD = −1.3, P = 0.965). No significant variation was detected between experimental F1–F3 generations in the dam measures listed above (P values for multiple comparisons listed in Supplementary Material 3). Dam BEC measures, as expected, revealed blood ethanol only in F1 dams, with an average of 104.4 ± 1.206 mg EtOH/dl at GD9, increasing to 135.2 ± 4.126 mg EtOH/dl at GD19.
Figure 1.

Measurements in control, F1, F2, and F3 dams. (A) Average dam food intake (g/day). No significant differences. (B) Average gestational weight gain (g). F1, F2, and F3 dams gained significantly less weight than control dams over the gestational period (*P < 0.05). (C) Average litter size (#pups). F1, F2, and F3 dams delivered significantly smaller litters than control dams (*P < 0.05). (D) Average dam plasma osmolality on GD 18.5 (mosm/kg). No significant differences. (E) Average dam blood ethanol content (mg/dL) at GD 9 and 19. F1 dams with EtOH treatment showed significantly higher BEC levels compared to controls (****P < 0.0001). As control, F2, and F3 dams did not receive direct EtOH treatment, there were no significant differences in BEC. Data expressed as mean ± S.E.M.
Ethanol-induced, Transgenerational Changes to Brain and Body
The 1-way ANOVA was used to compare the effects of PrEE on pup body weight, brain weight, brain/body weight ratio, and cortical length across F1, F2, and F3 generations to determine transgenerational stability of gross alterations generated by prenatal ethanol exposure (Fig. 2). Pup body weight was significantly reduced across all generations of PrEE animals when compared to controls [F3,191 = 39.90, P < 0.0001]. Post hoc comparisons with Tukey’s revealed that mean control body weight was significantly different from PrEE animals and their descendants (Fig. 2A; control, 1.765 ± 0.024 g; F1, 1.516 ± 0.015 g, MD = 0.249, P < 0.0001; F2, 1.479 ± 0.023 g, MD = 0.286, P < 0.0001; F3, 1.652 ± 0.016 g, MD = 0.113, P < 0.01). Brain weight in experimental animals was also significantly reduced across all 3 generations when compared to controls [F3,68 = 12.42, P < 0.0001]. Post hoc comparisons revealed that the most significant deviations from control animals occurred in the F1 and F3 generations (Fig. 2B; control, 0.105 ± 0.003 g; F1, 0.088 ± 0.004 g, MD = 0.018, P < 0.0001; F2, 0.095 ± 0.003 g, MD = 0.010, P < 0.05; F3, 0.085 ± 0.004 g, MD = 0.021, P < 0.0001). Analysis of the ratio between these 2 measures revealed no significant differences between control and experimental animals (Fig. 2C; control, 0.060 ± 0.002; F1, 0.058 ± 0.001, MD = 0.002, P = 0.899; F2, 0.063 ± 0.001, MD = −0.002, P = 0.640; F3, 0.055 ± 0.001, MD = 0.004, P = 0.398). Additionally, reductions in cortical length were noted in all experimental groups [F3,46 = 9.024, P < 0.0001] with the most apparent changes observed in F1 animals (Fig. 2D; control, 4.189 ± 0.087 mm; F1, 3.781 ± 0.048 mm, MD = 0.408, P < 0.0001; F2, 3.971 ± 0.042 mm, MD = 0.218, P < 0.05; F3, 3.909 ± 0.046 mm, MD = 0.280, P < 0.05). A partial recovery of body weight was observed in F3 animals; these mice were significantly heavier than F1 (P < 0.001) and F2 animals (P < 0.0001). No significant variation was detected between experimental generations for any further pup measures reported above (Supplementary Material 3).
Figure 2.

Average body weight, brain weight, brain/body weight ratios, and cortical length in control, F1, F2, and F3 mice at P0. PrEE F1, F2, and F3 pups had significantly reduced birth weights (A), brain weights (B), cortical lengths (D), compared with controls. (C) No differences found between groups for brain/body weight ratio (*P < 0.05, **P < 0.01, ***P < 0.001, ****P < 0.0001). Data expressed as mean ± S.E.M.
Dye Labeling Experiments
Intraneocortical connections provide the network for sensorimotor integration in mammalian cortex. Our laboratory has previously described the disruption of this network in directly exposed F1 PrEE mice (El Shawa et al. 2013). Here, we examine the transgenerational impact of PrEE on sensory INC development.
Characterization of ipsilateral INCs in the F1–F3 P0 mouse neocortex revealed that the dramatic aberrant connectivity generated in response to PrEE in F1 persisted to the unexposed F3 generation (Fig. 3). Labeled cells from putative somatosensory cortex DPLs (Fig. 3, A2–D2, asterisks) were detected in atypical caudal positions within cortex of F1–F3 animals (Fig. 3, B4–D4, arrows), where no labeled cells were observed in control animals (Fig. 3, A4). Dye labeling resulting from putative visual cortex DPLs (Fig. 3, A5–D5, asterisks) revealed a broad region of aberrant connectivity in F1–F3 mice which projects to far rostral regions of cortex. Axonal projections from these labeled cell bodies extend from an area within the frontal, motor cortex (Fig. 3, B1–D1), and sensory-motor amalgam (Fig. 3, B2–B3, C2–C3, D2–D3) to visual cortex in an atypical pattern not present in the neocortex at any developmental stage in control mice (Dye et al. 2011a, 2011b).
Figure 3.

Development of putative somatosensory and visual INCs in control, F1, F2, and F3 brains at P0. Rostral to caudal series of 100 μm coronal sections of P0 hemispheres following dye placements of DiA (green) in putative somatosensory cortex (A2, B2, C2, D2, asterisks) or DiI (red) in putative visual cortex (A5, B5, C5, D5, asterisks). For all coronal sections, DAPI (blue) was used as a counterstain; arrows indicate ectopic retrogradely labeled cells. Ectopic, red DiI labeled cells from putative visual cortex DPLs are present in rostral cortical regions of F1 (B1–3), F2 (C1–3), and F3 (D1–3) brains, but are absent in controls (A1–3). Ectopic, green DiA labeled cells from putative somatosensory cortex DPLs are present in caudal regions in F1 (B4), F2 (C4), and F3 (D4) brains, but are absent in controls (A4). All raw images are oriented dorsal (D) up and lateral (L) to the right. Scale bar, 500 μm.
Reconstructed in a flattened lateral view (Fig. 4), the extent of these aberrant, ectopic projections becomes apparent. The distinct boundary between somatosensory cortex (green dots) and visual cortex (red dots) in control animals is absent in F1–F2 mice, which exhibit overlapping S-V projection zones (Fig. 4, compare A with B,C). This ill-defined border phenotype partially recovers in F3 animals, though ectopic frontal/motor cortex labeling persists (Fig. 4D). Analysis of DPL and projection zone across the cortical sheet confirmed that despite consistent DPL size (Fig. 5A,D), experimental animals had significantly expanded projection zones in somatosensory cortex of F1 and F2 animals, with near significant increases in F3 (Fig. 5B; control, 39.4 ± 2.57%; F1, 62.8 ± 13.0%, MD = −22.9, P < 0.001; F2, 56.3 ± 1.28%, MD = −16.9, P < 0.05; F3, 53.1 ± 3.44%, MD = −13.6, P = 0.07). Visual cortex projection zones were similarly expanded in all experimental generations when compared to controls, with the phenotype diminishing across generations (Fig. 5E; control, 45.6 ± 2.12%; F1, 79.1 ± 1.9%, MD = −33.5, P < 0.0001; F2, 60.5 ± 2.00%, MD = −15.0, P < 0.001; F3, 56.5 ± 3.39%, MD = −11.0, P < 0.05). Differences in experimental generations were only detected within visual cortex projection zones when comparing F1–F2 (P < 0.0001) and F1–F3 groups (P < 0.0001; see Supplementary Material 3)
Figure 4.
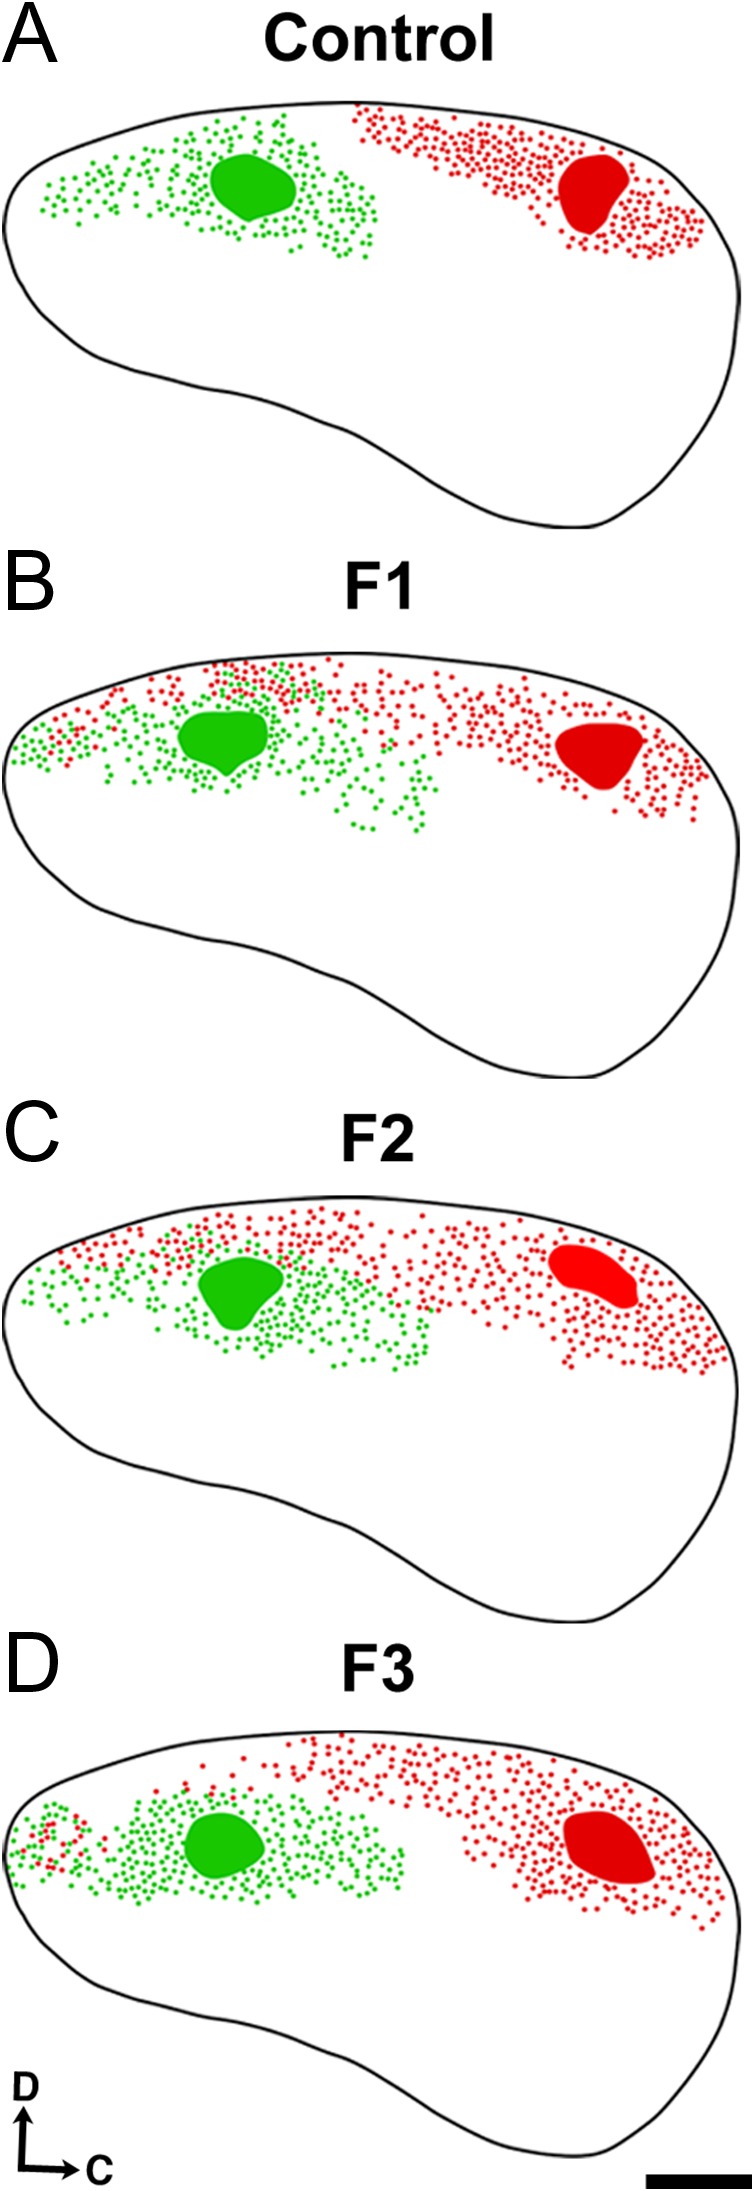
Flattened reconstructions of control, F1, F2, and F3 brains at P0. Lateral view reconstructions of flattened, single hemispheres of control (A), F1 (B), F2 (C), and F3 (D) brains following INC analyses at P0. Black line: cortical outline; green patches: DiA somatosensory DPLs; red patches: DiI visual DPLs; green/red dots: retrogradely labeled cell bodies. Reconstructions are oriented dorsal (D) up and caudal (C) to the right. Scale bar, 500 μm.
Figure 5.

Average cortical DPL spread and projection zones in control F1, F2, and F3 P0 brains. (A) Average spread of putative somatosensory cortex (SCx) DPLs. There were no significant differences in DPL spread across groups (B) Average projection zone of retrogradely labeled cells from putative SCx DPLs. Somatosensory cortex projection zones in F1 and F2 brains were significantly increased when compared to controls, while F3 showed a trend to significance (P = 0.07). (C) Average number of ectopic cells labeled from putative SCx DPLs. Ectopic, caudal cell labeling from putative SCx DPLs was significantly increased in F1, F2, and F3 generations when compared to controls. (D) Average spread of putative visual cortex DPL. There were no significant differences in DPL spread across groups (E) Average projection zone of retrogradely labeled cells from putative visual cortex (VCx) DPLs. Visual cortex projection zones in F1, F2, and F3 brains were significantly increased when compared to controls. (F) Average number of ectopic cells labeled from putative VCx DPLs. Ectopic, rostral cell labeling from putative VCx DPLs was significantly increased in F1, F2, and F3 generations when compared to controls. DPL spread and projection zones of labeled cells were taken as a percentage of entire cortical length; the number of ectopic cells labeled from respective DPLs was calculated from cell counts per case. (*P < 0.05, **P < 0.01, ***P < 0.001, ****P < 0.0001). Data expressed mean ± S.E.M.
The PrEE-induced INC phenotype can vary from moderate to severe, with some animals showing reduced or absent labeling in extremely rostral or caudal locations. The odds ratio of F1–F3 animals presenting ectopic rostral labeling (Supplementary Material 4; Rostral OR: F1, 44.2; F2, 41.28; F3, 37.4) was significant across all generations (P < 0.01), with a high percentage of cases observed expressing the phenotype (F1, 75.00%; F2, 72.73%; F3, 71.43%). The odds ratio of F1–F3 animals presenting ectopic caudal labeling weakened across generations (Caudal OR: F1, 44.2; F2, 28.33; F3, 17.0), maintaining significance only into the F2 generation, with F3 mice approaching significance (F1, P < 0.01; F2, P < 0.05; F3, P = 0.054). To control for observed internal phenotypic variability, cell counts were performed only in cases expressing the phenotype. Cell counts within rostral cortical areas revealed significant numbers of ectopically labeled cells arising from a visual cortex DPL, a phenotype that persisted into the F3 generation [F3,34 = 6.022, P < 0.001]. Post hoc analyses indicated significant variance in labeled cells in all 3 experimental groups, when compared to controls (Fig. 5F; control, 0.0 ± 0.0; F1, 55.5 ± 12.64, MD = −55.5, P < 0.01; F2, 43.0 ± 12.87, MD = −43.0, P < 0 0.05; F3, 51.6 ± 12.1, MD = −51.6, P < 0.01). Cell counts within these caudal regions of cortex revealed a similarly significant increase [F3,20 = 13.76, P < 0.0001] of labeled cells in F1, F2, and F3 generations when compared to controls (Fig. 5C; control, 0.0 ± 0.0; F1, 225.2 ± 20.79, MD = −225.2, P < 0.0001; F2, 199.8 ± 41.46, MD = −199.8, P < 0.001; F3, 192.2 ± 31.33, MD = −192.2, P < 0.001). No significant differences between experimental generations, for either rostral or caudal cell counts, were observed (Supplementary Material 3).
Gene Expression: RT-qPCR and ISH
The neocortex is patterned during the embryonic period when precise patterns of gene expression guide arealization of the neocortex generally, and direct the targeting of intraneocortical connections specifically (Huffman et al. 2004; Dye et al. 2011a, 2012). Previously, we demonstrated that PrEE impacts regional and gradient patterns of Rzrβ, Cad8, and Id2 gene expression in developing cortex (El Shawa et al. 2013). In order to quantify the effects of PrEE on gene expression across generations, we investigated Rzrβ, Cad8, and Id2 and 3 additional genes, Ephrin A5, Eph A7, and Lhx2, using RT-qPCR. These genes were chosen for their importance in neocortical patterning and arealization (Rubenstein et al. 1999; Zembrzycki et al. 2015). Genes that were differentially expressed across generations were further analyzed using ISH.
RT-qPCR: RNA expression levels of 6 genes; Ephrin A5, Id2, Rzrβ, Eph A7, Cad8, Lhx2 were quantified in rostral and caudal areas of newborn neocortex, for all groups (Fig. 6; primer sequences shown in Table 2). Compared to controls, Ephrin A5 was significantly downregulated [F(3, 32) = 32.01, P < 0.0001] in caudal cortices of F2 and F3 animals, though not in F1 animals (Fig. 6A). Significantly increased Id2 expression was detected in rostral cortex [F3,32 = 176.8, P < 0.0001], with F2 and F3 animals exhibiting 34.4 and 6.7-fold increases, respectively; a trend towards a significant difference was seen in F1 animals (Fig. 6B). All experimental conditions displayed significant upregulation of Id2 within caudal regions of cortex when compared to controls (fold increase: F1, 12.9; F2, 34.28; F3, 22.2; P < 0.0001). Rzrβ expression was significantly upregulated in rostral and caudal cortices [F3,31 = 79.96, P < 0.0001]. Post hoc analysis revealed significantly increased expression in F1, F2, and F3 rostral cortex (Fig. 6C; Fold increase: F1, 4.7; F2, 6.1; F3, 7.6; P < 0.001), while only F2 and F3 caudal cortex showed an increase in Rzrβ expression when compared to controls (Fig. 6C; Fold increase: F2, 5.4; F3 11.32; P < 0.0001). PrEE did not evoke significant alterations to Eph A7, Cad8, or Lhx2 expression in directly exposed animals, or their offspring when compared to controls (Fig. 6D–F). Analysis of variance between experimental generations revealed significant variation in a number of the genes investigated (Supplementary Material 3). Among genes that varied significantly from control expression, Ephrin A5 expression varied significantly between F2–F3 generations in rostral neocortex (P = 0.036), and F1–F2/F3 in caudal neocortex (F1–F2, P < 0.0001; F1–F3, P < 0.0001). Rostral Id2 expression varied significantly across all experimental generations (F1–F2, P < 0.0001; F1–F3, P < 0.0001; F2–F3, P < 0.0001), while caudal expression varied only between F1–F2 (P < 0.01).
Figure 6.

Log2 normalized relative expression of Ephrin A5, Id2, Rzrβ Eph A7, Cad8, and Lhx2 across 3 generations, using RT-qPCR. (A) Significant downregulation of Ephrin A5 expression was found in caudal cortex of F2 and F3 mice. (B) Strong upregulation of Id2 was detected in rostral cortex of F2 and F3 mice, as well as caudal cortex of F1, F2, and F3 mice. (C) Rzrβ was upregulated in rostral cortex of F1, F2, and F3 mice, as well as caudal cortex of F2 and F3 mice. (D–F) No significant variance was detected in Eph A7, Cad8 or Lhx2 expression. (***P < 0.001, ****P < 0.0001). Data expressed as mean ± S.E.M.
In situ RNA hybridization: Rzrβ gradients within medial frontal-parietal cortex of P0 control mice present a light expression pattern, which increase subtly as it expands laterally (Fig. 7, A1, left black arrow). In contrast, F1 animals exhibit notably increased medial Rzrβ expression, persisting to the F3 generation (Fig. 7, B1–D1, left black arrows). The medial boundary of high Rzrβ expression, typically marking the border of somatosensory/motor cortex, undergoes a dramatic medial expansion in F1 animals when compared to controls (Fig. 7, A1–B1, white arrows). This phenotype is present in F2–F3 generations, although weakened in F3 (Fig. 7, C1–D1, white arrows). Examination of the lateral boundary of high transcript density reveals an intermediate region of expression in control animals (Fig. 7, A1, right arrow) that is overexpressed in F1–F3 generations of experimental animals (Fig. 7, B1–D1, right black arrows).
Figure 7.

Neocortical expression of Rzrβ and Id2. 100 μm coronal sections following nonradioactive free floating in situ hybridization with probes against Rzrβ (A1–D1) and Id2 (A2–D2). (A1) Section through rostral region of parietal cortex in a control brain where left black arrow denotes low medial expression of Rzrβ, right black arrow denotes high lateral expression of Rzrβ, and the white middle arrow denotes the medial boundary of Rzrβ expression. In F1 (B1), F2 (C1), and F3 (D1) brains, the medial boundary of Rzrβ expression is shifted as represented by the white arrow. (A2) Section through rostral region of parietal cortex in a control brain where the white arrow denotes the boundary of layer 3/4 Id2 expression and the black arrow denotes layer 1/2 Id2 expression. In F1 brains (B2), the boundary of layer 3/4 Id2 expression is extended medially (white arrow) and the layer 1/2 Id2 expression is reduced and shifted medially compared to controls (black arrow). In F2 (C2) and F3 (D2) brains, the lateral Id2 expression in layers 3/4 is also extended medially (white arrows), accompanied by a partial recovery of expression in layers 1/2 in F2 animals which recovers by F3 (black arrows). Sections oriented dorsal (D) up and lateral (L) to the right. Scale bar, 500 μm.
Analysis of Id2 expression in control mice revealed an absence of medial layer 3/4 expression (Fig. 7, A2, white arrow) that is Id2-positive in F1–F3 animals (Fig. 7, B2–D2). Superficial to that, a large Id2-positive zone extends in a high-medial low-lateral gradient in layers 1/2 of control animals (Fig. 7, A2, black arrow), but is notably reduced in F1 mice (Fig. 7, B2, black arrow). In the F2 generation, the phenotype is weakened and F3 shows recovery (Fig. 7, C2–D2, black arrows).
PrEE Downregulates DNMT Expression
DNMTs are responsible for both de novo methylation (DNMT3A and 3B) and continued maintenance of methylation status (DNMT1) of DNA. We observed a significant reduction in cortical expression of DNMT1, 3A and 3B in F1 PrEE animals (Fig. 8A–C; F1: DNMT1, 0.48 ± 0.03, [F3,16 = 72.09, P < 0.0001]; DNMT3A, 0.46 ± 0.02, [F3,16 = 113.9, P < 0.0001]; DNMT3B, 0.49 ± 0.03, [F3,16 = 25.96, P < 0.0001]), with no significant change persisting transgenerationally (Fig. 8A–C; F2: DNMT1, 1.06 ± 0.05, P = 0.82; DNMT3A, 1.03 ± 0.04, P = 0.95; DNMT3B, 0.82 ± 0.09, P = 0.13; F3: DNMT1, 1.03 ± 0.05, P = 0.97; DNMT3A, 1.02 ± 0.06, P = 0.99; DNMT3B, 1.05 ± 0.05, P = 0.96). Variance between experimental generations was driven by the downregulated expression observed in F1 offspring, which was significantly different from the F2 (P < 0.0001) and F3 generations (P < 0.0001).
Figure 8.

Log2 normalized relative quantification of DNMT1, 3A, and 3B expression across 3 generations. (A–C) RT-qPCR revealed significant downregulation of DNMT1 (A), DNMT3A (B), and DNMT3B (C) in PrEE mice compared to controls. F2 and F3 mice descended from PrEE males showed no significant change from controls (****P < 0.0001).
DNA Methylation
To determine if PrEE in the F1 generation was sufficient for the genesis of transgenerationally stable modifications to 2 epigenetic marks, we quantified global 5 mC and 5 hmC, and promoter-specific 5 mC levels in neocortex (Fig. 9). A colorimetric ELISA-like assay, used to quantify 5 mC (%) levels in rostral and caudal neocortex of P0 animals, revealed a significant reduction of DNA methylation in experimental animals [F3,32 = 14.69, P < 0.0001] (Fig. 9A). Post hoc analyses showed that significant hypomethylation in rostral cortex generated in response to PrEE in F1 animals persisted to F2 and unexposed F3 animals (Fig. 9A; control, 0.76 ± 0.01 %; F1, 0.57 ± 0.05 %, MD = 0.19, P < 0.05; F2, 0.50 ± 0.04 %, MD = 0.27, P < 0.01; F3, 0.49 ± 0.07 %, MD = 0.27, P < 0.01). Measures in caudal cortex revealed a similar pattern of significant hypomethylation across generations of experimental animals (Fig. 9A; control, 0.73 ± 0.02 %; F1, 0.52 ± 0.05 %, MD = 0.22, P < 0.05; F2, 0.54 ± 0.04 %, MD = 0.20, P < 0.05; F3, 0.42 ± 0.07 %, MD = 0.31, P < 0.001). No significant differences were detected among experimental generations (Supplementary Material 3).
Figure 9.

Global DNA methylation and hydroxymethylation in rostral and caudal cortical tissue. (A) Global 5 mC levels were significantly reduced in rostral and caudal cortex in PrEE F1, F2, and F3 mice. (B) Global 5 hmC levels were significantly increased in rostral F1 cortex. (C) Ratio of 5 hmC to 5 mC, is significantly increased in PrEE F1–F3 rostral cortex when compared to controls. In caudal cortex, F1 and F3 animals show a significant increase in 5 hmC/5 mC ratio. (*P < 0.05, **P < 0.01, ***P < 0.001).
Global hydroxymethylation (5 hmC %) quantification was performed to determine possible involvement in PrEE-related developmental dysfunction (Fig. 9B). Interestingly, global hydroxymethylation analysis showed that F1 PrEE mice had significantly higher levels of DNA methylation compared to control animals in both rostral and caudal areas of cortex [F3,32 = 9.710, P < 0.0001], with post hoc analyses revealing increases in F1 generation, but not in F2 or F3 (Fig. 9B; rostral cortex: control, 0.073 ± 0.009 %; F1, 0.141 ± 0.01 %, MD = −0.07, P < 0.01; F2, 0.105 ± 0.008 %, MD = −0.03, P = 0.23; F3, 0.104 ± 0.007 %, MD = −0.03, P < 0.001; caudal cortex: control, 0.093 ± 0.012 %; F1, 0.149 ± 0.007 %, MD = −0.06, P < 0.01; F2, 0.119 ± 0.013 %, MD = −0.03, P = 0.43; F3, 0.118 ± 0.019 %, MD = −0.03, P = 0.43). Significant intergenerational differences were not observed (Supplementary Material 3).
As expected, the ratio between hydroxymethylated and methylated DNA in both regions of cortex was disrupted in PrEE mice and their descendants (with a noted maintenance of control-like ratios in F2 caudal cortex, Fig. 9C). A disproportionate change in the percentage of methylated DNA appears to be driving most of the observed variation (Fig. 9C; rostral cortex: F1, P < 0.01; F2, P < 0.05; F3, P < 0.05; caudal cortex: F1, P < 0.05; F2, P = 0.37; F3, P < 0.01). Significant variation between experimental groups was observed between F2–F3 generations in caudal cortex (P < 0.05) (Supplementary Material 3).
Analyses of Promoter Region Methylation
RT-qPCR analysis of a panel of genes needed for proper cortical development revealed significant upregulation of Id2 and Rzrβ transcription in PrEE mice and their offspring. As promoter methylation status is thought to modulate transcription, we analyzed promoter region-specific methylation of these 2 genes. Quantification of methylation at the Id2 promoter region in samples from rostral and caudal neocortical regions revealed significant reductions in experimental animals, when compared to controls [F3,32 = 34.32, P < 0.0001], an effect that persisted into unexposed F3 animals (Fig. 10A; rostral cortex: control, 0.150 ± 0.016 %; F1, 0.060 ± 0.014 %, MD = 0.09, P < 0.001; F2, 0.026 ± 0.005 %, MD = 0.14, P < 0.0001; F3, 0.030 ± 0.007 %, MD = 0.12, P < 0.0001; caudal cortex: control, 0.157 ± 0.026 %; F1, 0.028 ± 0.006 %, MD = 0.13, P < 0.0001; F2, 0.031 ± 0.006 %, MD = 0.13, P < 0.0001; F3, 0.029 ± 0.008 %, MD = 0.13, P < 0.0001). Methylation of Rzrβ promoter region followed a similar pattern of hypomethylation, with significant reductions across all experimental generations in both rostral and caudal regions of cortex (Fig. 10B; rostral cortex: control, 0.086 ± 0.013 %; F1, 0.023 ± 0.05 %, MD = 0.06, P < 0.01; F2, 0.029 ± 0.010 %, MD = 0.06, P < 0.01; F3, 0.022 ± 0.007 %, MD = 0.06, P < 0.01; caudal cortex: control, 0.130 ± 0.018 %; F1, 0.055 ± 0.016 %, MD = 0.08, P < 0.001; F2, 0.030 ± 0.007 %, MD = 0.10, P < 0.0001; F3, 0.030 ± 0.011 %, MD = 0.10, P < 0.0001). No significant variation was detected between experimental groups for Id2 or Rzrβ promoter region methylation (Supplementary Material 3).
Figure 10.

Methylation of CpG sites in the promoter region of Id2 and Rzrβ. (A) CpG island methylation in the Id2 promoter region of both rostral and caudal cortical tissue from PrEE F1–F3 animals was significantly reduced. (B) CpG island methylation in the Rzrβ promoter region of both rostral and caudal cortical tissue from PrEE F1–F3 animals was significantly reduced (**P < 0.01, ***P < 0.001, ****P < 0.0001).
Behavioral Analyses
Sensorimotor integration, coordination, motor learning/ability, anxiety-like and depressive-like behaviors were measured in P30 control, F1, F2, and F3 PrEE mice to determine if PrEE was sufficient for the production of transgenerationally stable behavioral alterations. Two-way repeated measures ANOVA revealed significant variation in performance on the Accelerated Rotarod across trials [F3,90 = 21.43, P < 0.0001], with post hoc analysis showing that the predominant source of variation was in F1 and F2 animals during trials 1 and 2 (Fig. 11A; P < 0.05 and P < 0.01, respectively). Significant variation was also detected between F2–F3 generations during the first trial (P < 0.05; Supplementary Material 3).
Figure 11.

Behavioral measures in control, PrEE F1, F2, and F3 mice at P30. Accelerated Rotarod testing (A), revealed significant reductions in F1 performance in trials 1 and 2. Symbols: triangle = control, circle = F1, square = F2, inverted triangle = F3. Measures of anxiety on the Suok apparatus include (B) Latency to leave center and (C) Stereotyped rearing/grooming. Both suggest increased anxiety in response to PrEE. Missteps (D) and falls (E) reveal decreased motor coordination and sensorimotor integration across PrEE generations. Depressive-like behavior, measured in the forced swim test (F), was significantly increased in F1–F3 animals (*P < 0.05, **P < 0.01, ***P < 0.001, ****P < 0.0001). Data expressed as mean ± S.E.M.
Anxiety-like behavior, indicated by an increased latency to leave center during testing on the Suok apparatus (Fig. 11B), was significantly increased [F3,57 = 7.30, P < 0.001] in the F1 and F2 generations, but did not persist to F3 (control, 0.95 ± 0.11 s; F1, 6.57 ± 0.73 s, P < 0.01; F2, 6.39 ± 1.48 s, P < 0.001; F3, 3.88 ± 0.58 s, P = 0.16). This behavior is believed to indicate increased anxiety because mice avoid moving and engaging in exploratory behaviors when anxious. Stereotyped cephalo-caudal grooming behavior, thought to be indicative of low anxiety (Fig. 11C), showed a significant decrease in all experimental animals when compared to controls [F3,57 = 4.817, P < 0.01], suggesting increased anxiety (control, 1.57 ± 0.27; F1, 0.62 ± 0.21, P < 0.05; F2, 0.63 ± 0.15, P < 0.01; F3, 0.71 ± 0.19, P < 0.05). Two measures of sensorimotor integration, missteps, and falls were evaluated during the Suok test (Fig. 11D,E). One-way ANOVA of missteps showed significant differences between groups [F3,57 = 5.72, P < 0.01], with all experimental animals performing worse than controls (control, 2.29 ± 0.32; F1, 5.54 ± 0.53, P < 0.01; F2, 4.88 ± 0.66, P < 0.05; F3, 4.69 ± 0.75, P < 0.05). Falls, considered to reflect a more severe loss of sensorimotor integration, were increased [F3,57 = 5.653, P < 0.01] relative to controls in all experimental conditions (control, 0.50 ± 0.14; F1, 2.85 ± 0.61, P < 0.01; F2, 2.00 ± 0.30, P < 0.05; F3, 2.14 ± 0.48, P < 0.05). No significant differences were detected among experimental generations for measures on the Suok (Supplementary Material 3).
Analysis of depressive-like behavior, recorded as time spent immobile in the forced swim test (Fig. 11F), revealed significant variation [F3,37 = 9.777, P < 0.0001] between control and experimental animals. Tukey’s multiple comparisons test confirmed that depressive-like behaviors were increased in all generations of PrEE mice (control, 156.7 ± 4.7 s; F1, 207.4 ± 3.2 s, P < 0.001; F2, 180.7 ± 4.5 s, P < 0.05; F3, 202.0 ± 9.6 s, P < 0.001; Supplementary Material 3).
Pearson product-moment correlations between sensorimotor, anxiety, and depressive marks are presented in Table 3. Significant correlations were observed between grooming and latency to leave center (P < 0.01), grooming and falls (P < 0.01), grooming and missteps (P < 0.01), falls and missteps (P < 0.01), falls and FST (P < 0.01), falls and Rotarod performance (P < 0.01), and missteps and Rotarod performance (P = 0.05).
Table 3.
Behavioral correlates. Pearson product-moment correlation coefficients of weight and 6 behavioral measures: latency to leave center and grooming (anxiety measures); falls and missteps (measures of motor function/sensorimotor integration); time spent immobile in the Forced Swim Test (measure of depressive-like behavior); and Rotarod (a measure of balance and motor learning) (*P < 0.05, **P < 0.01)
| Weight | LC | Groom | Falls | Missteps | FST | |
|---|---|---|---|---|---|---|
| Weight | ||||||
| LC | −0.071 | |||||
| Groom | 0.124 | −0.382** | ||||
| Falls | 0.070 | 0.113 | −0.426** | |||
| Missteps | −0.027 | 0.114 | −0.351** | 0.401** | ||
| FST | 0.103 | 0.233 | −0.299 | 0.428** | 0.226 | |
| Rotarod | −0.074 | −0.294 | 0.205 | −0.503** | −0.360* | −0.280 |
Discussion
In this study, we demonstrate that prenatal ethanol exposure induces transgenerationally persistent alterations in offspring including decreased body weight, brain weight and cortical length, abnormal development of cortical connectivity, differential RNA expression, decreased DNMT expression, global hypomethylation, and promoter-specific hypomethylation of Id2 and Rzrβ. Behavioral testing across 3 generations indicated that PrEE generates stable, transgenerational increases in anxiety-like and depressive-like behaviors, as well as reduced sensorimotor integration and motor coordination. The finding that maternal consumption of ethanol during pregnancy can generate a wide array of transgenerationally stable neocortical and behavioral dysfunctions, persisting via the male germline to unexposed offspring, is both novel and compelling. Data generated with this transgenerational PrEE model of FASD, support and extend our earlier work in a direct exposure FASD mouse model.
Gross Anatomical Changes and INC Development
Paternal transmission of the effects of ethanol has been reported previously (Abel 2004), with experimental animals showing low birth weight when compared to controls. Our PrEE model demonstrates transgenerationally stable reduced newborn body weight, brain weight, and reduced cortical length suggesting that ethanol can perturb physical and neocortical development. As our model generates a reduction in maternal weight gain without a reduction in nutritional intake, we believe that the reduction in gain is caused by reduced pup weight and litter size. Persistence of these alterations into unexposed F3 animals presents a new and interesting transgenerational consequence of PrEE. These findings, coupled with PrEE-induced methylation changes, support the hypothesis that epigenetic mechanisms are involved in transgenerational weight maintenance (Waterland et al. 2008).
Abnormal INC development in PrEE mice is characterized by 2 transgenerationally stable ectopic projections: a group of primarily layer 3/4 pyramidal cells that send projections from frontal/prelimbic cortex toward putative V1, and a second group of primarily layer 3/4 pyramidal cells spanning retrosplenial cortex and V1 that project to putative S1. Although the enlarged projection zone phenotype decreases from F1–F3, we still detected ectopically labeled cells in 50–70% of F3 cases. These transgenerational changes replicate our previous findings in the F1 generation (El Shawa et al. 2013) and are reminiscent of global functional connectivity alterations in children with FASD, which is thought to relate to observed reductions in cognitive function (Wozniak et al. 2013). Ectopically labeled cells in frontal cortex are regionally correlated with altered levels and distribution of glucocorticoid receptors (Allan et al. 2014), and reduced cortical thinning (Treit et al. 2014). As this population of cells is sending aberrant projections to V1, it is possible that this input contributes to visual acuity deficits, compounding recently reported dysfunctional visual cortex response patterns (Lantz et al. 2014, 2015). Ectopic cells labeled from somatosensory dye placements were found in the parietal lobe where reduced dendritic spine densities in pyramidal neurons were observed in PrEE animals (Oladehin et al. 2007; Xie et al. 2010; De Giorgio and Granato 2015). This is also consistent with parietal dysfunction described in human FASD (Woods et al. 2015). Although it is likely that widespread dysregulation of non-cortical brain regions contributes significantly to the phenotype, our findings suggest that the disrupted neocortical network plays a major role in the FASD phenotype.
Gene Expression
Id2 and Rzrβ expression is altered transgenerationally after PrEE. Id2, a potent transcription factor required for normal development (Park et al. 2013), and Rzrβ, which impacts aspects of neocortical cytoarchitectural patterning critical for somatotopic mapping during development (Jabaudon et al. 2012), are both strongly upregulated in neocortex. Although this investigation was limited to neocortex, it is likely that both gene expression patterns and transcript levels are altered in subcortical structures. As these genes play roles in intraneocortical connection development, axon targeting and cortical patterning (Huffman et al. 2004), it is possible that these altered expression levels underlie the ectopic labeling observed in the neocortex of PrEE mice.
We observed a significant reduction of DNMT1, 3A, and 3B mRNA expression in PrEE cortex when compared to controls. Inappropriate downregulation of DNMT3A and DNMT3B could generate de novo methylation errors at normally methylated CpG sites, which would then be erroneously copied by DNMT1, resulting in inappropriate maintenance following cell division. By multiplying this across multiple rounds of cell division, it is possible that progressive global hypomethylation could be generated. Furthermore, the initial disruption of methyltransferase expression via PrEE may play a role in the transgenerationally stable hypomethylation observed in PrEE mice.
DNA Methylation
Global methylation is reduced, transgenerationally, in rostral and caudal cortical regions in response to PrEE. Methylation of the C-5 carbon of cytosine is thought to be incompatible with active transcription when occurring near regulatory regions of genes, either by directly modulating transcription factor binding or recruiting co-repressor complexes via 5 mC-binding proteins (Klose and Bird 2006; Smith and Meissner 2013). Additionally, 5 hmC, an oxidized product of 5 mC, is also thought to modulate transcription and is particularly important during neuronal development (Szulwach et al. 2011; Mellen et al. 2012; Bachman et al. 2014). The ratio between 5 mC and 5 hmC is perturbed via PrEE across generations and alterations to this ratio are thought to be involved in the balance between lineage commitment and pluripotency (Ficz et al. 2011).
Quantification of DNA methylation levels revealed that PrEE induces consistent hypomethylation of CpG-rich sites adjacent to the transcription start site of Id2 and Rzrβ across generations. Sites queried for methylation status in Id2 and Rzrβ are both located close to the CCAAT box, which is required for transcriptional activation. CpG methylation upstream of the CCAAT box can effectively impede transcription factor binding to the CCAAT sequence (Deng et al. 2001). PrEE can initiate transgenerational suppression of Pomc gene expression, associated with hypermethylation (Govorko et al. 2012) and it has been suggested that increased gene expression is associated with low promoter methylation (Kass et al. 1997; Capel et al. 2007). As this phenotype is transmitted via the paternal lineage, it is likely that germline reprogramming, at least in part, could carry the alterations transgenerationally. Rodent models investigating paternally-mediated conveyance have identified epigenetic signatures in mature sperm that may carry transgenerational programming, including altered populations of small noncoding RNAs, DNA methylation and retention of histone modifications (Lambrot et al. 2013; Vassoler et al. 2013; Dias and Ressler 2014; Gapp et al. 2014; Guerrero-Bosagna et al. 2014; Radford et al. 2014; Milekic et al. 2015). One possible mechanism by which this could occur is via the differential expression of specific microRNAs (miRs) in PrEE male sperm, as altered expression of miRs can recapitulate paternal stress-generated phenotypes transgenerationally in mice (Rodgers et al. 2015).
Transgenerational Behavioral Dysfunction
Children with FASD display motor deficits, depression, anxiety and other ethanol-related phenotypes (Hellemans et al. 2010a, 2010b). In our mouse model of FASD, sensorimotor dysfunction, increased anxiety and depressive-like behaviors are not only present in PrEE mice, but are also transmitted transgenerationally to unexposed offspring. Our multi-level analyses suggest that prenatal ethanol exposure begins a cascade of nervous system changes that ultimately is read-out in animal behavior. Gaining a deeper understanding of this cascade and the behaviors that follow will lead to future therapies and methods for prevention.
Conclusions
We provide evidence for widespread PrEE-induced neocortical dysfunction that is transmitted transgenerationally, via the paternal germline, to ethanol-naïve offspring. Although the mechanisms of transmission have not yet been discovered, we suggest that PrEE-induced alterations to DNA methylation, alongside other modifications to the epigenome, could be responsible for stable transgenerational alterations to gene expression in the brain, leading to abnormal patterning of intraneocortical circuitry, and ultimately disrupted behavior. Demonstrating the “heritability” of FASD, which was believed to be strictly exposure-dependent, is both groundbreaking and remarkable. As we learn more about how environmental toxins may alter epigenetic function, we will be able to expand our knowledge of syndrome and spectrum etiology.
Supplementary Material
Notes
The authors wish to thank Olga Kozanian for her assistance with this project. Conflict of Interest: None declared.
Supplementary Material
Funding
NIAAA to KJH (1R03AA021545-02).
References
- Abbott CW, Kozanian OO, Kanaan J, Wendel KM, Huffman KJ. 2016. The impact of prenatal ethanol exposure on neuroanatomical and behavioral development in mice. Alcohol Clin Exp Res. 40(1):122–133. [DOI] [PMC free article] [PubMed] [Google Scholar]
- Abel E. 2004. Paternal contribution to fetal alcohol syndrome. Addict Biol. 9:127–133. [DOI] [PubMed] [Google Scholar]
- Allan AM, Goggin SL, Caldwell KK. 2014. Prenatal alcohol exposure modifies glucocorticoid receptor subcellular distribution in the medial prefrontal cortex and impairs frontal cortex-dependent learning. PLoS One. 9(4):e96200. [DOI] [PMC free article] [PubMed] [Google Scholar]
- Bachman M, Uribe-Lewis S, Yang X, Williams M, Murrell A, Balasubramanian S. 2014. 5-Hydroxymethylcytosine is a predominantly stable DNA modification. Nat Chem. 6(12):1049–1055. [DOI] [PMC free article] [PubMed] [Google Scholar]
- Bekdash RA, Zhang C, Sarkar DK. 2013. Gestational choline supplementation normalized fetal alcohol-induced alterations in histone modifications, DNA methylation, and proopiomelanocortin (POMC) gene expression in β-endorphin-producing POMC neurons of the hypothalamus. Alcohol Clin Exp Res. 37(7):1133–1142. [DOI] [PMC free article] [PubMed] [Google Scholar]
- Capel E, Fléjou JF, Hamelin R. 2007. Assessment of MLH1 promoter methylation in relation to gene expression requires specific analysis. Oncogene. 26:7596–7600. [DOI] [PubMed] [Google Scholar]
- Cullen CL, Burne TH, Lavidis NA, Moritz KM. 2013. Low dose prenatal ethanol exposure induces anxiety-like behaviour and alters dendritic morphology in the basolateral amygdala of rat offspring. PLoS One. 8(1):e54924. [DOI] [PMC free article] [PubMed] [Google Scholar]
- De Giorgio A, Granato A. 2015. Reduced density of dendritic spines in pyramidal neurons of rats exposed to alcohol during early postnatal life. Int J Dev Neurosci. 41:74–79. [DOI] [PubMed] [Google Scholar]
- Deng G, Chen A, Pong E, Kim YS. 2001. Methylation in hMLH1 promoter interferes with its binding to transcription factor CBF and inhibits gene expression. Oncogene. 20:7120–7127. [DOI] [PubMed] [Google Scholar]
- Dias BG, Ressler KJ. 2014. Parental olfactory experience influences behavior and neural structure in subsequent generations. Nat Neurosci. 17(1):89–96. [DOI] [PMC free article] [PubMed] [Google Scholar]
- Dye CA, El Shawa H, Huffman KJ. 2011. a. A lifespan analysis of intraneocortical connections and gene expression in the Mouse I. Cereb Cortex. 21:1311–1330. [DOI] [PMC free article] [PubMed] [Google Scholar]
- Dye CA, El Shawa H, Huffman KJ. 2011. b. A lifespan analysis of intraneocortical connections and gene expression in the Mouse I. Cereb Cortex. 21:1331–1350. [DOI] [PMC free article] [PubMed] [Google Scholar]
- Dye CA, Abbott CW, Huffman KJ. 2012. Bilateral enucleation alters gene expression and intraneocortical connections in the mouse. Neural Dev. 7:5. [DOI] [PMC free article] [PubMed] [Google Scholar]
- El Shawa H, Abbott CW, Huffman KJ. 2013. Prenatal ethanol exposure disrupts intraneocortical circuitry, cortical gene expression, and behavior in a mouse model of FASD. J Neurosci. 33(48):18893–18905. [DOI] [PMC free article] [PubMed] [Google Scholar]
- Ficz G, Branco MR, Seisenberger S, Santos F, Krueger F, Hore TA, Marques CJ, Andrews S, Reik W. 2011. Dynamic regulation of 5-hydroxymethylcytosine in mouse ES cells and during differentiation. Nature. 473:398–402. [DOI] [PubMed] [Google Scholar]
- Finegersh A, Rompala GR, Martin DI, Homanics GE. 2015. Drinking beyond a lifetime: new and emerging insights into paternal alcohol exposure on subsequent generations. Alcohol. 49(5):461–470. [DOI] [PMC free article] [PubMed] [Google Scholar]
- Gapp K, Jawaid A, Sarkies P, Bohacek J, Pelczar P, Prados J, Farinelli L, Miska E, Mansuy IM. 2014. Implication of sperm RNAs in transgenerational inheritance of the effects of early trauma in mice. Nat Neurosci. 17(5):667–669. [DOI] [PMC free article] [PubMed] [Google Scholar]
- Govorko D, Bekdash RA, Zhang C, Sarkar DK. 2012. Male germline transmits fetal alcohol adverse effect on hypothalamic proopiomelanocortin gene across generations. Biol Psychiatry. 72:378–388. [DOI] [PMC free article] [PubMed] [Google Scholar]
- Guerrero-Bosagna C, Weeks S, Skinner MK. 2014. Identification of genomic features in environmentally induced epigenetic transgenerational inherited sperm epimutations. PLoS One. 9(6):e100194. [DOI] [PMC free article] [PubMed] [Google Scholar]
- Hellemans KG, Sliwowska JH, Verma P, Weinberg J. 2010. a. Prenatal alcohol exposure: fetal programming and later life vulnerability to stress, depression and anxiety disorders. Neurosci Biobehav Rev. 34:791–807. [DOI] [PMC free article] [PubMed] [Google Scholar]
- Hellemans KG, Verma P, Yoon E, Yu WK, Young AH, Weinberg J. 2010. b. Prenatal alcohol exposure and chronic mild stress differentially alter depressive- and anxiety-like behaviors in male and female offspring. Alcohol Clin Exp Res. 34:633–645. [DOI] [PMC free article] [PubMed] [Google Scholar]
- Hikosaka O, Nakamura K, Sakai K, Nakahara H. 2002. Central mechanisms of motor skill learning. Curr Opin Neurobiol. 12:217–222. [DOI] [PubMed] [Google Scholar]
- Hoyme HE, May PA, Kalberg WO, Kodituwakku P, Gossage JP, Trujillo PM, Buckley DG, Miller JH, Aragon AS, Khaole N, et al. 2005. A practical clinical approach to diagnosis of fetal alcohol spectrum disorders: clarification of the 1996 institute of medicine criteria. Pediatrics. 115:39–47. [DOI] [PMC free article] [PubMed] [Google Scholar]
- Huffman KJ, Garel S, Rubenstein JLR. 2004. Fgf8 regulates the development of intra-neocortical projections. J Neurosci. 24:8917–8923. [DOI] [PMC free article] [PubMed] [Google Scholar]
- Jabaudon D, Shnider S, Tischfield D, Galazo M, Macklis JD. 2012. RORB overexpression induces barrel-like neuronal clusters in the developing neocortex. Cereb Cortex. 22:996–1006. [DOI] [PMC free article] [PubMed] [Google Scholar]
- Kalueff AV, Keisala T, Minasyan A, Kumar SR, LaPorte JL, Murphy DL, Tuohimaa P. 2008. The regular and light-dark Suok tests of anxiety and sensorimotor integration: utility for behavioral characterization in laboratory rodents. Nat Protoc. 3:129–136. [DOI] [PubMed] [Google Scholar]
- Kass SU, Landsberger N, Wolffe AP. 1997. DNA methylation directs a time-dependent repression of transcription initiation. Curr Biol. 7:157–165. [DOI] [PubMed] [Google Scholar]
- Klose RJ, Bird AP. 2006. Genomic DNA methylation: the mark and its mediators. Trends Biochem Sci. 31(2):89–97. [DOI] [PubMed] [Google Scholar]
- Kvigne VL, Leonardson GR, Borzelleca J, Welty TK. 2008. Characteristics of grandmothers who have grandchildren with fetal alcohol syndrome or incomplete fetal alcohol syndrome. Matern Child Health J. 12:760–765. [DOI] [PubMed] [Google Scholar]
- Lambrot R, Xu C, Saint-Phar S, Chountalos G, Cohen T, Paquet M, Suderman M, Hallett M, Kimmins S. 2013. Low paternal dietary folate alters the mouse sperm epige-nome and is associated with negative pregnancy outcomes. Nat Commun. 4:2889. [DOI] [PMC free article] [PubMed] [Google Scholar]
- Lantz CL, Pulimood NS, Rodrigues-Junior WS, Chen CK, Manhaes AC, Kalatsky VA, Medina AE. 2014. Visual defects in a mouse model of fetal alcohol spectrum disorder. Front Pediatr. 2:107. [DOI] [PMC free article] [PubMed] [Google Scholar]
- Lantz CL, Sipe GO, Wong EL, Majewska AK, Medina AE. 2015. Effects of developmental alcohol exposure on potentiation and depression of visual cortex responses. Alcohol Clin Exp Res. 39(8):1434–1442. [DOI] [PMC free article] [PubMed] [Google Scholar]
- Lucki I, Dalvi A, Mayorga AJ. 2001. Sensitivity to the effects of pharmacologically selective antidepressants in different strains of mice. Psychopharmacology (Berl). 155(3):315–322. [DOI] [PubMed] [Google Scholar]
- Marjonen H, Sierra A, Nyman A, Rogojin V, Gröhn O, Linden AM, Hautaniemi S, Kaminen-Ahola N. 2015. Early maternal alcohol consumption alters hippocampal DNA methylation, gene expression and volume in a mouse model. PLoS One. 10(5):e0124931. [DOI] [PMC free article] [PubMed] [Google Scholar]
- May PA, Baete A, Russo J, Elliott AJ, Blankenship J, Kalberg WO, Buckley D, Brooks M, Hasken J, Abdul-Rahman O, et al. 2014. Prevalence and characteristics of fetal alcohol spectrum disorders. Pediatrics. 134(5):855–866. [DOI] [PMC free article] [PubMed] [Google Scholar]
- Mead EA, Sarkar DK. 2014. Fetal alcohol spectrum disorders and their transmission through genetic and epigenetic mechanisms. Front Genet. 5:154. [DOI] [PMC free article] [PubMed] [Google Scholar]
- Mellen M, Ayata P, Dewell S, Kriaucionis S, Heintz N. 2012. MeCP2 binds to 5hmC enriched within active genes and accessible chromatin in the nervous system. Cell. 151(7):1417–1430. [DOI] [PMC free article] [PubMed] [Google Scholar]
- Milekic MH, Xin Y, O’Donnell A, Kumar KK, Bradley-Moore M, Malaspina D, Moore H, Brunner D, Ge Y, Edwards J, et al. 2015. Age-related sperm DNA methylation changes are transmitted to offspring and associated with abnormal behavior and dysregulated gene expression. Mol Psychiatry. 20(8):995–1001. [DOI] [PubMed] [Google Scholar]
- Oladehin A, Margret CP, Maier SE, Li CX, Jan TA, Chappell TD, Waters RS. 2007. Early postnatal alcohol exposure reduced the size of vibrissal barrel field in rat somatosensory cortex (SI) but did not disrupt barrel field organization. Alcohol. 41:253–261. [DOI] [PMC free article] [PubMed] [Google Scholar]
- Olino TM, Pettit JW, Klein DN, Allen NB, Seeley JR, Lewinsohn PM. 2008. Influence of parental and grandparental major depressive disorder on behavior problems in early childhood: a three-generation study. J Am Acad Child Adolesc Psychiatry. 47:53–60. [DOI] [PMC free article] [PubMed] [Google Scholar]
- Park HJ, Hong M, Bronson RT, Israel MA, Frankel WN, Yun K. 2013. Elevated Id2 expression results in precocious neural stem cell depletion and abnormal brain development. Stem Cells. 31(5):1010–1021. [DOI] [PMC free article] [PubMed] [Google Scholar]
- Pfaffl MW. 2001. A new mathematical model for relative quantification in real- time RT-PCR. Nucleic Acids Res. 29:2002e2007. [DOI] [PMC free article] [PubMed] [Google Scholar]
- Renthal W, Nestler EJ. 2009. Chromatin regulation in drug addiction and depression. Dialogues Clin Neurosci. 11:257–268. [DOI] [PMC free article] [PubMed] [Google Scholar]
- Radford EJ, Ito M, Shi H, Corish JA, Yamazawa K, Isganaitis E, Seisenberger S, Hore TA, Reik W, Erkek S, et al. 2014. In utero effects. In utero undernourishment perturbs the adult sperm methylome and intergenerational metabolism. Science. 345(6198):1255903. [DOI] [PMC free article] [PubMed] [Google Scholar]
- Rodgers AB, Morgan CP, Leu NA, Bale TL. 2015. Transgenerational epigenetic programming via sperm microRNA recapitulates effects of paternal stress. Proc Natl Acad Sci USA. 112(44):13699–13704. [DOI] [PMC free article] [PubMed] [Google Scholar]
- Rubenstein JL, Anderson S, Shi L, Miyashita-Lin E, Bulfone A, Hevner R. 1999. Genetic control of cortical regionalization and connectivity. Cereb Cortex. 9(6):524–532. [DOI] [PubMed] [Google Scholar]
- Rustay NR, Wahlsten D, Crabbe JC. 2003. Influence of task parameters on rotarod performance and sensitivity to ethanol in mice. Behav Brain Res. 141:237–249. [DOI] [PubMed] [Google Scholar]
- Smith ZD, Meissner A. 2013. DNA methylation: roles in mammalian development. Nat Rev Genet. 14(3):204–220. [DOI] [PubMed] [Google Scholar]
- Szulwach KE, Li X, Li Y, Song CX, Wu H, Dai Q, Irier H, Upadhyay AK, Gearing M, Levey AI, et al. 2011. 5-hmC-mediated epigenetic dynamics during postnatal neurodevelopment and aging. Nat Neurosci. 14(12):1607–1616. [DOI] [PMC free article] [PubMed] [Google Scholar]
- Tan CH, Denny CH, Cheal NE, Sniezek JE, Kanny D. 2015. Alcohol use and binge drinking among women of childbearing age—United States, 2011–13. Morb Mortal Wkly Rep. 64:1042–1046. [DOI] [PubMed] [Google Scholar]
- Tong M, Ziplow J, Chen WC, Nguyen QG, Kim C, de la Monte SM. 2013. Motor function deficits following chronic prenatal ethanol exposure are linked to impairments in insulin/IGF, notch and Wnt signaling in the cerebellum. J Diabetes Metab. 4(1):238. [PMC free article] [PubMed] [Google Scholar]
- Treit S, Zhou D, Lebel C, Rasmussen C, Andrew G, Beaulieu C. 2014. Longitudinal MRI reveals impaired cortical thinning in children and adolescents prenatally exposed to alcohol. Hum Brain Mapp. 35(9):4892–4903. [DOI] [PMC free article] [PubMed] [Google Scholar]
- Vassoler FM, White SL, Schmidt HD, Sadri-Vakili G, Pierce RC. 2013. Epigenetic in-heritance of a cocaine-resistance phenotype. Nat Neurosci. 16(1):42–47. [DOI] [PMC free article] [PubMed] [Google Scholar]
- Waterland RA, Travisano M, Tahiliani KG, Rached MT, Mirza S. 2008. Methyl donor supplementation prevents transgenerational amplification of obesity. Int J Obes. 32(9):1373–1379. [DOI] [PMC free article] [PubMed] [Google Scholar]
- Woods KJ, Meintjes EM, Molteno CD, Jacobson SW, Jacobson JL. 2015. Parietal dysfunction during number processing in children with fetal alcohol spectrum disorders. Neuroimage Clin. 8:594–605. [DOI] [PMC free article] [PubMed] [Google Scholar]
- Wozniak JR, Mueller BA, Bell CJ, Muetzel RL, Hoecker HL, Boys CJ, Lim KO. 2013. Global functional connectivity abnormalities in children with fetal alcohol spectrum disorders. Alcohol Clin Exp Res. 37(5):748–756. [DOI] [PMC free article] [PubMed] [Google Scholar]
- Xie N, Yang Q, Chappell TD, Li CX, Waters RS. 2010. Prenatal alcohol exposure reduces the size of the forelimb representation in motor cortex in rat: an intracortical microstimulation (ICMS) mapping study. Alcohol. 44(2):185–194. [DOI] [PubMed] [Google Scholar]
- Zembrzycki A, Perez-Garcia CG, Wang CF, Chou SJ, O’Leary DD. 2015. Postmitotic regulation of sensory area patterning in the mammalian neocortex by Lhx2. Proc Natl Acad Sci U S A. 112(21):6736–6741. [DOI] [PMC free article] [PubMed] [Google Scholar]
Associated Data
This section collects any data citations, data availability statements, or supplementary materials included in this article.