Abstract
Luteolin partially exerts its biologic effects via its metabolites catalyzed by UDP-glucuronosyltransferases (UGTs) and catechol-O-methyltransferases (COMTs). However, the interplay of UGTs and COMTs in mediating luteolin disposition has not been well clarified. In this study, we investigated the glucuronidation and methylation pathways of luteolin mediated by the interplay of UGTs and COMTs in vivo and in vitro. A total of nine luteolin metabolites was detected in rat plasma and bile by liquid chromatography–tandem mass spectrometry, namely, three glucuronides, two methylated metabolites, and four methylated glucuronides. Luteolin-3′-glucuronide (Lut-3′-G) exhibited the highest systemic exposure among these metabolites. Kinetics studies in rat liver S9 fractions suggested two pathways, as follows: 1) Luteolin was glucuronidated to luteolin-7-glucuronide, luteolin-4′-glucuronide, and Lut-3′-G by UGTs, and then Lut-7-G was methylated to chrysoeriol-7-glucuronide and diosmetin-7-glucuronide by COMTs. 2) Alternatively, luteolin was methylated to chrysoeriol and diosmetin by COMTs, and then chrysoeriol and diosmetin were glucuronidated by UGTs to their respective glucuronides. The methylation rate of luteolin was significantly increased by the absence of glucuronidation, whereas the glucuronidation rate was increased by the absence of methylation, but to a lesser extent. In conclusion, two pathways mediated by the interplay of UGTs and COMTs are probably involved in the metabolic disposition of luteolin. The glucuronidation and methylation of luteolin compensate for each other, although glucuronidation is the predominant pathway.
Introduction
Luteolin (3′,4′,5,7-tetrahydroxyflavone) is one of the most common catechol-type flavonoids present in edible plants and medical herbs, such as carrot, pepper, olive oil, celery, peppermint, and perilla leaf (López-Lázaro, 2009). Preclinical studies have revealed that luteolin possesses a wide range of pharmacological effects, including anti-angiogenic (Park et al., 2012), antioxidative (López-Lázaro, 2009), anti-inflammatory, and neuroprotective (Dirscherl et al., 2010) activities. Moreover, the antioxidative property of luteolin is claimed to be responsible for its protective effect against cancers (Seelinger et al., 2008).
Glucuronidation mediated by UDP-glucuronosyltransferases (UGTs) and methylation mediated by catechol-O-methyltransferases (COMTs) are two important metabolic pathways of luteolin in animals and humans (Boersma et al., 2002; Lemańska et al., 2004). Luteolin-7-glucuronide (Lut-7-G), a glucuronidated metabolite of luteolin, shows potential anti-inflammatory activity in lipopolysaccharide-treated RAW 264.7 cells (Kure et al., 2016). Two methylated metabolites, chrysoeriol and diosmetin, also exert cardioprotective (Liu et al., 2009), antioxidant (Mishra et al., 2003), and antimicrobial (Chan et al., 2013) activities. Thus, the comprehensive investigation of metabolic disposition that is mediated by UGTs and COMTs is vital in understanding the mechanism of pharmacological activities of luteolin.
The luteolin monoglucuronide is the major form of luteolin in human serum and rat plasma (Shimoi et al., 1998). Luteolin-3′-glucuronide (Lut-3′-G), luteolin-4′-glucuronide (Lut-4′-G), and Lut-7-G have been identified in rat plasma, liver, kidney, and small intestine (Kure et al., 2016). Lut-3′-G was the major metabolite, whereas methylated metabolites were undetected. Additionally, Lut-7-G, Lut-4′-G, and Lut-3′-G were found in microsomal samples with different formation ratios, as proved by an in vitro study (Boersma et al., 2002). However, the formation ratios of these glucuronides in this study were based on the peak area measured by high performance liquid chromatography, which did not represent their actual metabolic rates. In our previous studies, UGT1A9 catalyzed glucuronidation of luteolin to generate Lut-7-G, Lut-3′-G, Lut-4′-G, and luteolin-3′,4′-diglucuronide (diG) in human liver microsomes and HeLa-UGT1A9 cells. The formation rate of Lut-7-G was the highest, followed by Lut-3′-G (Tang et al., 2014). In addition, two novel diGs, namely, luteolin-3′,7-diG and luteolin-4′,7-diG, were identified in human UGTs; a novel luteolin-5-glucuronide was found in mice intestinal perfusate (Wu et al., 2015). Despite these thorough investigations of luteolin glucuronidation, the role of methylation in luteolin disposition was always neglected.
Based on the structure of catechol, luteolin is a substrate of COMTs; only one of the catechol hydroxyl groups (3′-hydroxyl or 4′-hydroxyl) can be methylated (Chen et al., 2013). It has been demonstrated that luteolin, luteolin monoglucuronides, and methylated luteolin glucuronides (chrysoeriol or diosmetin glucuronides) were present in rat plasma after dosing. However, the chromatographic separation and structural identification of these isomeric methylated glucuronides are challenging (Shimoi et al., 2000). Recently, the two methylated metabolites, chrysoeriol and diosmetin, were simultaneously identified and isolated in rat urine hydrolyzed with hydrochloric acid after i.v. administration of luteolin (Chen et al., 2011). In fact, the two methylated metabolites (chrysoeriol and diosmetin) mainly occurred as conjugate forms in vivo; the determination of chrysoeriol and diosmetin in biologic samples that were hydrolyzed before analysis will not reflect their real exposure and disposition. To date, the systematic exposure and metabolic pathways of luteolin that are catalyzed by the interplay of UGTs and COMTs in vivo remain unclear. The relationship between glucuronidation and methylation in luteolin disposition is also unknown.
Therefore, the current study aimed to characterize the metabolic disposition of luteolin mediated by the interplay of UGTs and COMTs. The isomeric glucuronidated and methylated metabolites in rat plasma and bile after oral administration of luteolin were determined by liquid chromatography–tandem mass spectrometry (LC-MS/MS). In vitro studies were performed using rat liver S9 fractions (RLS9) to predict the metabolic pathways and relationship between glucuronidation and methylation in luteolin disposition.
Materials and Methods
Chemicals and Reagents.
Luteolin and diosmetin were purchased from Chengdu Must Bio-technology (Chengdu, China). Chrysoeriol was supplied by Extrasynthese (Genay, France). Lut-7-G and Lut-3′-G were obtained from Shifeng Biotechnology (Shanghai, China). Diosmetin-7-glucuronide (Dio-7-G) was purchased from Toronto Research Chemicals (Toronto, Canada). Lut-4′-G, chrysoeriol-7-glucuronide (Chr-7-G), chrysoeriol-4′-glucuronide (Chr-4′-G), and diosmetin-3′-glucuronide (Dio-3′-G) were enzymatically synthesized and indentified in our laboratory previously (Tang et al., 2009; Li et al., 2015). Tilianin, used as internal standard (IS), was provided by the Department of Pharmacy, First Affiliated Hospital to Shihezi University. The purity of each compound exceeded 98%. Saccharolactone, alamethicin, MgCl2, uridine diphosphate glucuronic acid (UDPGA), S-adenosine-L-methionine iodized salt (SAM), and EGTA were purchased from Sigma-Aldrich (St. Louis, MO). RLS9 were prepared following the protocol as described in publication (Chen et al., 2003; Zhu et al., 2010). All other reagents were analytical grade or better.
Animals.
Male Sprague–Dawley rats weighing 250–300 g were obtained from the Laboratory Animal Center of the Guangzhou University of Chinese Medicine. The animal protocols were approved by the Institutional Animal Care and Uses Committee of Guangzhou University of Chinese Medicine. The rats were kept in an environmentally controlled room (temperature, 25 ± 2°C; humidity, 50 ± 5%; 12-hour dark–light cycle) and fed with the AIN 93M diet from Trophic Animal Feed High-Tech (Nantong, Jiangsu, China) for at least 1 week before the experiments. The rats were fasted for 12 hours with free access to water prior to the study.
Ultra–High Performance Liquid Chromatography and LC-MS/MS Analysis.
Ultra–high performance liquid chromatography (UHPLC) analysis was performed using an Agilent 1290 UHPLC system equipped with a G4212A diode array detector (Agilent Technologies, Santa Clara, CA). Separation was achieved by a Cosmosil cholester-packed column (2.5 μm, 2.0 × 100 mm; Cosmosil, Kyoto, Japan) with mobile phase A of 0.1% formic acid and mobile phase B of 100% acetonitrile. The flow rate was set at 0.3 mL/min. The following gradient solvent system was used: 0–1 minute, 20–20% B; 1–12 minutes, 20–30% B; 12–21 minutes, 30–30% B; 21–21.5 minutes, 30–90% B; 21.5–22 minutes, 90–90% B; and 22–22.5 minutes, 90–20% B. Analytes were monitored at 254 and 330 nm.
LC-MS/MS analysis was operated with the same UHPLC system coupled to an Agilent 6460 Triple Quadrupole mass system with an electrospray ionization source in the positive mode. The main working parameters for the mass spectrometry detection were capillary voltage, 3.5 kV; nozzle voltage, 1.5 kV; sheath gas temperature, 350°C; and desolvation temperature, 300°C. Acquisition was performed in multiple reaction monitoring mode at the m/z transitions of 463→287 for Lut-7-G, Lut-4′-G, and Lut-3′-G; 477→301 for Chr-7-G, Dio-7-G, Chr-4′-G, and Dio-3′-G; 287→153 for luteolin; 301→286 for chrysoeriol and diosmetin; and 447→285 for tilianin (IS).
In Vivo Metabolism of Luteolin in Rats.
Rats were randomly assigned to four groups (four rats per group). The first three groups were used for blood collection from abdominal aorta at 20, 60, and 360 minutes after oral administration of luteolin (5 mg/kg), respectively. All blood samples were immediately centrifuged at 5510g for 8 minutes to obtain plasma samples. Rats in the fourth group were anesthetized by ether, and their bile duct was cannulated using a polyethylene tube (BD Biosciences, Woburn, MA; i.d., 0.28 mm; o.d., 0.61 mm). After recovery from anesthesia, luteolin was orally administrated to rats (5 mg/kg), and bile samples were collected for 24 hours. All plasma and bile samples were stored at −80°C until further analysis.
Plasma and bile samples (10 μL) were mixed with cold methanol (80 μL), and the mixture was vortexed for 3 minutes. After centrifugation at 19,357g for 10 minutes, 70 μL supernatant was evaporated until dry in a vacuum drying oven. The residue was redissolved in 60 μL 50% methanol aqueous solution and centrifuged at 19,357g for 30 minutes before the LC-MS/MS analysis.
Glucuronidation Kinetics of Luteolin, Chrysoeriol, and Diosmetin in RLS9.
The hepatic glucuronidations of luteolin, chrysoeriol, and diosmetin were estimated with RLS9 adapted from a previous study (Liu et al., 2010). The incubation mixtures contained 50 mM potassium phosphate buffer (pH 7.4), RLS9 (final concentration at 0.01 mg/mL for luteolin and diosmetin; 0.005 mg/mL for chrysoeriol), MgCl2 (0.88 mM), saccharolactone (4.4 mM), alamethicin (0.022 mg/mL), and different concentrations of substrate (0.3125–80 μM for luteolin and diosmetin; 0.0781–20 μM for chrysoeriol). The reaction was started by adding 3.5 mM UDPGA, followed by incubation at 37°C for 30 minutes. Finally, the mixture was terminated by adding of the IS solution (2.5 μM tilianin in acetonitrile) and centrifuged at 19,357g for 30 minutes before the UHPLC assay. All samples were performed in triplicate.
Methylation Kinetics of Luteolin and Lut-7-G in RLS9.
The hepatic methylation of luteolin and Lut-7-G in this study was evaluated, as described in literature with minor modification (Bonifácio et al., 2009). Briefly, the reaction mixture contained RLS9 (final concentration at 0.25 mg/mL), EGTA (0.88 mM), and different concentrations of substrate (0.125–80 μM for luteolin; 1.25–60 μM for Lut-7-G) in 50 mM phosphate buffer (pH 7.4). SAM (0.5 mM) was later added to the reaction mixture. Samples were performed in triplicate and incubated at 37°C. The incubation times were 20 and 30 minutes for luteolin and Lut-7-G, respectively. Reactions were terminated by adding the IS solution (2.5 μM tilianin in acetonitrile) and centrifuged at 19,357g for 30 minutes before the UHPLC analysis.
Glucuronidation Kinetics and Methylation Kinetics of Luteolin in Combined UGT–COMT Coreactions.
The combined UGT–COMT coreaction mixture contained RLS9 (final concentration at 0.25 mg/mL), MgCl2 (0.44 mM), saccharolactone (2.2 mM), alamethicin (0.011 mg/mL), EGTA (0.44 mM), and different concentrations of luteolin (0.125–600 μM) in 50 mM phosphate buffer (pH 7.4). SAM (0.25 mM) and UDPGA (1.75 mM) were subsequently added to the reaction. Samples were performed in triplicate and incubated at 37°C for 30 minutes. Reactions were terminated by adding the IS solution (200 nM tilianin in acetonitrile), and then centrifuged at 19,357g for 30 minutes before the LC-MS/MS analysis.
Interplay of UGTs and COMTs in Disposition of Luteolin in Combined UGT–COMT Coreactions.
The interplay of UGTs and COMTs in luteolin disposition was observed in the absence of UDPGA (1.75 mM) or SAM (0.25 mM) in combined UGT–COMT coreactions. Three different concentrations (1, 5, and 10 μM) of luteolin were incubated in coreaction mixture for 30 minutes. Control incubations contained all vehicles and corresponding substrate (both UDPGA and SAM were added). All samples were performed in triplicate and analyzed by LC-MS/MS.
Data Analysis.
Kinetic parameters were obtained based on the profile of Eadie–Hofstee plots and fitted with the Michaelis–Menten equation or other previously described equations (Zhu et al., 2015). If Eadie–Hofstee plot was linear, formation rates (V) of metabolites at various respective substrate concentrations (C) were fit to the Michaelis–Menten equation:
 |
(1) |
where Km is the Michaelis–Menten constant and Vmax is the maximum rate of formation of the metabolites.
When Eadie–Hofstee plots showed substrate inhibition kinetics, the reaction rate (V) was fit to eq. 2:
 |
(2) |
where C is the substrate concentration, V is the initial reaction rate, Vmax is the maximum enzyme velocity, Km is the substrate concentration required to achieve 50% of Vmax, and Ki is the substrate inhibition constant.
If Eadie–Hofstee plots revealed characteristic profiles of autoactivation and biphasic kinetics, the data were fit to eq. 3 and eq. 4, respectively.
 |
(3) |
where Vmax-0 and Vmax-d is the intrinsic enzyme activity and the maximal induction of enzyme activity, respectively. R is the rate of enzyme activity induction, C is concentration of substrate, and Km is concentration of substrate needed to achieve 50% of (Vmax-0 + Vmax-d).
 |
(4) |
where Vmax1 and Vmax2 is the maximum enzyme velocity of the high-affinity phase and the low-affinity phase, respectively. Km1 is concentration of substrate to achieve half of Vmax1 for high-affinity phase, and Km2 is concentration of substrate to achieve half of Vmax2 for low-affinity phase.
Statistical Analysis.
One-way analysis of variance with or without Tukey–Kramer multiple comparison (post hoc) tests was used by the software SPSS 19.0 to evaluate statistical differences. Differences were considered significant when P < 0.05.
Results
Metabolic Profiles of Luteolin in Rat Plasma and Bile Samples.
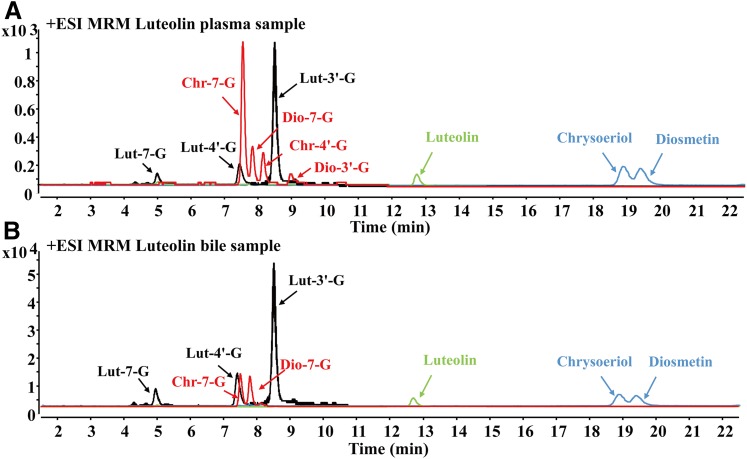
The metabolites in plasma and bile samples would provide useful information for investigating the metabolic disposition of luteolin in vivo. In this study, luteolin, three glucuronides (Lut-7-G, Lut-4′-G, and Lut-3′-G), two methylated metabolites (chrysoeriol and diosmetin), and four methylated glucuronides (Chr-7-G, Dio-7-G, Chr-4′-G, and Dio-3′-G) of luteolin were detected in plasma samples after oral administration of luteolin (5 mg/kg) to rats. For bile samples, luteolin, Lut-7-G, Lut-4′-G, Lut-3′-G, chrysoeriol, diosmetin, Chr-7-G, and Dio-7-G were detected. Thus, glucuronides and methylated glucuronides catalyzed by UGTs and COMTs appeared to be the predominant metabolites of luteolin in vivo.
The multiple reaction monitoring chromatograms of luteolin and its metabolites in rat plasma and bile samples after oral administration of luteolin, as analyzed by LC-MS/MS, are shown in Fig. 1. The established LC-MS/MS method exhibited a run time of 22.5 minutes; isomeric compounds were well separated under the chromatographic condition and identified by their retention times with those purchased and synthesized standards. The retention times of isomeric glucuronides followed the order: Lut-7-G (5.0 minutes) < Lut-4′-G (7.4 minutes) < Lut-3′-G (8.6 minutes). The retention times of isomeric methylated glucuronides followed the order: Chr-7-G (7.4 minutes) < Dio-7-G (7.8 minutes) < Chr-4′-G (8.1 minutes) < Dio-3′-G (9.1 minutes). For methylated metabolites, the retention times of chrysoeriol and diosmetin were 18.8 and 19.3 minutes, respectively.
Fig. 1.
Typical multiple reaction monitoring chromatograms of luteolin and its metabolites (Lut-7-G, Lut-4′-G, Lut-3′-G, Chr-7-G, Dio-7-G, Chr-4′-G, Dio-3′-G, chrysoeriol, and diosmetin) catalyzed by UGTs and COMTs in plasma (A) and bile samples (B) after oral administration of luteolin (5 mg/kg) to rats. Green peak: the chromatogram of luteolin. Black peak: the chromatogram of luteolin glucuronides (Lut-7-G, Lut-4′-G, and Lut-3′-G). Red peak: the chromatograms of luteolin-methylated glucuronides (Chr-7-G, Dio-7-G, Chr-4′-G, and Dio-3′-G). Blue peak: the chromatograms of luteolin-methylated metabolites (chrysoeriol and diosmetin).
Quantitative Assesment of the Metabolites of Luteolin Catalyzed by UGTs and COMTs in Rat Plasma and Bile Samples.
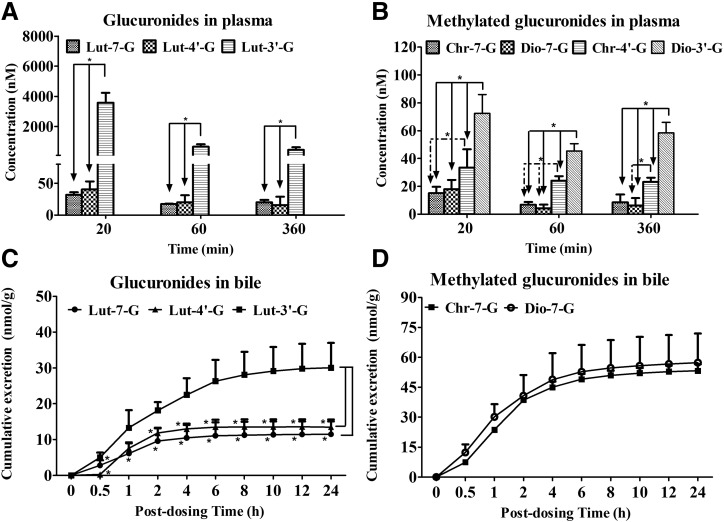
The amounts of luteolin, chrysoeriol, and diosmetin in both plasma and bile samples were too low for quantification, only their conjugates were quantified by LC-MS/MS. The plasma concentrations of these metabolites at 20, 60, and 360 minutes, as well as their cumulative excretions in bile samples within 24 hours after oral administration of luteolin in rats, are shown in Fig. 2. The results showed that the amounts of Lut-3′-G were 88-, 32-, and 28-fold higher than that of Lut-4′-G, and 112-, 38-, and 22-fold higher than Lut-7-G in rat plasma at 20, 60, and 360 minutes (Fig. 2A; P < 0.05). Consistent with the results observed in plasma, the cumulative biliary excretion of Lut-3′-G was also significantly higher than those of Lut-4′-G (2.2-fold) and Lut-7-G (2.6-fold) (Fig. 2C; P < 0.05).
Fig. 2.
Concentrations of luteolin glucuronides (Lut-7-G, Lut-4′-G, and Lut-3′-G) and luteolin-methylated glucuronides (Chr-7-G, Dio-7-G, Chr-4′-G, and Dio-3′-G) in plasma at 20, 60, and 360 minutes, as well as their cumulative excretion in bile samples within 24 hours after the oral administration of luteolin (5 mg/kg) to rats. (A and B) Plasma concentrations of glucuronides and methylated glucuronides at 20, 60, and 360 minutes after gavage. The symbol “*” shows the significant differences of plasma concentration among the different glucuronides or methylated glucuronides (P < 0.05). (C and D) Cumulative excretion of glucuronides and methylated glucuronides in bile samples within 24 hours. Significant differences of cumulative excretion were found among the different glucuronides (*P < 0.05 versus Lut-3′-G). Only two methylated glucuronides (Chr-7-G and Dio-7-G) were detected in rat bile, and no significant differences were found between Chr-7-G and Dio-7-G (P > 0.05). Each point or column represents the mean of four determinations. The error bar represents the S.D. of the mean (n = 4, mean ± S.D.).
Among the methylated glucuronides of luteolin, Dio-3′-G and Chr-4′-G, especially Dio-3′-G, exhibited a markedly higher exposure than Chr-7-G and Dio-7-G in plasma samples (Fig. 2B; P < 0.05). For diosmetin glucuronides, the plasma concentrations of Dio-3′-G were 4.0-, 10.8-, and 9.4-fold higher than that of Dio-7-G at 20, 60, and 360 minutes. For chrysoeriol glucuronides, Chr-4′-G showed 2.2-, 3.5-, and 2.7-fold higher plasma exposure than that of Chr-7-G at 20, 60, and 360 minutes, respectively. However, unlike the findings in plasma, Dio-3′-G and Chr-4′-G were absent in rat bile samples; only Dio-7-G and Chr-7-G were detected and showed a similar cumulative excretion (53 nmol/g for Chr-7-G; 57 nmol/g for Dio-7-G) in rat bile for 24 hours (Fig. 2D).
Glucuronidation of Luteolin, Chrysoeriol, and Diosmetin in RLS9.
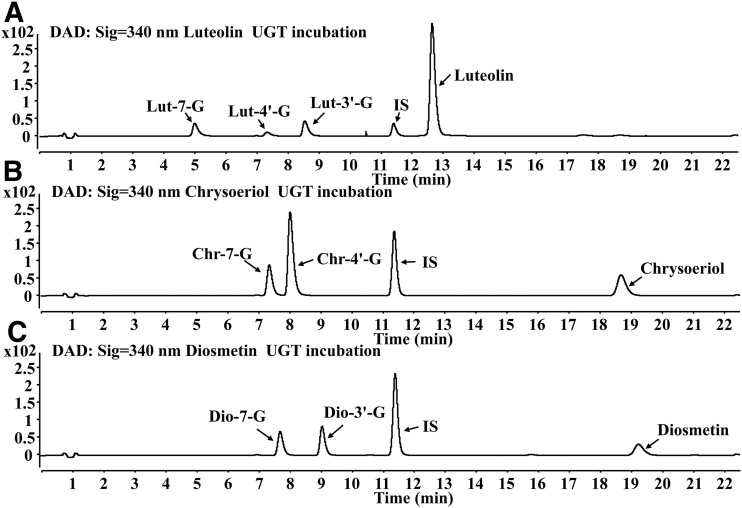
To investigate the glucuronidation pathways of luteolin, chrysoeriol, and diosmetin by UGTs in rat liver, the glucuronidation kinetics of luteolin, chrysoeriol, and diosmetin were evaluated in the UDPGA-supplemented RLS9. The UHPLC chromatograms of luteolin, chrysoeriol, diosmetin, and their respective glucuronides following RLS9 incubation are shown in Fig. 3. Three metabolites of luteolin, namely Lut-7-G, Lut-4′-G, and Lut-3′-G, were generated in RLS9 (Fig. 3A). Two metabolites were detected in RLS9 both for chrysoeriol and diosmetin. Chrysoeriol was converted to Chr-7-G and Chr-4′-G (Fig. 3B), and diosmetin was converted to Dio-7-G and Dio-3′-G (Fig. 3C).
Fig. 3.
UHPLC chromatograms of luteolin (A), chrysoeriol (B), diosmetin (C), and their respective glucuronides after incubation with UDPGA-supplemented RLS9.
Figure 4 shows the glucuronidation kinetic curves of luteolin, chrysoeriol, and diosmetin. For luteolin glucuronidation, the formations of Lut-7-G and Lut-4′-G were fitted using the substrate inhibition model, as evidenced by the Eadie–Hofstee plot (Fig. 4, Aa and Ac), whereas Lut-3′-G formation followed the Michaelis–Menten equation (Fig. 4Ab). For chrysoeriol glucuronidation, the formations of Chr-7-G and Chr-4′-G were fitted using the Michaelis–Menten equation (Fig. 4, Bd and Be). For diosmetin glucuronidation, Dio-7-G and Dio-3′-G formation followed the autoactivation and the substrate inhibition model, respectively (Fig. 4, Cf and Cg).
Fig. 4.
Kinetics of luteolin (A), chrysoeriol (B), and diosmetin (C) glucuronidation by RLS9 at different concentrations (0.3125–80 μM for luteolin and diosmetin; 0.0781–20 μM for chrysoeriol). Each inset shows the Eadie–Hofstee plot. For luteolin glucuronidation, the formations of Lut-7-G (Aa) and Lut-4′-G (Ac) were fitted using the substrate inhibition model; Lut-3′-G (Bb) formation followed the Michaelis–Menten equation. For chrysoeriol glucuronidation, the formations of Chr-7-G (Bd) and Chr-4′-G (Be) were fitted using the Michaelis–Menten equation. For diosmetin glucuronidation, Dio-7-G (Cf) and Dio-3′-G (Cg) formation followed the autoactivation and the substrate inhibition model, respectively. The RLS9 concentrations were 0.005–0.01 mg/mL, and the incubation time was 30 minutes. All incubations were performed in triplicate. Each point represents the mean of three determinations. The error bar represents the S.D. of the mean (n = 3, mean ± S.D.).
Table 1 displays the apparent kinetic parameters of luteolin, chrysoeriol, and diosmetin glucuronidation by RLS9. The intrinsic clearances (CLint, Vmax/Km) of Lut-7-G, Lut-4′-G, and Lut-3′-G were 1.0 ± 0.3, 0.4 ± 0.1, and 0.7 ± 0.1 mL/min/mg, respectively. The Ki values of Lut-7-G and Lut-4′-G were 226 ± 100 and 221 ± 98 μM. For chrysoeriol glucuronidation, the CLint values of Chr-7-G and Chr-4′-G were 1.1 ± 0.1 and 8.2 ± 2.5 mL/min/mg. For diosmetin glucuronidation, the CLint values of Dio-7-G and Dio-3′-G were 0.6 ± 0.1 and 2.5 ± 0.2 mL/min/mg, respectively. The Ki value of Dio-3′-G was 425 ± 246 μM.
TABLE 1.
Apparent kinetic parameters of luteolin, chrysoeriol, and diosmetin glucuronidation obtained from RLS9
Calculations were based on curve fitting using the Michaelis–Menten equation, substrate inhibition, or autoactivation model, as described in Materials and Methods. Data are expressed as the mean ± S.D., n = 3.
| Metabolites | Km (μmol/L) | Vmax (nmol/mg/min) | CLint (mL/min/mg) | Ki (μmol/L) | |
|---|---|---|---|---|---|
| Luteolin | Lut-7-Ga | 5.5 ± 1.1 | 5.3 ± 0.5 | 1.0 ± 0.3 | 226 ± 100 |
| Lut-4′-Ga | 2.2 ± 0.5 | 0.9 ± 0.1 | 0.4 ± 0.1 | 221 ± 98 | |
| Lut-3′-Gb | 8.6 ± 1.2 | 6.0 ± 0.3 | 0.7 ± 0.1 | ||
| Chrysoeriol | Chr-7-Gb | 3.5 ± 0.3 | 3.9 ± 0.1 | 1.1 ± 0.1 | |
| Chr-4′-Gb | 0.3 ± 0.1 | 2.3 ± 0.1 | 8.2 ± 2.5 | ||
| Diosmetin | Dio-7-Gc | 6.2 ± 1.6 | 3.8 ± 0.5 | 0.6 ± 0.1 | |
| Dio-3′-Ga | 2.5 ± 0.4 | 6.1 ± 0.4 | 2.5 ± 0.2 | 425 ± 246 |
Substrate inhibition equation.
Michaelis–Menten equation.
Autoactivation equation.
Methylation of Luteolin and Lut-7-G in RLS9.
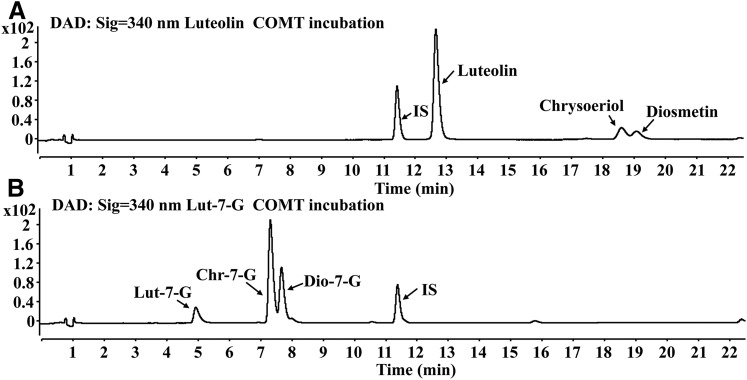
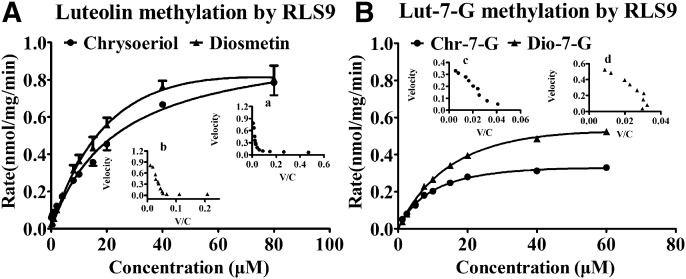
Luteolin was rapidly metabolized into two methylated metabolites (chrysoeriol and diosmetin) in the SAM-supplemented RLS9 (Fig. 5A), and the retention times of chrysoeriol and diosmetin were later than that of luteolin. Figure 6A shows the methylation kinetic curves of luteolin. According to the Eadie–Hofstee plot (Fig. 6, Aa and Ab), the formation of chrysoeriol and diosmetin was fitted using the biphasic model. With 3′,4′-dihydroxyl groups, Lut-7-G could be methylated by COMTs theoretically. There have been no reports on methylation metabolism of Lut-7-G. In our study, methylation of Lut-7-G was also observed in RLS9, with Chr-7-G and Dio-7-G as the two methylated metabolites (Fig. 5B). The formation of Chr-7-G and Dio-7-G was fitted using the Michaelis–Menten equation (Fig. 6, Bc and Bd).
Fig. 5.
UHPLC chromatograms of luteolin (A), Lut-7-G (B), and their respective methylated metabolites after incubation with SAM-supplemented RLS9.
Fig. 6.
Kinetics of luteolin (A) and Lut-7-G (B) methylation by RLS9 at different concentrations (0.125–80 μM for luteolin; 1.25–60 μM for Lut-7-G). Each inset shows the Eadie–Hofstee plot. For luteolin methylation, the formation of chrysoeriol (Aa) and diosmetin (Ab) was fitted using the biphasic model. For Lut-7-G methylation, the formation of Chr-7-G (Bc) and Dio-7-G (Bd) was fitted using the Michaelis–Menten equation. The RLS9 concentration was 0.25 mg/mL, and the incubation times for luteolin and Lut-7-G were 20 minutes and 30 minutes, respectively. All incubations were performed in triplicate. Each point represents the mean of three determinations. The error bar represents the S.D. of the mean (n = 3, mean ± S.D.).
The apparent kinetic parameters of luteolin and Lut-7-G methylation are listed in Table 2. The results showed that luteolin was methylated, with a preference for diosmetin (4′-O-methylation) over chrysoeriol (3′-O-methylation). The CLint values of chrysoeriol and diosmetin were 0.03 ± 0.01 and 0.05 ± 0.01 mL/min/mg, respectively. These data suggested that 4′-O-methylation was the prior reaction for luteolin in vitro. Compared with luteolin, the methylated metabolites of Lut-7-G, namely Chr-7-G and Dio-7-G, showed the same CLint value (0.04 ± 0.01 mL/min/mg) in RLS9.
TABLE 2.
Apparent kinetic parameters of luteolin and Lut-7-G methylation obtained from RLS9
Calculations were based on curve fitting using the Michaelis–Menten equation or biphasic model, as described in Materials and Methods. Data are expressed as the mean ± S.D., n = 3.
| Metabolites | Km (μmol/L) | Vmax (nmol/mg/min) | CLint (mL/min/mg) | |
|---|---|---|---|---|
| Luteolin | Chrysoeriola | 33.8 ± 4.1 | 1.06 ± 0.05 | 0.03 ± 0.01 |
| Diosmetina | 17.9 ± 1.7 | 0.92 ± 0.14 | 0.05 ± 0.01 | |
| Lut-7-G | Chr-7-Gb | 8.9 ± 0.6 | 0.38 ± 0.01 | 0.04 ± 0.01 |
| Dio-7-Gb | 15.1 ± 1.1 | 0.67 ± 0.02 | 0.04 ± 0.01 |
Biphasic equation.
Michaelis–Menten equation.
Glucuronidation and Methylation of Luteolin in RLS9.
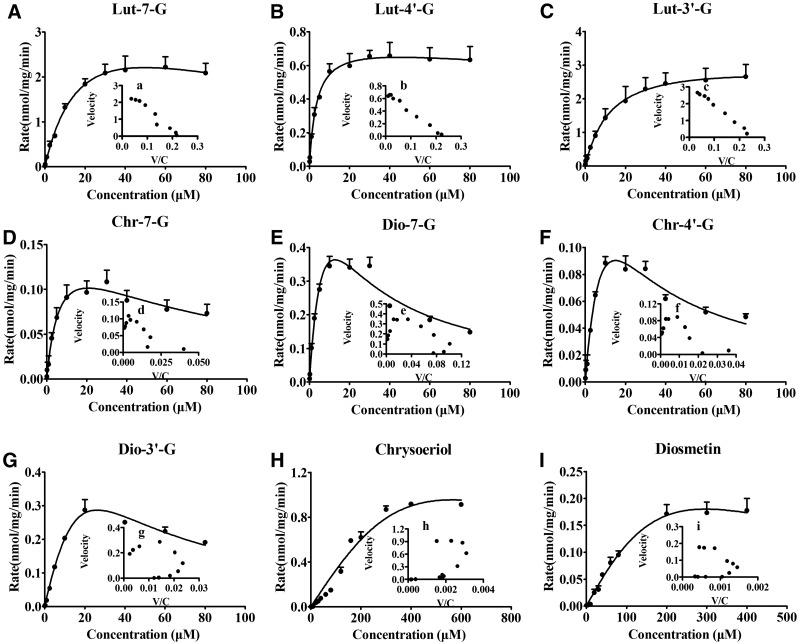
The glucuronidation and methylation kinetics of luteolin were investigated in the UGT–COMT coreaction system generated by RLS9. As shown in Fig. 7, luteolin was rapidly converted to Lut-7-G, Lut-4′-G, Lut-3′-G, Chr-7-G, Dio-7-G, Chr-4′-G, Dio-3′-G, chrysoeriol, and diosmetin in the UGT–COMT coreaction system. Lut-7-G, Lut-4′-G, and Lut-3′-G were fitted using the Michaelis–Menten equation (Fig. 7, A–C); Chr-7-G and Chr-4′-G were fitted using the substrate inhibition model (Fig. 7, D and F). Other metabolites were fitted using the autoactivation equation. Apparent kinetic parameters of these metabolites are listed in Table 3.
Fig. 7.
Kinetics of luteolin glucuronidation and methylation by RLS9 in UGT–COMT coreactions at different concentrations (0.125–600 μM). (A–I) Kinetic curves for the formation of Lut-7-G, Lut-4′-G, Lut-3′-G, Chr-7-G, Dio-7-G, Chr-4′-G, Dio-3′-G, chrysoeriol, and diosmetin in reaction mixture. Each inset shows the Eadie–Hofstee plot. Lut-7-G, Lut-4′-G, and Lut-3′-G formation were fitted using the Michaelis–Menten equation; Chr-7-G and Chr-4′-G formation were fitted using the substrate inhibition model. Other metabolites were fitted using the autoactivation equation. The RLS9 concentration was 0.25 mg/mL, and the incubation time was 30 minutes. All incubations were performed in triplicate. Each point represents the mean of three determinations. The error bar represents the S.D. of the mean (n = 3, mean ± S.D.).
TABLE 3.
Apparent kinetic parameters of luteolin glucuronidation and methylation obtained from RLS9 in UGT–COMT coreactions
Calculations were based on curve fitting using the Michaelis–Menten equation, substrate inhibition, or autoactivation model, as described in Materials and Methods. Data are expressed as the mean ± S.D., n = 3.
| Metabolites | Km (μmol/L) | Vmax (nmol/mg/min) | CLint (mL/min/mg) | Ki (μmol/L) |
|---|---|---|---|---|
| Lut-7-Ga | 9.9 ± 1.6 | 2.58 ± 0.11 | 0.26 ± 0.03 | |
| Lut-4′-Ga | 2.9 ± 0.3 | 0.69 ± 0.01 | 0.24 ± 0.02 | |
| Lut-3′-Ga | 11.5 ± 0.6 | 3.08 ± 0.05 | 0.27 ± 0.02 | |
| Chr-7-Gb | 7.3 ± 1.8 | 0.17 ± 0.02 | 0.02 ± 0.01 | 59 ± 17 |
| Dio-7-Gc | 9.4 ± 6.0 | 0.90 ± 0.40 | 0.11 ± 0.03 | |
| Chr-4′-Gb | 12.4 ± 4.5 | 0.24 ± 0.06 | 0.02 ± 0.01 | 18 ± 7 |
| Dio-3′-Gc | 44.4 ± 6.8 | 0.24 ± 0.02 | 0.01 ± 0.01 | |
| Chrysoeriolc | 1.3 ± 0.9 | 1.04 ± 0.18 | 1.16 ± 0.86 | |
| Diosmetinc | 6.6 ± 0.4 | 2.59 ± 0.15 | 0.39 ± 0.01 |
Michaelis–Menten equation.
Substrate inhibition equation.
Autoactivation equation.
Among these metabolites, the CLint values of glucuronides (0.24–0.27 mL/min/mg) were higher than those of methylated glucuronides of luteolin (0.01–0.11 mL/min/mg). Moreover, chrysoeriol and diosmetin showed the lowest CLint values (1.16 ± 0.86 and 0.39 ± 0.01 mL/min/mg, respectively). These results elucidated that glucuronidation contributed the most to clearance of luteolin, and the methylated metabolites (chrysoeriol and diosmetin) were further glucuronidated rapidly by UGTs in UGT–COMT coreaction system. The apparent CLint values of Lut-7-G, Lut-4′-G, and Lut-3′-G were 0.26 ± 0.03, 0.24 ± 0.02, and 0.27 ± 0.02 mL/min/mg in the coreaction system. For methylated glucuronides of luteolin, the Ki values of Chr-7-G and Chr-4′-G were 59 ± 17 and 18 ± 7 μM. The CLint values of Chr-7-G, Dio-7-G, Chr-4′-G, and Dio-3′-G in the coreaction system were 0.02 ± 0.01, 0.11 ± 0.03, 0.02 ± 0.01, and 0.01 ± 0.01 mL/min/mg, respectively.
Interplay of UGTs and COMTs in Luteolin Disposition in RLS9.
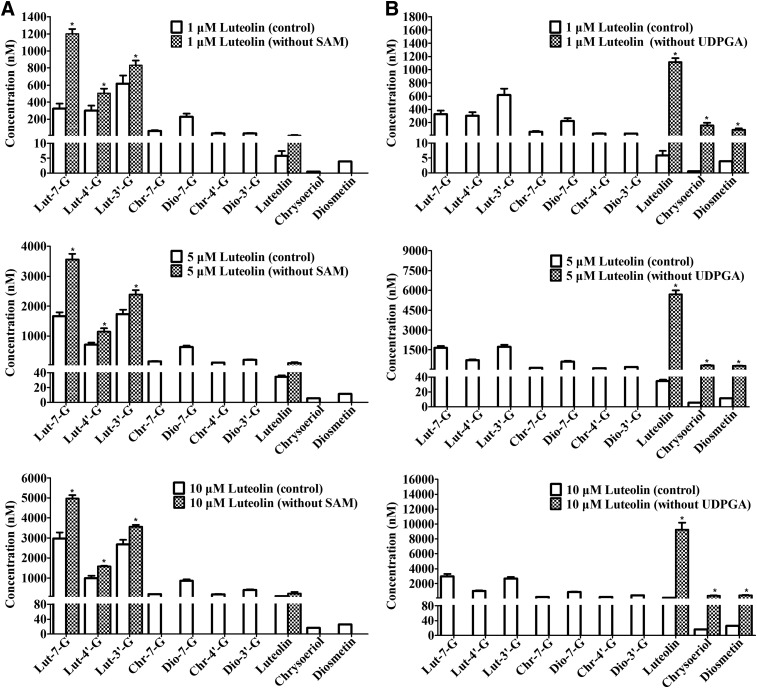
UGTs combined with COMT reactions were also conducted to determine whether glucuronidation and methylation reactions influence each other in luteolin disposition in rat liver. The absence of UDPGA (1.75 mM) or SAM (0.25 mM) during the methylation and glucuronidation of luteolin was observed in the UGT–COMT coreaction systems (Fig. 8). Figure 8A shows the effects of the absence of SAM during luteolin glucuronidation in mixed reactions. When 1 μM luteolin was incubated in the absence of SAM, chrysoeriol, diosmetin, Chr-7-G, Dio-7-G, Chr-4′-G, and Dio-3′-G were undetected, whereas the formations of Lut-7-G, Lut-4′-G, Lut-3′-G, and luteolin were significantly increased by 3.7-, 1.7-, 1.4-, and 1.9-fold compared with the corresponding control (P < 0.05; Fig. 8A1). The same trend was found for luteolin at 5 and 10 μM in RLS9 (P < 0.05; Fig. 8, A2 and A3). The formation of Lut-7-G, Lut-4′-G, Lut-3′-G, and luteolin was increased by 2.1-, 1.6-, 1.4-, and 2.9-fold when 5 μM luteolin was incubated in the absence of SAM. For 10 μM luteolin, the formation of Lut-7-G, Lut-4′-G, Lut-3′-G, and luteolin was increased by 1.7-, 1.6-, 1.3-, and 2.4-fold, respectively. These results illustrated that the glucuronidation rate of luteolin was inhibited by competing methylation. Similarly, glucuronidation blocking had shifted luteolin metabolism toward methylation, as indicated by the increased formation of chrysoeriol, diosmetin, and luteolin.
Fig. 8.
The influence of absence of SAM or UDPGA on the glucuronidation and methylation of luteolin by RLS9 in UGT–COMT coreactions. Three different concentrations (1, 5, and 10 μM) of luteolin were used in the experiment. (A1–A3) 1, 5, and 10 μM luteolin was incubated in the absence and presence of SAM, respectively; (B1–B3) 1, 5, and 10 μM luteolin was incubated in the absence and presence of UDPGA, respectively. The RLS9 concentration was 0.25 mg/mL, and the incubation time was 30 minutes. All incubations were performed in triplicate. Each column represents the mean of three determinations. The error bar represents the S.D. of the mean (n = 3, mean ± S.D.). Significant differences (P < 0.05, marked by *) compared with the corresponding control group were described.
In contrast, the absence of UDPGA significantly increased the chrysoeriol, diosmetin, and luteolin formation by 307-, 24-, and 193-fold compared with controls in RLS9 with 1 μM luteolin (P < 0.05; Fig. 8B1). This trend was also observed for 5 and 10 μM luteolin. The formation of chrysoeriol, diosmetin, and luteolin was significantly increased by 61-, 26-, and 166-fold with 5 μM luteolin (P < 0.05; Fig. 8B2). For 10 μM luteolin, the formation of chrysoeriol, diosmetin, and luteolin was significantly increased by 21-, 16-, and 100-fold (P < 0.05; Fig. 8B3). Given these results, glucuronidation markedly inhibited luteolin methylation, whereas methylation inhibited luteolin glucuronidation to a lesser extent.
Discussion
Due to the extensive metabolism by UGTs and COMTs, luteolin is hardly detected and is mainly present in the form of glucuronides and methylated glucuronides in vivo. The structure of luteolin-methylated glucuronides is too similar to separate using a conventional C18 column. In our study, a Cosmosil cholester-packed column (2.5 μm, 2.0 × 100 mm; Cosmosil), which has a higher molecular recognition ability, was used to separate these isomeric methylated glucuronides. The identification of the metabolites was performed by comparing of retention times using the biosynthesized standards. These standards were enzymatically synthesized and identified by analyzing mass-spectrometric fragmentation and shift in UV absorption spectra, as described in our previous publication (Tang et al., 2009; Li et al., 2015). A total of nine luteolin metabolites was detected in rat plasma and bile, including three glucuronides (Lut-7-G, Lut-4′-G, and Lut-3′-G), two methylated metabolites (chrysoeriol and diosmetin), and four methylated glucuronides (Chr-7-G, Dio-7-G, Chr-4′-G, and Dio-3′-G). The glucuronides, especially Lut-3′-G, exhibited the highest systemic exposure among these metabolites. This study is the first to show that the systemic exposure of luteolin is mediated by the interplay of UGTs and COMTs in vivo.
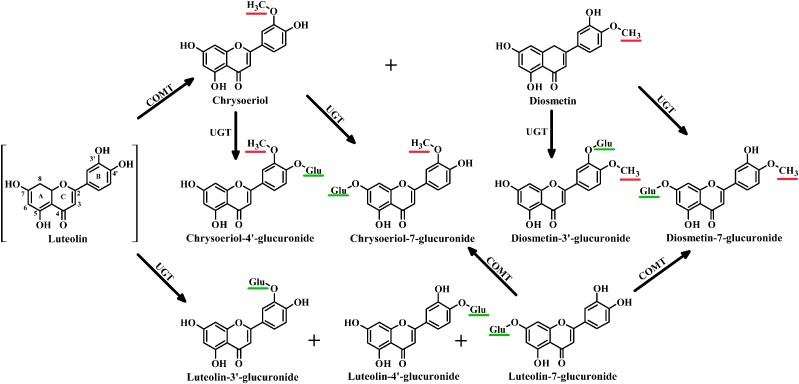
Given these metabolites of luteolin identified in our study, the proposed pathways of luteolin as proved by subsequent in vitro studies are shown in Fig. 9. We proposed two major pathways of disposition, as follows: 1) Luteolin was primarily methylated to chrysoeriol and diosmetin by COMTs, then chrysoeriol, diosmetin, and the remaining luteolin were glucuronidated to their corresponding glucuronides by UGTs; and 2) Luteolin was preferentially glucuronidated to Lut-7-G, Lut-4′-G, and Lut-3′-G, whereas some Lut-7-G was further methylated to Chr-7-G and Dio-7-G by COMTs. Luteolin glucuronides are the major metabolites in vivo; thus, we considered the second pathway to be predominant in luteolin disposition.
Fig. 9.
Two proposed disposition pathways of luteolin mediated by the interplay of UGTs and COMTs in rats. Glu, glucuronic acid. Red and green lines represent the methyl and glucuronic acid substitutions, respectively.
For the first pathway, the present study demonstrated that luteolin was converted to chrysoeriol and diosmetin by COMTs in RLS9; this observation is consistent with previous reports (Chen et al., 2011, 2013). Nevertheless, chrysoeriol and diosmetin were also rapidly glucuronidated to their respective glucuronides (Chr-7-G and Chr-4′-G for chrysoeriol; Dio-7-G and Dio-3′-G for diosmetin) in RLS9, and UGTs showed greater preference for the 4′- or 3′-hydroxyl group, which had higher affinities than the 7-hydroxyl group. Consequently, when luteolin was methylated to chrysoeriol and diosmetin in rats, glucuronidation rapidly occurred, and the main products were Chr-7-G, Dio-7-G, Chr-4′-G, and Dio-3′-G. Dio-3′-G and Chr-4′-G exhibited higher systemic exposure than Chr-7-G and Dio-7-G (P < 0.05).
The second pathway is considered to be the predominant pathway of luteolin. Consistent with a previous study (Boersma et al., 2002), luteolin was converted to Lut-7-G, Lut-4′-G, and Lut-3′-G by UGTs in RLS9. However, the CLint values for Lut-3′-G were less than that of Lut-7-G in vitro. This finding was not consistent with the in vivo results, in which Lut-3′-G exhibited markedly higher systemic exposure than Lut-7-G. We hypothesized that the notable difference may be caused by the subsequent methylation of Lut-7-G by COMTs in vivo, whereas Lut-3′-G could not be methylated because of the lack of 3′, 4′-dihydroxyl groups in its chemical structure.
The two pathways that mediated by the interplay of UGTs and COMTs are involved in the disposition of luteolin in vivo. Glucuronides of luteolin (Lut-7-G) could be further methylated by COMTs, and methylated metabolites of luteolin (chrysoeriol and diosmetin) underwent subsequent glucuronidation. Therefore, the glucuronidation and methylation kinetics of luteolin, as well as the relationship beween glucuronidation and methylation in disposition of luteolin, were investigated in the UGT–COMT coreaction systems. Glucuronidated metabolites of luteolin showed the highest CLint values among the metabolites in UGT–COMT coreaction system. In addition, methylation rate of luteolin was significantly increased by the absence of glucuronidation, whereas the glucuronidation rate of luteolin was significantly increased by the absence of methylation, but to a lesser extent. Methylation probably occurred and compensated for glucuronidation, but this process is relatively minor in luteolin disposition.
Luteolin possesses four hydroxyl groups at the 3′, 4′, 5, and 7 positions which are available for glucuronidation. Lut-3′-G and Lut-7-G are the major luteolin metabolites, whereas Lut-4′-G has the lowest formation rate in vivo and in vitro, as shown in the present study. This phenomenon may be attributed to the lower metabolic rate of Lut-4′-G catalyzed by UGT1A1 and UGT1A9, which are not the major UGTs responsible for the formation of Lut-4′-G, but are highly expressed in the liver (Wu et al., 2015). Additionally, luteolin-5-glucuronide and the diG of luteolin were not detected both in vivo and in vitro. Given the intramolecular hydrogen bond with the carbonyl group at the C-4 position, the conjugation of 5-hydroxyl group was unlikely (Wu et al., 2015). The absence of luteolin diG was probably attributed to the nonsaturated monoglucuronides (Tang et al., 2014).
Methylation mediated by COMTs is suggested to be an efficient detoxification pathway and a major reason for the lack of carcinogenicity of these catechol-type flavonoids in hamsters, such as quercetin and fisetin (Zhu et al., 1994). COMTs were classified into two distinct forms: the soluble COMT and the membrane-bound COMT; both forms are expressed in the greatest abundance and showed the highest activities in rat liver and human liver (Männistö and Kaakkola, 1999). Because soluble COMT is predominant and located in the cytosol, RLS9 was used as enzyme source for methylation, which is also suitable for glucuronidation metabolism by UGTs (Wang et al., 2005). A preference for the 4′-O-methylation over 3′-O-methylation of luteolin was observed with RLS9, which is consistent with the findings that the diosmetin/chrysoeriol ratio methylated by luteolin was 1.2–2.6 in rat tissue homogenates (Chen et al., 2011). This regioselectivity of luteolin has been explained by the more stable binding mode for 4′-O-methylation of luteolin than that for 3′-O-methylation based on theoretical investigations, including molecular dynamics simulations, binding free energy calculations, and quantum mechanics/molecular mechanics methods (Cao et al., 2014). For Lut-7-G methylation, no regioselectivity was observed in our study.
Dio-3′-G, the major form of diosmetin that circulates in human plasma, has been reported previously (Silvestro et al., 2013), but little is known of chrysoeriol metabolism. In our study, Chr-4′-G and Dio-3′-G exhibited higher plasma exposure than Chr-7-G and Dio-7-G (P < 0.05) after oral administration of luteolin in rats. However, Chr-4′-G and Dio-3′-G were not detected in rat bile; only Chr-7-G and Dio-7-G were present. The extensive biliary excretion of Dio-7-G and Chr-7-G might be a key factor that limits their systemic exposure. Conjugated flavonoids are the substrates of ABC efflux transporters (Zamek-Gliszczynski et al., 2011). These conjugates could be excreted to the bile and lumen by efflux transporters on the apical side of hepatocyte membranes, that is, multidrug resistance-associated protein 2 and breast cancer resistance protein. In contrast, these conjugates are transported to the bloodstream by the efflux transporters on the basolateral side, such as multidrug resistance-associated protein 1 (Lagas et al., 2010). We hypothesized that the difference of these methylated glucuronides of luteolin between plasma exposure and biliary excretion was related to efflux transporters. Further studies should focus on the efflux transporters that affect the excretion of chrysoeriol and diosmetin glucuronides.
In conclusion, this study reported for the first time that three glucuronides and four methylated glucuronides catalyzed by UGTs and COMTs were the predominant metabolites of luteolin in rats. Two metabolic pathways, which are mediated by the interplay of UGTs and COMTs, were proposed in the disposition of luteolin in RLS9. Furthermore, luteolin glucuronidation and methylation were compensated for each other, but glucuronidation was the predominant pathway.
Abbreviations
- Chr-4′-G
chrysoeriol-4′-glucuronide
- Chr-7-G
chrysoeriol-7-glucuronide
- COMT
catechol-O-methyltransferase
- diG
diglucuronide
- Dio-3′-G
diosmetin-3′-glucuronide
- Dio-7-G
diosmetin-7-glucuronide
- IS
internal standard
- LC-MS/MS
liquid chromatography–tandem mass spectrometry
- Lut-3′-G
luteolin-3′-glucuronide
- Lut-4′-G
luteolin-4′-glucuronide
- Lut-7-G
luteolin-7-glucuronide
- RLS9
rat liver S9 fraction
- SAM
S-adenosine-L-methionine iodized salt
- UDPGA
uridine diphosphate glucuronic acid
- UGT
UDP-glucuronosyltransferase
- UHPLC
ultra–high performance liquid chromatography
Authorship Contributions
Participated in research design: L. Wang, Li, Liu.
Conducted experiments: L. Wang, Chen, Li, Zeng.
Contributed new reagents or analytic tools: Zhu, Lu, Hu.
Performed data analysis: L. Wang, Chen, Li.
Wrote or contributed to the writing of the manuscript: L. Wang, Chen, X. Wang, Liu.
Footnotes
This work was supported by the joint fund set up by the National Natural Science foundation of China and the Government of the Xinjiang Uygur Autonomous Region [Grant U1203204]; the Key International Joint Research Project of National Natural Science Foundation of China [Grant 81120108025]; the Science and Technology Project of Guangzhou City [Grant 201509010004]; and the Natural Science Foundation of Guangdong Province [Grant 2015A030312012].
There is no financial conflict of interests with the authors of this paper. Publication of this paper will not benefit or adversely affect the financial situations of the authors.
L.W. and Q.C. contributed equally to this paper.
References
- Boersma MG, van der Woude H, Bogaards J, Boeren S, Vervoort J, Cnubben NH, van Iersel ML, van Bladeren PJ, Rietjens IM. (2002) Regioselectivity of phase II metabolism of luteolin and quercetin by UDP-glucuronosyl transferases. Chem Res Toxicol 15:662–670. [DOI] [PubMed] [Google Scholar]
- Bonifácio MJ, Loureiro AI, Torrão L, Fernandes-Lopes C, Wright L, Pinho MJ, Soares-da-Silva P. (2009) Species differences in pharmacokinetic and pharmacodynamic properties of nebicapone. Biochem Pharmacol 78:1043–1051. [DOI] [PubMed] [Google Scholar]
- Cao Y, Chen ZJ, Jiang HD, Chen JZ. (2014) Computational studies of the regioselectivities of COMT-catalyzed meta-/para-O methylations of luteolin and quercetin. J Phys Chem B 118:470–481. [DOI] [PubMed] [Google Scholar]
- Chan BC, Ip M, Gong H, Lui SL, See RH, Jolivalt C, Fung KP, Leung PC, Reiner NE, Lau CB. (2013) Synergistic effects of diosmetin with erythromycin against ABC transporter over-expressed methicillin-resistant Staphylococcus aureus (MRSA) RN4220/pUL5054 and inhibition of MRSA pyruvate kinase. Phytomedicine 20:611–614. [DOI] [PubMed] [Google Scholar]
- Chen J, Lin H, Hu M. (2003) Metabolism of flavonoids via enteric recycling: role of intestinal disposition. J Pharmacol Exp Ther 304:1228–1235. [DOI] [PubMed] [Google Scholar]
- Chen Z, Chen M, Pan H, Sun S, Li L, Zeng S, Jiang H. (2011) Role of catechol-O-methyltransferase in the disposition of luteolin in rats. Drug Metab Dispos 39:667–674. [DOI] [PubMed] [Google Scholar]
- Chen ZJ, Dai YQ, Kong SS, Song FF, Li LP, Ye JF, Wang RW, Zeng S, Zhou H, Jiang HD. (2013) Luteolin is a rare substrate of human catechol-O-methyltransferase favoring a para-methylation. Mol Nutr Food Res 57:877–885. [DOI] [PubMed] [Google Scholar]
- Dirscherl K, Karlstetter M, Ebert S, Kraus D, Hlawatsch J, Walczak Y, Moehle C, Fuchshofer R, Langmann T. (2010) Luteolin triggers global changes in the microglial transcriptome leading to a unique anti-inflammatory and neuroprotective phenotype. J Neuroinflammation 7:3. [DOI] [PMC free article] [PubMed] [Google Scholar]
- Kure A, Nakagawa K, Kondo M, Kato S, Kimura F, Watanabe A, Shoji N, Hatanaka S, Tsushida T, Miyazawa T. (2016) Metabolic fate of luteolin in rats: its relationship to anti-inflammatory effect. J Agric Food Chem 64:4246–4254. [DOI] [PubMed] [Google Scholar]
- Lagas JS, Sparidans RW, Wagenaar E, Beijnen JH, Schinkel AH. (2010) Hepatic clearance of reactive glucuronide metabolites of diclofenac in the mouse is dependent on multiple ATP-binding cassette efflux transporters. Mol Pharmacol 77:687–694. [DOI] [PubMed] [Google Scholar]
- Lemańska K, van der Woude H, Szymusiak H, Boersma MG, Gliszczyńska-Swigło A, Rietjens IM, Tyrakowska B. (2004) The effect of catechol O-methylation on radical scavenging characteristics of quercetin and luteolin: a mechanistic insight. Free Radic Res 38:639–647. [DOI] [PubMed] [Google Scholar]
- Li Q, Wang L, Dai P, Zeng X, Qi X, Zhu L, Yan T, Wang Y, Lu L, Hu M, et al. (2015) A combined strategy of mass fragmentation, post-column cobalt complexation and shift in ultraviolet absorption spectra to determine the uridine 5′-diphospho-glucuronosyltransferase metabolism profiling of flavones after oral administration of a flavone mixture in rats. J Chromatogr A 1395:116–128. [DOI] [PubMed] [Google Scholar]
- Liu W, Tang L, Ye L, Cai Z, Xia B, Zhang J, Hu M, Liu Z. (2010) Species and gender differences affect the metabolism of emodin via glucuronidation. AAPS J 12:424–436. [DOI] [PMC free article] [PubMed] [Google Scholar]
- Liu Z, Song XD, Xin Y, Wang XJ, Yu H, Bai YY, Liu JH, Zhang CN, Hui RT. (2009) Protective effect of chrysoeriol against doxorubicin-induced cardiotoxicity in vitro. Chin Med J 122:2652–2656. [PubMed] [Google Scholar]
- López-Lázaro M. (2009) Distribution and biological activities of the flavonoid luteolin. Mini Rev Med Chem 9:31–59. [DOI] [PubMed] [Google Scholar]
- Männistö PT, Kaakkola S. (1999) Catechol-O-methyltransferase (COMT): biochemistry, molecular biology, pharmacology, and clinical efficacy of the new selective COMT inhibitors. Pharmacol Rev 51:593–628. [PubMed] [Google Scholar]
- Park SW, Cho CS, Jun HO, Ryu NH, Kim JH, Yu YS, Kim JS, Kim JH. (2012) Anti-angiogenic effect of luteolin on retinal neovascularization via blockade of reactive oxygen species production. Invest Ophthalmol Vis Sci 53:7718–7726. [DOI] [PubMed] [Google Scholar]
- Mishra B, Priyadarsini KI, Kumar MS, Unnikrishnan MK, Mohan H. (2003) Effect of O-glycosilation on the antioxidant activity and free radical reactions of a plant flavonoid, chrysoeriol. Drug Metab Dispos 11:2677–2685. [DOI] [PubMed] [Google Scholar]
- Seelinger G, Merfort I, Wölfle U, Schempp CM. (2008) Anti-carcinogenic effects of the flavonoid luteolin. Molecules 13:2628–2651. [DOI] [PMC free article] [PubMed] [Google Scholar]
- Silvestro L, Tarcomnicu I, Dulea C, Attili NR, Ciuca V, Peru D, Rizea Savu S. (2013) Confirmation of diosmetin 3-O-glucuronide as major metabolite of diosmin in humans, using micro-liquid-chromatography-mass spectrometry and ion mobility mass spectrometry. Anal Bioanal Chem 405:8295–8310. [DOI] [PMC free article] [PubMed] [Google Scholar]
- Shimoi K, Okada H, Furugori M, Goda T, Takase S, Suzuki M, Hara Y, Yamamoto H, Kinae N. (1998) Intestinal absorption of luteolin and luteolin 7-O-beta-glucoside in rats and humans. FEBS Lett 438:220–224. [DOI] [PubMed] [Google Scholar]
- Shimoi K, Saka N, Kaji K, Nozawa R, Kinae N. (2000) Metabolic fate of luteolin and its functional activity at focal site. Biofactors 12:181–186. [DOI] [PubMed] [Google Scholar]
- Tang L, Li Y, Chen WY, Zeng S, Dong LN, Peng XJ, Jiang W, Hu M, Liu ZQ. (2014) Breast cancer resistance protein-mediated efflux of luteolin glucuronides in HeLa cells overexpressing UDP-glucuronosyltransferase 1A9. Pharm Res 31:847–860. [DOI] [PubMed] [Google Scholar]
- Tang L, Singh R, Liu Z, Hu M. (2009) Structure and concentration changes affect characterization of UGT isoform-specific metabolism of isoflavones. Mol Pharm 6:1466–1482. [DOI] [PMC free article] [PubMed] [Google Scholar]
- Wang Q, Jia R, Ye C, Garcia M, Li J, Hidalgo IJ. (2005) Glucuronidation and sulfation of 7-hydroxycoumarin in liver matrices from human, dog, monkey, rat, and mouse. In Vitro Cell Dev Biol Anim 41:97–103. [DOI] [PubMed] [Google Scholar]
- Wu L, Liu J, Han W, Zhou X, Yu X, Wei Q, Liu S, Tang L. (2015) Time-dependent metabolism of luteolin by human UDP-glucuronosyltransferases and its intestinal first-pass glucuronidation in mice. J Agric Food Chem 63:8722–8733. [DOI] [PubMed] [Google Scholar]
- Zamek-Gliszczynski MJ, Day JS, Hillgren KM, Phillips DL. (2011) Efflux transport is an important determinant of ethinylestradiol glucuronide and ethinylestradiol sulfate pharmacokinetics. Drug Metab Dispos 39:1794–1800. [DOI] [PubMed] [Google Scholar]
- Zhu BT, Ezell EL, Liehr JG. (1994) Catechol-O-methyltransferase-catalyzed rapid O-methylation of mutagenic flavonoids: metabolic inactivation as a possible reason for their lack of carcinogenicity in vivo. J Biol Chem 269:292–299. [PubMed] [Google Scholar]
- Zhu L, Lu L, Zeng S, Luo F, Dai P, Wu P, Wang Y, Liu L, Hu M, Liu Z. (2015) UDP-glucuronosyltransferases 1A6 and 1A9 are the major isozymes responsible for the 7-O-glucuronidation of esculetin and 4-methylesculetin in human liver microsomes. Drug Metab Dispos 43:977–983. [DOI] [PMC free article] [PubMed] [Google Scholar]
- Zhu W, Xu H, Wang SW, Hu M. (2010) Breast cancer resistance protein (BCRP) and sulfotransferases contribute significantly to the disposition of genistein in mouse intestine. AAPS J 12:525–536. [DOI] [PMC free article] [PubMed] [Google Scholar]


