

Abstract
This study investigated the early and long-term effects of atherogenic diet on hepatic gene expression, and the restorative effects of atorvastatin in treating hypercholesterolemia. Two groups of female C57BL/6J mice were fed standard chow or atherogenic diet for 1-week early phase study and two other groups for 10 weeks. The fifth group had daily 10 mg/kg atorvastatin injections for 3 weeks from week 8 of the atherogenic diet. Gene expression profiling was carried out with Affymetrix GeneChips. One-week atherogenic diet elevated 38 and inhibited 127 gene expressions, while 10-week atherogenic diet elevated 165 and inhibited 281 genes by more than twofold. Atorvastatin could restore 78.2% and 68%, respectively, of the genes to normal levels. Genes in the Insig (insulin-induced gene)-SREBP (sterol regulatory element binding proteins) pathway were mostly inhibited by atherogenic diet at week 1 but elevated at week 10. Of these, 65.2% were restored by atorvastatin. In conclusion, lipid homeostatic mechanism coped well with short-term atherogenic diet. However, when such a diet was prolonged, the mechanism was no longer effective but entered into a pathological state in which lipogenic genes, especially those in the Insig-SREBP pathway, were upregulated. Atorvastatin could restore changes in the Insig-SREBP pathway that were induced by the atherogenic diet.
Key words: Atherogenic diet, Statin, Microarray, Insig-SREBP pathway
INTRODUCTION
Coronary artery disease (CAD) is the number one killer in developed nations and hypercholesterolemia has been found to be one of its main independent risk factors. Lipogenesis is regulated by the expression and activation of the sterol regulatory element binding proteins (SREBPs). SREBPs are a family of membrane-bound transcription factors that directly induce the expression of about 30 genes involved in the synthesis and uptake of fatty acids, triglycerides, cholesterol, phospholipids, and the NADPH cofactor. SREBP-1c and SREBP-2 are transcriptional regulators of the fatty acid and cholesterol synthesis pathways respectively (7,8). The SREBPs reside as inactive precursors in the endoplasmic reticulum (ER) membrane. Upon vesicular transport to the Golgi apparatus, they are proteolytically cleaved to liberate a fragment that enters the nucleus and activates SRE-containing genes. SREBP cleavage-activating protein (SCAP), an SREBP escort protein, has a sterol-sensing domain that is necessary for sterols to inhibit SREBP transport to the Golgi apparatus (1). Recent coimmunoprecipitation studies have led to the discovery of SCAP-inter-acting proteins, insulin-induced gene-1 (Insig-1), and insulin-induced gene-2 (Insig-2) (23,25). Goldstein and Brown proposed then that the three molecules normally form an Insig-SCAP-SREBP macromolecular complex in the ER. If Insig is released from the complex because of the low cholesterol level or relative lack of Insig protein, SCAP might escort SREBPs to the Golgi apparatus, leading to lipogenesis (1).
It is widely known that atherogenic diets could induce hypercholesterolemia and lipogenesis. Rabbits fed with diets containing 2% cholesterol had elevated serum cholesterol levels after 2 weeks (24). C57BL/6J male mice had higher cholesterol, LDL/VLDL cholesterol, and triglycerides levels after only 11 days of feeding high-fat diets (5). C57BL/6J mice are most commonly used in diet-induced hypercholesterolemia and atherosclerosis because of their high sensitivity to atherogenic (Ath) diets. However, a cholesterol feedback mechanism is in place in which excess dietary cholesterol intake would lead to inhibition of cholesterol synthesis. In the livers of C57BL/6J mice, the levels of all nuclear SREBPs and most of their downstream enzymes were reduced upon feeding of dietary cholesterol for 2 days, and Insig-1 transgenic mice had more declined expression (2).
To date, the turning point at which the Insig-SREBP pathway transit from its responsive negative feedback state into what we termed as a ‘‘molecular pathological state,’’ in which the gene expression of Insig-SREBP pathway becomes upregulated instead of being down-regulated, is unclear.
In this study, we investigated the gene expression profiles of the livers of C57BL/6J mice with a focus on the Insig-SREBP pathway. We also investigated the gene expression profiles after the Ath-fed mice were treated with atorvastatin, a HMG coenzyme A reductase (Hmgcr) inhibitor. Statins are commonly prescribed to treat hypercholesterolemia and it would be interesting to examine their treatment effects on gene expression profiles.
MATERIALS AND METHODS
Animals and Experimental Protocol
Eight-week-old female C57BL/6J mice were purchased from Laboratory Animal Center (LAC), National University of Singapore, and maintained in the animal facility for 2 weeks. For the 1-week early phase study, the control group (C1w) and atherogenic diet group (Ath1w) consisted of three randomly assigned mice in each group. For the 10-week long-term study, a total of 15 mice were randomly divided into three groups: control (C10w), atherogenic diet (Ath10w), and atorvastatin group (ST). The diet of control groups (C1w and C10w) was standard chow, containing 19% protein, 4.6% fat, and 76.4% carbohydrate. The atherogenic diet SF00-219 for the Ath1w, Ath10w, and ST groups was purchased from Specialty Feeds, Australia. It contained 19% protein, 21% fat, 60% carbohydrate, and 0.15% cholesterol. The mice in the ST group had atherogenic diet for 10 weeks but with atorvastatin treatment beginning from the 8th week to the end of 10th week. Atorvastatin calcium tablets (Lipitor®, Parke-Davis), were dissolved in 1× PBS buffer to make 2 mg/ml stock solution. Daily doses of 10 mg/kg of atorvastatin were administered to the mice in the ST group by IP injections for 3 weeks (20).
At the end of the study period, mice were fasted overnight (1800 h to 0900 h) and sacrificed by cardiac puncture under the anesthetic cocktails (fentanyl citrate 0.315 mg/ml, fluanisone 10 mg/ml, and Midazolam 5 mg/ml) at a dosage of 0.15 ml/mouse. Blood was collected and livers were quickly removed. The liver was stored in RNAlater (Qiagen, 76104) or immediately snap-frozen in liquid nitrogen and stored at −80°C.
This investigation conforms with the Guide for the Care and Use of Laboratory Animals published by the US National Institutes of Health (NIH Publication No. 85-23, revised 1996).
Plasma Lipid Analysis
Fasting plasma total cholesterol (Chol), HDL cholesterol (HDL), and triglycerides (TG) were measured by enzymatic colorimetric assay kits on an autoanalyzer (Cobas Mira, Roche). LDL/VLDL cholesterol (LDL/VLDL) levels were determined as the difference between total and HDL cholesterol levels.
Oligonucleotide Microarrays
To determine liver gene transcript profiles in the five groups, relative abundance of mRNAs in the Ath1w, Ath10w, and ST groups were compared with their respective controls using the Mouse Genome 430A GeneChip (MOE430A, Affymetrix) containing 22,690 probe sets. Sample preparation, array hybridization, and scanning were carried out according to the manufacturer’s manual. Briefly, the individual liver tissues within the same group were pooled to obtain a total of 80–100 mg tissue. Total RNA was isolated, purified, and reverse transcribed to cDNA and finally transcribed to biotinylated cRNA. The labeled cRNA was fragmented, mixed into hybridization cocktail, injected into the GeneChip MOE430A cartridge, and incubated at 45°C for 16 h. The arrays were washed, stained, and finally scanned using the Agilent G2500A Gene Array scanner. The quality of the fragmented biotin-labeled cRNA was ascertained as previously described (18) before being hybridized onto the MOE430A array by using Test-3 arrays.
Real-Time PCR
Real-time reverse transcription PCR (RT-PCR) was used to validate the microarray results of a focused set of genes related to lipid metabolism. These are fatty acid synthase (Fasn); fatty acid binding protein 5 (Fabp5), Hmgcr, Srebp1, SCAP, and Insig-2. Fasn, Hmgcr, Srebp1, SCAP, and Insig-2 are members of the Insig-SREBP pathway. Fabp5 is the gene involved in lipid transport and had the greatest fold change based on microarray results. The primer sequences are listed in Table 1.
TABLE 1.
PRIMER SEQUENCES USED FOR RT-PCR
| cDNA | GenBank No. | Forward (5′ → 3′) | Reverse (5′ → 3′) |
|---|---|---|---|
| GAPDH | M32599 | ggtgcaggatgcattgctgacaa | tgcatccactggtgctgccaag |
| Fasn | AF127033 | tgcctccactgactcttcacaga | ctagactcaatacacaggctgctg |
| Hmgcr | NM_008255 | tgtggccaggagtttggtgactga | taagattcaacaactctgctgacc |
| Fabp5 | BC002008 | ccgagagcacagtgaagacgac | accgtcttggaaggtgcagacc |
| Srebp1 | NM_011480 | gatggcaccctcttgctctgtag | aggcccagccggatctacacta |
| SCAP | BC07-437 | ggatgtactaacaggcagccg | ccaggtcctgctgaatggagta |
| Insig-2 | NM_133748 | gctcgctttgcatttctgaa | cactataggaaagcatgggcac |
LightCycler SYBR Green I Real time-PCR kit (Roche, 3064760) was used to quantify the mRNA of the five target genes. The housekeeping gene glycer-aldehyde-3-phosphate dehydrogenase (GAPDH) was used for normalization between chips. The Light Cycler quantification software was used to calculate the relative Ath1w/C1w, Ath10w/C10w, or ST/C10w ratio of each target gene. The ratios were transformed to log base 2 ratios.
Statistical Analysis
Measurements were expressed as mean ± SD from at least three independent experiments, except for gene expression levels. The differences of mouse body weight and plasma lipid levels in the five various groups were compared by two-tailed t-test using SPSS12.0.
Affymetrix Microarray Suite version 5.0 (Affymetrix) was used to analyze the scanned image. Expression patterns were analyzed according to the following pair-wise comparisons: Ath1w versus C1w, Ath10w versus C10w, and ST versus C10w. In order to get the robust ‘increase” expression profile, “I,” experimental “absent” cells were eliminated and only the genes flagged as “I” with “Signal Log2 Ratio” of not less than 1.0 (twofold increase) were selected. Likewise for robust “decrease” profile, the baseline “absent” cells were eliminated and only the genes flagged as change “D” with “Signal Log2 Ratio” of not more than −1.0 (twofold decrease) were selected. The selected genes were classified according to their biological processes using Affymetrix GO browser.
RESULTS
Mouse Body Weight
For the early phase study, we found no significant difference in mean body weights between the Ath1w and C1w groups at baseline or endpoint. There was also no significant difference among the three long-term groups at baseline. The mean body weights of Ath10w (23.86 ± 1.18 g) and ST (24.11 ± 1.04 g) groups were significantly higher than the C10w group (21.43 ± 1.12 g, p < 0.05) just before the ST group received their atorvastatin treatment at the 8th week. At the conclusion of the 10-week study, only the Ath10w group had significantly higher mean body weight than the C10w group (25.32 ± 1.99 vs. 22.62 ± 1.24 g, p < 0.05), whereas those of the ST mice (22.86 ± 0.89 g) were no longer significantly higher than the controls.
Plasma Lipid Levels
For the early phase study, Ath1w mice had significantly higher mean Chol (2.71 ± 0.29 vs. 1.86 ± 0.29 mM, p < 0.05) and HDL levels (2.21 ± 0.11 vs. 1.52 ± 0.22 mM, p < 0.05) than C1w mice. No significant difference in LDL/VLDL and TG levels was observed (Fig. 1).
Figure 1.
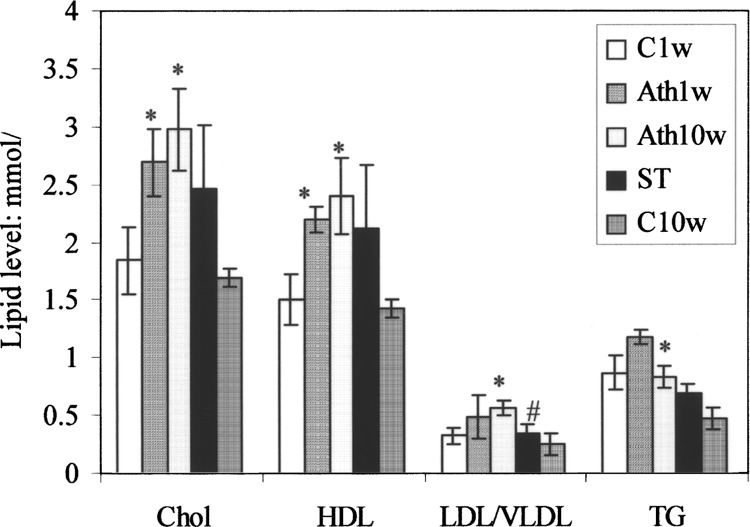
Final plasma lipid levels of the five experimental mice groups. The lipid levels of the Ath1w group were compared to those of the C1w group; Ath10w and ST groups were compared to the C10w group. *p < 0.05 versus control; #p < 0.05 versus Ath group.
For the long-term effect study, the Ath10w group showed significantly higher mean Chol, HDL, LDL/ VLDL, and TG levels than the C10w group, while the ST group had no higher lipid level than the C10w group, as shown in Figure 1. In addition, ST was found to lower the LDL/VLDL level compared to the Ath10w group. The data demonstrated that hypercholesterolemia was induced by the atherogenic diet and that it could be reversed by atorvastatin.
Microarray Analysis
For the early phase study, a total of 38 genes in the Ath1w group had robust increase in expression levels relative to the C1w group. These included 23 genes involved in lipid, carbohydrate, protein, and nucleic acid metabolism. Of these genes, 1 week of atherogenic diet induced the expression of 2 genes related to lipid metabolism and transport (Table 2). Conversely, a total of 127 genes had robust decrease in expression level in the Ath1w group, of which 55 are related to metabolisms. Table 2 shows 1 week of atherogenic diet could inhibit expression of 7 genes related to lipid synthesis, metabolism, and transport.
TABLE 2.
COMPARISON OF GENE TRANSCRIPT PATTERNS INVOLVED IN LIPID METABOLISM/TRANSPORT: CHANGES IN THE Ath1w GROUP WITH REFERENCE TO THE C1w GROUP
| Fold Change | Gene Title | Gene Symbol | Function |
|---|---|---|---|
| ↑ 3.2 | Carnitine palmitoyltransferase 1a, liver | Cpt1a | Fatty acid metabolism, transport |
| ↑ 2.1 | Acetyl-coenzyme A acyltransferase 1 | Acaa1 | Fatty acid metabolism |
| ↓ 4.9 | ATP citrate lyase | Acly | Tricarboxylic acid cycle metabolism, lipid biosynthesis |
| ↓ 3.2 | Cytochrome P450, family 7, subfamily a, polypeptide 1 | Cyp7a1 | Electron transport, cholesterol metabolism |
| ↓ 2.3 | Isopentenyl-diphosphate delta isomerase | Idi1 | Cholesterol biosynthesis |
| ↓ 2.1 | Glycerol-3-phosphate acyltransferase, mitochondrial | Gpam | Fatty acid metabolism, phospholipid biosynthesis |
| ↓ 2.1 | Cytochrome P450, 51 | Cyp51 | Electron transport, cholesterol biosynthesis |
| ↓ 2.0 | ATP-binding cassette, sub-family D (ALD), member 2 | Abcd2 | Fatty acid metabolism, transport |
| ↓ 2.0 | UDP-glucose ceramide glucosyltransferase | Ugcg | Glucosylceramide biosynthesis, glycosphingolipid biosynthesis |
The genes are arranged in descending order of fold change. ↑: increased expression; ↓: decreased expression.
A total of 165 genes in the Ath10w group had robust elevated expression level relative to the C10w group. Of these, 78 are involved in metabolism, 21 of which are involved in lipid metabolism, such as fatty acid and cholesterol biosynthesis, fatty acid elongation, and lipid transport (Table 3). Conversely, a total of 281 genes had robust reduced expression level in the Ath group, including 84 genes related to metabolism, 8 of which are related to lipid catabolism or degradation (Table 3).
TABLE 3.
COMPARISON OF GENE TRANSCRIPT PATTERNS INVOLVED IN LIPID METABOLISM/TRANSPORT: CHANGES IN THE Ath10w AND ST GROUPS WITH REFERENCE TO THE C10w GROUP
| Fold Change | Gene Title | Gene Symbol | Function | |
|---|---|---|---|---|
| Ath10w | ST | |||
| ↑ 10.6 | ↔ | Fatty acid binding protein 5, epidermal | Fabp5 | Lipid transport |
| ↑ 9.8 | ↔ | RAS p21 protein activator 1 | Rasa1 | Intracellular signaling cascade, cell growth and/or maintenance |
| ↑ 7.5 | ↑ 18 | Cytochrome P450, family 3, subfamilya, polypeptide 16 | Cyp3a16 | Electron transport |
| ↑ 5.3 | ↑ 8 | Apolipoprotein A-IV | Apoa4 | Cholesterol absorption |
| ↑ 5.3 | ↑ 3.7 | StAR-related lipid transfer (START) domain containing 4 | Stard4 | Steroid biosynthesis, lipid transport |
| ↑ 4.3 | ↔ | Stearoyl-coenzyme A desaturase 1 | Scd1 | Fatty acid biosynthesis |
| ↑ 4.0 | ↔ | ELOVL family member 6, elongation of long chain fatty acids | Elovl6 | Fatty acid elongation |
| ↑ 3.5 | ↔ | UDP-glucose ceramide glucosyltransferase | Ugcg | Glucosylceramide biosynthesis, glycosphin-golipid biosynthesis |
| ↑ 2.8 | ↔ | Fatty acid synthase | Fasn | Fatty acid biosynthesis |
| ↑ 2.8 | ↔ | Lysosomal acid lipase 1 | Lip1 | Lipid catabolism |
| ↑ 2.8 | ↔ | ATP citrate lyase | Acly | Lipid biosynthesis |
| ↑ 2.6 | ↑ 2 | Fatty acid binding protein 2, intestinal | Fabp2 | Lipid transport |
| ↑ 2.5 | ↔ | Stearoyl-coenzyme A desaturase 2 | Scd2 | Fatty acid biosynthesis |
| ↑ 2.5 | ↑ 2.6 | Farnesyl diphosphate farnesyl transferase 1 | Fdft1 | Cholesterol biosynthesis, isoprenoid biosynthesis |
| ↑ 2.3 | ↑ 2 | Phospholipid transfer protein | Pltp | Lipid transport |
| ↑ 2.3 | ↑ 4.9 | Sterol-C4-methyl oxidase-like | Sc4mol | Fatty acid metabolism, sterol biosynthesis |
| ↑ 2.3 | ↔ | Farnesyl diphosphate synthetase | Fdps | Isoprenoid biosynthesis |
| ↑ 2.3 | ↔ | Sterol regulatory element binding protein 1 | Srebp1 | Regulation of transcription lipid metabolism |
| ↑ 2.3 | ↔ | Fatty acid desaturase 2 | Fads2 | Electron transport |
| ↑ 2.1 | ↔ | 3-Hydroxy-3-methylglutaryl-coenzyme A reductase | Hmgcr | Cholesterol biosynthesis |
| ↑ 2 | ↔ | Phosphatidic acid phosphatase 2a | Ppap2a | Protein amino acid dephosphorylation, diacylglycerol biosynthesis, signal transduction |
| ↓ 3.2 | ↓ 4.3 | Sterol carrier protein 2, liver | Scp2 | Fatty acid degradation |
| ↓ 3.0 | ↔ | Granulin | Grn | Lipid catabolism |
| ↓ 2.5 | ↔ | Glycerol kinase | Gyk | Fatty acid degradation |
| ↓ 2.5 | ↔ | Cytosolic acyl-CoA thioesterase 1 | Cte1 | Long-chain fatty acid metabolism, acyl-CoA metabolism |
| ↓ 2.3 | ↔ | Cytochrome P450, family 39, subfamily a, polypeptide 1 | Cyp39a1 | Electron transport, bile acid biosynthesis, cholesterol catabolism |
| ↓ 2.1 | ↔ | Cellular nucleic acid binding protein | Cnbp | Regulation of transcription, cholesterol biosynthesis |
| ↓ 2.0 | ↔ | Cytochrome P450, 51 | Cyp51 | Electron transport, cholesterol biosynthesis |
| ↓ 2.0 | ↔ | Acetyl-coenzyme A acyltransferase 1 | Acaa1 | Fatty acid metabolism |
The genes are arranged in descending order of fold change. Ath: atherogenic diet; ST: atherogenic diet + treatment with atorvastatin from weeks 8 to 10. ↑: increased expression; ↓: decreased expression; ↔: no change.
From the analysis of Tables 2 and 3, we found different patterns of alteration in lipid-related gene expressions of the Ath1w and Ath10w groups. First, the number of genes with altered expression was markedly increased from 2 to 21 in the group treated for 10 weeks compared to 1 week of the same diet. Second, the effect of the 10-week atherogenic diet was not simply an intensification of the 1-week effect. For example, of the 2 genes that were elevated in the Ath1w group, acetyl-coenzyme A acyltransferase 1 (Acaa1) was decreased instead in the Ath10w while carnitine palmitoyltransferase 1a (Cpt1a) was no longer elevated. On the other hand, expression levels of ATP citrate lyase (Acyl) and UDP-glucose ceramide glucosyltransferase (Ugcg) were reduced in the Ath1w group but elevated in the Ath10w group.
Next, we compared the gene expression profiles of the ST group with the C10w group. Of the 165 genes whose expressions were increased by the Ath diet, atorvastatin had effectively reduced 78.2% of the gene transcripts to normal, using twofold change as cut off. Of the 21 genes related to lipid biosynthesis and transport, two thirds were completely restored to control levels by statin treatment. These include stearoyl-coenzyme A desaturase 1(Scd1), Acyl, Fasn, Srebp1, and Fabp5. Atorvastatin also elevated 68.0% of the gene transcripts that were inhibited by the Ath diet to normal levels. Of the 8 genes involved in lipid catabolism or degradation, 7 were normalized by statin treatment. The details are listed in Table 3.
Gene Expression Profiles of Insig-SREBP Pathway
We next focused on the Insig-SCAP-SREBP pathway by analyzing the transcript levels of more than 30 genes involved in this pathway in the different groups. We found 10 weeks of atherogenic diet widely increased the gene expression of the Insig-SREBP pathway. Of the 10 genes regulated by SREBP-1c, 9 had positive signal log ratios, with 6 having robust elevation. All 9 signal log ratios were lower in the ST group than in the Ath10w group, as shown in Figure 2a. Of the 14 SREBP-2 regulated genes that are involved in cholesterol synthesis, 10 had positive signal log ratios, of which 2 were robust elevations. These are 3-hydroxy-3-methylglutaryl-CoA reductase (Hmgcr) and farnesyl diphosphate synthetase (Fdps). Five of the 10 were lowered by atorvastatin treatment (Fig. 2b).
Figure 2.
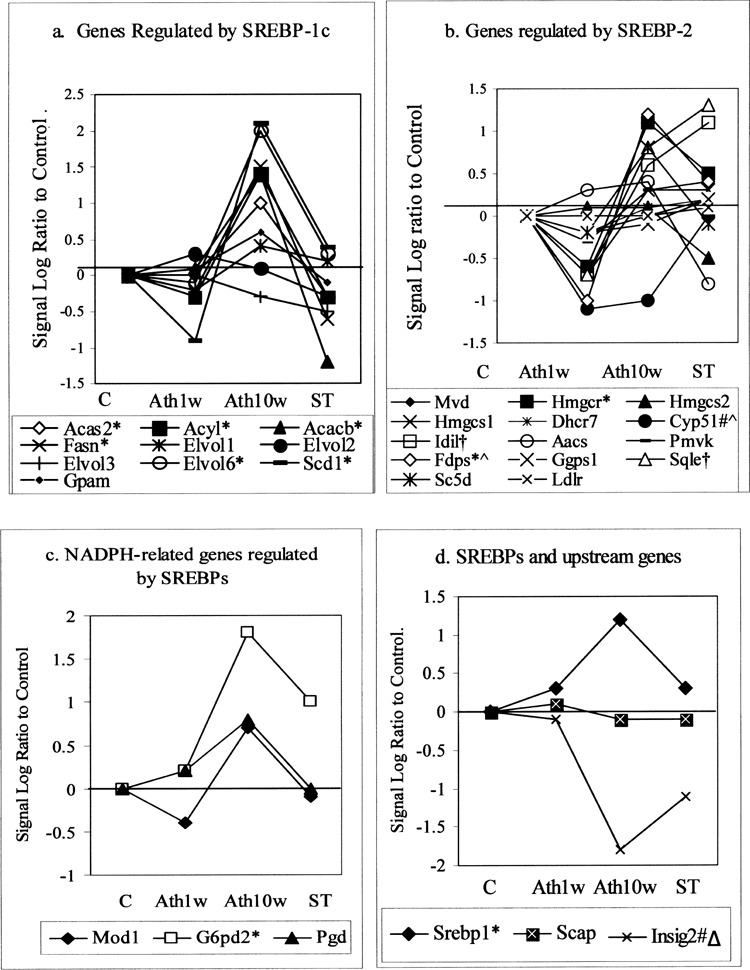
The transcription levels of genes related to the Insig-SREBP pathway. Data show the signal log ratio to their respective control. (a) The transcription level of genes regulated by SREBP-1c. (b) The transcription level of genes regulated by SREBP-2. (c) The transcription levels of NADPH-related genes regulated by both SREBP-1c and SREBP-2. (a–c) The transcription levels of the downstream enzyme genes of the SREBP pathway were mostly inhibited by 1 week of Ath diet, then induced by the 10-week Ath diet, and finally restored by atorvastatin treatment. (d) The transcription level of SREBP-1 was induced by 1 week and 10 weeks of Ath diet and slightly reversed by atorvastatin treatment, while that of Insig-2 was reduced by 1 week and 10 weeks of Ath diet but partially restored by atorvastatin treatment. The transcription level of SCAP remained stable. Lss and SREBP2 were omitted because their cell calls were ‘absent” in all five groups. *: robust increase in Ath10w; #: robust decrease in Ath10w; †: robust increase in ST; Δ: robust decrease in ST; ^: robust decrease in Ath1w. Acas: acetyl-CoA synthetase; Acyl: ATP citrate lysase; Acacb: acetyl-CoA carboxylase beta; Fasn: fatty acid synthase; Elovl: elongation of very long chain fatty acids; Scd: stearoyl-CoA desaturase; Gpam: glycerol-3-phosphate acyltransferase, mitochondrial; Mvd: mevalonate (diphospho) decarboxylase; Hmgcr: 3-hydroxy-3-methylgltaryl-CoA reductase; Hmgcs: 3-hydroxy-3-methylgltaryl-CoA synthase; Dhcr7: 7-dehydrocholesterol reductase; Cyp51: cytochrome P450, 51; Idi1: isopentenyl-diphosphate delta isomerase; Aacs: acetoacetyl-CoA synthetase; Pmvk: phosphomevalonate kinase; Fdps: farnesyl diphosphate synthase; Ggps: geranylgeranyl diphosphate synthase; Sqle: squalene epoxidase; Lss: lanosterol synthase; Sc5d: sterol-C5-desaturase; Ldlr: low-density-lipoprotein cholesterol receptor; Mod: malic enzyme; G6pd2: glucose-6-phosphate dehydrogenase 2; Pgd: phosphogluconate dehydrogenase; Srebp: sterol regulatory element binding protein; Scap: Sreb cleavage-activating protein; Insig: insulin induced gene.
All the 3 NADPH related-genes regulated by both SREBP-1c and SREBP-2 had positive signal log ratios after 10 weeks of Ath diet, of which glucose-6-phosphate dehydrogenase 2 (G6pd2) had robust increase. They were all reduced by atorvastatin (Fig. 2c). SREBP-1 itself was also upregulated by atherogenic diet and downregulated by atorvastatin. Insig-2 was significantly inhibited by 10 weeks of atherogenic diet and restored partially by atorvastatin (Fig. 2d). Hence, the 10-week atherogenic diet elevated 82.1% of both downstream and upstream gene expressions of this pathway, while atorvastatin restored 65.2% of the genes of the Insig-SREBP pathway.
On the other hand, 1 week of atherogenic diet had different effects on the gene expression of the Insig-SREBP pathway. Figure 2 shows the signal log ratios of 64.3% of the total Insig-SREBP pathway genes were negative after 1 week of atherogenic diet. For the SREBP2 regulated genes, 92.3% were negative. Figure 2d shows the direction of change of SREBP-1 and Insig-2 was the same in the Ath1w and Ath10w groups. The transcription level of SCAP did not fluctuate significantly.
Real-Time PCR
As shown in Figure 3, RT-PCR showed no significant changes of 6 genes in the Ath1w group. In the Ath10w group, Hmgcr, Fasn, Fabp5, and Srebp1 mRNA levels were significant increased. Atorvastatin could reverse these mRNA levels to normal (signal log ratio between 1 and −1). The expression of SCAP was constant in both Ath10w and ST groups, while the Insig-2 level was significantly downregulated in both groups. All of the RT-PCR data were consistent with those of microarray.
Figure 3.
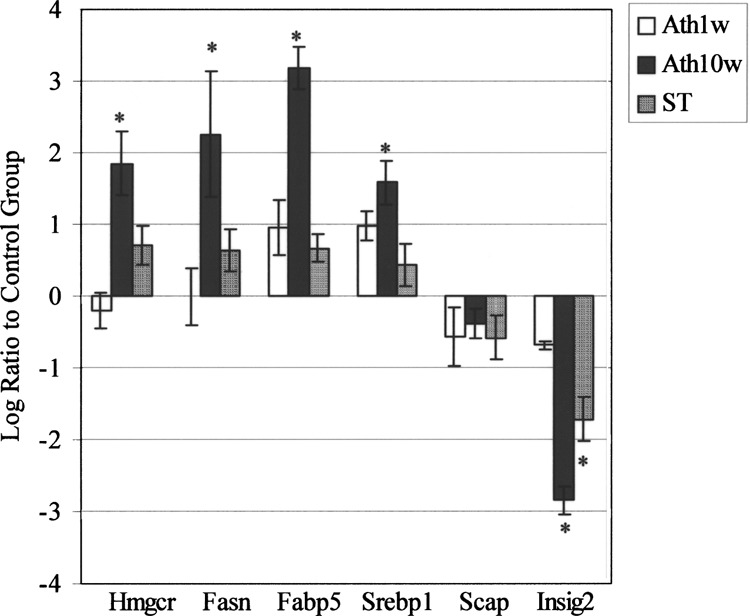
RT-PCR results for selected genes, using “Log2 Ratio ±1” as significant “increase” and “decrease” cut off, respectively. One week of Ath diet did not cause significant changes comparing to 1 week of standard chow. Ten weeks of Ath diet induced the transcription levels of Hmgcr, Fasn, Fabp5, and Srebp-1, and atorvastatin restored their levels. The expression of SCAP was kept stable in all groups, while the Insig-2 level was significantly inhibited in both groups. The data were consistent with the results of microarray. *: significant increase or decrease comparing to control. Fasn: fatty acid synthase; Fabp5: fatty acid binding protein 5; Hmgcr: 3-hydroxy-3-methylgltaryl-CoA reductase; Srebp1: sterol regulatory element binding protein 1; SCAP: Sreb cleavage activating protein; Insig-2: insulin induced gene 2.
DISCUSSION
The focus of this study is on the effect of Ath diet on gene expression profiles in the mouse liver and to evaluate the efficacy of statin in reversing the responses to the Ath diet. We found 36% of the genes that had altered expression in Ath10w group are involved in metabolism. Of the 78 metabolic genes that had increased expression in Ath10w group, 27% are associated with lipid metabolism, including fatty acid or cholesterol biosynthesis, fatty acid elongation, and lipid transport.
From our results, it is observed that the SREBP pathway was activated by the 10-week Ath diet. Members of the SREBP family regulate lipid haemostasis. SREBP-1a and -1c are derived from a single gene through the use of different transcription initiation sites. SREBP-2 is derived from a second gene.
The expression of SREBP-1c is mainly in liver and other animal tissues, while SREBP-1a is constitutively expressed at low basal levels in liver tissues (17). In the past decade, the downstream genes of SREBPs had been well studied (8). SREBP-1c regulates genes involved in fatty acid, triglyceride, and phospholipid biosynthesis, such as Acyl, acetyl-CoA carboxylase beta (Acacb), Fasn, fatty acid elongase complex, Scd and glycerol-3-phosphate acyltransferase, mitochondrial (Gpam). SREBP-2 exerts its effects on genes related to cholesterol synthesis, such as 3-hydroxy-3-methylgltaryl-CoA synthase (Hmgcs), Hmgcr, Fdps, and squalene epoxidase (Sqle). Both SREBP-1c and SREBP-2 activate malic enzyme (Mod), G6pd2, and 6-phosphogluconate dehydrogenase (Pgd), which are required to generate NADPH. Recently, the regulation of SREBPs expression was widely studied. The SREBPs transcription could be regulated by diet, liver X-activated receptors (LXRs), insulin, and glucagon. A high-fat diet significantly induced the SREBP-1 expression in ICAM-1-deficient mouse livers at day 1 and day 11, while polyunsaturated fatty acids reduced SREBP-1c mRNA transcription and lipogenesis rate (5,22). Glucose could induce lipogenesis in rat muscle satellite cells via a SREBP-1c-dependent Jak/STAT pathway (6). Ceramide synthesis positively correlated with elevated active SREBP and its downstream gene transcription, while inhibition of cera-mide synthesis decreased their transcriptional levels (21). The LXR agonist, T1317, induced transcriptional levels of SREBP-1 and SREBP-1c-regulated genes, Fasn, and the S14 protein in primary rat hepatocytes (14). In this study, we found that a long-term, 10-week atherogenic diet could significantly induce the expression of the SREBP pathway, including Srebp1, Fasn, Scd1, Scd2, Acly, and Hmgcr, while the Insig-2 gene was significantly inhibited by 10-week atherogenic diet.
We also noted the significant change of Insig gene expression in both Ath and ST groups with reference to the control group. In 1991, the Insig gene was first identified in liver tissue that was treated by insulin (13), and its essential role in carbohydrates and lipid homeostasis was identified in 2002 (25). Insig is a membrane protein in ER that binds the sterol-sensing domain of SCAP and facilitates retention of the SCAP/SREBP complex. A second ER protein, Insig-2, was found to block the movement of SREBP from ER to Golgi apparatus and therefore ultimately block cholesterol synthesis, like Insig-1 (23). In cultured liver cells Insig-1 and Insig-2 inhibited proteolytic processing of SREBPs (1,23,25). In mouse or rat livers, overexpression of Insig-1 or -2 inhibited SREBP processing and reduced lipogenesis (2,19). The Insig-1 promoter is in turn regulated by active SREBPs and sterols. Rosiglitazone, an agonist of peroxisome proliferator-activated receptor-gamma (PPARγ), could induce Insig-1 and regulate SREBP processing (10). A new line of mutant Chinese hamster ovary cells deficient in both Insig-1 and Insig-2 proved the interaction between sterols and Insigs. Sterols neither inhibit SREBP processing nor promote Hmgcr ubiquitination in these cells, while sterol-resistance was fully restored when they are transfected with either Insig-1 or Insig-2 (11). Insigs double knock-out mice further confirmed the interaction. A recent study showed 2.5 days of cholesterol feeding reduced nuclear SREBPs and lipogenic mRNAs in C57BL mice; this feedback response was severely blunted by Insigs double knocking-outs (3). However, the Insigs’ antilipogenic mechanism remains unclear. To date, only two target proteins of Insig were found and both have similar YIYF sequences in the membrane domain. One is SCAP, binding to which leads to ER retention of the complexes between SCAP and SREBPs, thereby regulating the whole SREBP pathways (25). Another is Hmgcr, binding to which leads to its ubiquitination and degradation (16). A recent study showed the yeast Insig homologs NSG1 and NSG2 inhibit degradation of Hmgcr homolog Hmg2p by directly interacting with the sterol-sensing domain-containing transmembrane region (4). Hence, Insig may regulate lipogenesis in different stages. In this study, Insig-2 transcription was inhibited by the 10-week atherogenic diet. Unfortunately, no Insig-1 probe set is available in the Affymetrix MOE430A Genechip. The lower level of Insig-2 might cause higher expression of genes of SREBP pathway or directly maintained the activity of Hmgcr, and finally lead to higher plasma lipid levels.
The results of long-term atherogenic diet effects are interesting because they deviate from what we would expect from a negative cholesterol feedback regulation system. Our data suggest that an atherogenic diet could finally upregulate the gene expression of the Insig-SREBP pathway into what we define as a “pathological state at the transcriptome level.” In this pathological state, instead of downregulating cholesterol and fatty acids synthesis, more of them are produced after the feedback balance is destroyed. Engelking et al. demonstrated that most of the SREBPs pathway genes had lower levels of expression after 2 days of atherogenic diet with 0.05%, 0.15%, or 0.5% cholesterol, including Acacb, Fasn, Hmgcs, Hmgcr, Fdps, LDL receptor, and SREBP-2 (2). Their data from the 2-day atherogenic diet fit the cholesterol-feedback mechanism well. Maxwell et al. found 11 of SREBP target genes were downregulated after feeding 1 week of a diet with 0.5% cholesterol (12). These include Sqle, Fdps, Hmgcr, Acyl, and Mod. To date, no study has investigated the turning point of the Insig-SREBP pathway from the functional feedback control mode to pathological state. As part of our ongoing studies to investigate the time course effects of atherogenic diet, we raised twp additional groups, C1w and Ath1w. In our study, the Insig-SREBP pathway was clearly in a pathological state after feeding 10 weeks of the atherogenic diet. We also found the expression of downstream enzyme genes was feedback inhibited by atherogenic diet at the 1-week point. Although we have not determined the accurate turning points of the pathways, we have demonstrated that the turning points of most of the pathways were after 1 week and that those for the upstream genes appear earlier than those of downstream genes.
Atorvastatin, a Hmgcr inhibitor, is widely administered to hypercholesterolemic patients to lower their plasma cholesterol level. Recently it was reported that other than Hmgcr, statins also have effects on other genes, such as those in the SREBP pathway. One study showed that 3 days of high doses (0.1% w/w) of atorvastatin and simvastatin enhanced the expression of the SREBPs pathway genes, such as SREBP-2, Hmgcr, Fasn, and Acacb, in normolipidemic rats (15). Their study also showed 3 days of mevalonate feeding inhibited SREBP-2 and Hmgcr mRNA levels, and that atorvastatin could reverse the changes. In our study, long-term high-fat feeding produced a pathological change in the SREBP pathway, while 3 weeks of moderate dosage of atorvastatin was effective in reversing the Ath diet-induced gene expression levels. Atorvastatin restored the SREBP-1 and most of the SREBPs downstream genes besides directly inhibiting Hmgcr. Insig could be a candidate to explain the statins’ wide-ranging effects on lipid lowering. Firstly, Insigs can directly interact with both Hmgcr and statins (16). Secondly, another hypocholesterolemic agent, LY295427, which can activate LDL receptor to reduce plasma LDL level, was reported to increase expression of Insig-1 and restore the SREBP processing (9). Actually, our microarray data showed that atorvastatin could moderately restore the Insig-2 transcription level that had been significantly inhibited by the atherogenic diet. We will be focusing on the possible association between statins and Insigs in our future studies.
In summary, our study has provided a molecular window into the interplay between the key molecules of the Insig-SCAP-SREBPs molecular complex in the livers of mice fed with an atherogenic diet and later treated with atorvastatin. We concluded from this study that 1) the lipid homeostatic mechanism in the mice was able to cope with the short-term 1-week atherogenic diet but when such feeding was prolonged to 10 weeks, the genes responsible for lipid homeostasis were no longer effective but entered a pathological state in which lipogenic genes, especially those in the Insig-SREBP pathway, were upregulated instead of being downregulated, and 2) atorvastatin could restore the changes in the Insig-SREBP pathway that were brought about by the atherogenic diet.
ACKNOWLEDGMENTS
This study was supported in part by the Singapore National Medical Research Council grant NMRC/0408/2000. We would like to thank Dr. Leslie Retnam and his team at the Animal Holding Unit, NUS, for their invaluable help in the animal experiments; Professor Richard Deckelbaum for insightful advice; and Ms. Karen Lee and Ms. Hui-Jen Lye for their skillful technical assistance.
REFERENCES
- 1. Anderson R. G. Joe Goldstein and Mike Brown: From cholesterol homeostasis to new paradigms in membrane biology. Trends Cell Biol. 13:534–539; 2003. [DOI] [PubMed] [Google Scholar]
- 2. Engelking L. J.; Kuriyama H.; Hammer R. E.; Horton J. D.; Brown M. S.; Goldstein J. L.; Liang G. Overexpression of Insig-1 in the livers of transgenic mice inhibits SREBP processing and reduces insulin-stimulated lipogenesis. J. Clin. Invest. 113:1168–1175; 2004. [DOI] [PMC free article] [PubMed] [Google Scholar]
- 3. Engelking L. J.; Liang G.; Hammer R. E.; Takaishi K.; Kuriyama H.; Evers B. M.; Li W. P.; Horton J. D.; Goldstein J. L.; Brown M. S. Schoenheimer effect explained—feedback regulation of cholesterol synthesis in mice mediated by Insig proteins. J. Clin. Invest. 115:2489–2498; 2005. [DOI] [PMC free article] [PubMed] [Google Scholar]
- 4. Flury I.; Garza R.; Shearer A.; Rosen J.; Cronin S.; Hampton R. Y. INSIG: A broadly conserved transmembrane chaperone for sterol-sensing domain proteins. EMBO J. 24:3917–3926; 2005. [DOI] [PMC free article] [PubMed] [Google Scholar]
- 5. Gregoire F. M.; Zhang Q.; Smith S. J.; Tong C.; Ross D.; Lopez H.; West D. B. Diet-induced obesity and hepatic gene expression alterations in C57BL/6J and ICAM-1-deficient mice. Am. J. Physiol. Endocrinol. Metab. 282:E703–713; 2002. [DOI] [PubMed] [Google Scholar]
- 6. Guillet-Deniau I.; Pichard A. L.; Kone A.; Esnous C.; Nieruchalski M.; Girard J.; Prip-Buus C. Glucose induces de novo lipogenesis in rat muscle satellite cells through a sterol-regulatory-element-binding-protein-1c-dependent pathway. J. Cell Sci. 117:1937–1944; 2004. [DOI] [PubMed] [Google Scholar]
- 7. Horton J. D. Sterol regulatory element-binding proteins: Transcriptional activators of lipid synthesis. Biochem. Soc. Trans. 30:1091–1095; 2002. [DOI] [PubMed] [Google Scholar]
- 8. Horton J. D.; Goldstein J. L.; Brown M. S. SREBPs: Activators of the complete program of cholesterol and fatty acid synthesis in the liver. J. Clin. Invest. 109:1125–1131; 2002. [DOI] [PMC free article] [PubMed] [Google Scholar]
- 9. Janowski B. A. The hypocholesterolemic agent LY295427 up-regulates INSIG-1, identifying the INSIG-1 protein as a mediator of cholesterol homeostasis through SREBP. Proc. Natl. Acad. Sci. USA 99:12675–12680; 2002. [DOI] [PMC free article] [PubMed] [Google Scholar]
- 10. Kast-Woelbern H. R.; Dana S. L.; Cesario R. M.; Sun L.; de Grandpre L. Y.; Brooks M. E.; Osburn D. L.; Reifel-Miller A.; Klausing K.; Leibowitz M. D. Rosiglitazone induction of Insig-1 in white adipose tissue reveals a novel interplay of peroxisome proliferator-activated receptor gamma and sterol regulatory element-binding protein in the regulation of adipogenesis. J. Biol. Chem. 279:23908–23915; 2004. [DOI] [PubMed] [Google Scholar]
- 11. Lee P. C.; Sever N.; Debose-Boyd R. A. Isolation of sterol-resistant Chinese hamster ovary cells with genetic deficiencies in both Insig-1 and Insig-2. J. Biol. Chem. 280:25242–25249; 2005. [DOI] [PubMed] [Google Scholar]
- 12. Maxwell K. N.; Soccio R. E.; Duncan E. M.; Sehayek E.; Breslow J. L. Novel putative SREBP and LXR target genes identified by microarray analysis in liver of cholesterol-fed mice. J. Lipid Res. 44:2109–2119; 2003. [DOI] [PubMed] [Google Scholar]
- 13. Mohn K. L.; Laz T. M.; Hsu J. C.; Melby A. E.; Bravo R.; Taub R. The immediate-early growth response in regenerating liver and insulin-stimulated H-35 cells: comparison with serum-stimulated 3T3 cells and identification of 41 novel immediate-early genes. Mol. Cell. Biol. 11:381–390; 1991. [DOI] [PMC free article] [PubMed] [Google Scholar]
- 14. Pawar A.; Botolin D.; Mangelsdorf D. J.; Jump D. B. The role of liver X receptor-alpha in the fatty acid regulation of hepatic gene expression. J. Biol. Chem. 278:40736–40743; 2003. [DOI] [PubMed] [Google Scholar]
- 15. Roglans N.; Verd J. C.; Peris C.; Alegret M.; Vazquez M.; Adzet T.; Diaz C.; Hernandez G.; Laguna J. C.; Sanchez R. M. High doses of atorvastatin and simvastatin induce key enzymes involved in VLDL production. Lipids 37:445–454; 2002. [DOI] [PubMed] [Google Scholar]
- 16. Sever N.; Song B. L.; Yabe D.; Goldstein J. L.; Brown M. S.; DeBose-Boyd R. A. Insig-dependent ubiquitination and degradation of mammalian 3-hydroxy-3-methylglutaryl-CoA reductase stimulated by sterols and geranylgeraniol. J. Biol. Chem. 278:52479–52490; 2003. [DOI] [PubMed] [Google Scholar]
- 17. Shimomura I.; Shimano H.; Horton J. D.; Goldstein J. L.; Brown M. S. Differential expression of exons 1a and 1c in mRNAs for sterol regulatory element binding protein-1 in human and mouse organs and cultured cells. J. Clin. Invest. 99:838–845; 1997. [DOI] [PMC free article] [PubMed] [Google Scholar]
- 18. Sreekumar R.; Unnikrishnan J.; Fu A.; Nygren J.; Short K. R.; Schimke J.; Barazzoni R.; Nair K. S. Effects of caloric restriction on mitochondrial function and gene transcripts in rat muscle. Am. J. Physiol. Endocrinol. Metab. 283:E38–43; 2002. [DOI] [PubMed] [Google Scholar]
- 19. Takaishi K.; Duplomb L.; Wang M. Y.; Li J.; Unger R. H. Hepatic Insig-1 or -2 overexpression reduces lipogenesis in obese Zucker diabetic fatty rats and in fasted/refed normal rats. Proc. Natl. Acad. Sci. USA 101:7106–7111; 2004. [DOI] [PMC free article] [PubMed] [Google Scholar]
- 20. Vecchione C.; Brandes R. P. Withdrawal of 3-hydroxy-3-methylglutaryl coenzyme A reductase inhibitors elicits oxidative stress and induces endothelial dysfunction in mice. Circ. Res. 91:173–179; 2002. [DOI] [PubMed] [Google Scholar]
- 21. Worgall T. S.; Juliano R. A.; Seo T.; Deckelbaum R. J. Ceramide synthesis correlates with the posttranscriptional regulation of the sterol-regulatory element-binding protein. Arterioscler. Thromb. Vasc. Biol. 24:943–948; 2004. [DOI] [PubMed] [Google Scholar]
- 22. Xu J.; Nakamura M. T.; Cho H. P.; Clarke S. D. Sterol regulatory element binding protein-1 expression is suppressed by dietary polyunsaturated fatty acids. A mechanism for the coordinate suppression of lipogenic genes by polyunsaturated fats. J. Biol. Chem. 274:23577–23583; 1999. [DOI] [PubMed] [Google Scholar]
- 23. Yabe D.; Brown M. S.; Goldstein J. L. Insig-2, a second endoplasmic reticulum protein that binds SCAP and blocks export of sterol regulatory element-binding proteins. Proc. Natl. Acad. Sci. USA 99:12753–12758; 2002. [DOI] [PMC free article] [PubMed] [Google Scholar]
- 24. Yang A. L.; Chen H. I. Chronic exercise reduces adhesion molecules/iNOS expression and partially reverses vascular responsiveness in hypercholesterolemic rabbit aortae. Atherosclerosis 169:11–17; 2003. [DOI] [PubMed] [Google Scholar]
- 25. Yang T.; Espenshade P. J.; Wright M. E.; Yabe D.; Gong Y.; Aebersold R.; Goldstein J. L.; Brown M. S. Crucial step in cholesterol homeostasis: Sterols promote binding of SCAP to Insig-1, a membrane protein that facilitates retention of SREBPs in ER. Cell 110:489–500; 2002. [DOI] [PubMed] [Google Scholar]