Extinction risk is widespread across the tree of life (1, 2). Therefore, a key goal of conservation biology is to identify predictors of species endangerment. The prevailing consensus that larger species are more likely to be threatened (3) was recently overturned by Ripple et al. (4), who demonstrate instead a U-shaped relationship between endangerment and body size among the world’s vertebrates—a conclusion with significant implications (5). However, we identify four problems with their conclusions. First, increases in endangerment of smaller vertebrates are heavily biased by a single class (Amphibia), which harbors the smallest tetrapods (6). Second, a U-shaped pattern found among amphibians themselves resulted from a biased subsample of this class. Third, these biases are exaggerated by improper phylogenetic analyses. Fourth, consideration of species’ geographic range sizes (GRS) alters the relationship between endangerment and body mass. We address these problems using a much larger sample of amphibians. We reject the proposed U-shaped relationship, showing instead that endangerment declines with increasing body mass, but that for a given GRS the relationship changes direction.
Using the Global Amphibian Biodiversity Project initiative’s dataset spanning body mass for 5,137 amphibian species, and GRS for 6,506 species, we reassessed Ripple et al.’s (4) bimodal distribution of endangerment. We performed conventional and phylogenetic logistic regressions of threat against body mass and GRS (7), with the R package phylolm (8), using a global amphibian phylogeny of 3,126 species (9). We quantified endangerment as a binary measure, as used by Ripple et al. (4), in which “threat” is true for species in International Union for Conservation of Nature (IUCN) categories Critically Endangered, Endangered, and Vulnerable, and false otherwise. We repeated analyses with different assumptions for data-deficient (DD) species: first, excluding them (2,077 species) and second, including them (2,328 species), considering them to be all (i) threatened or (ii) nonthreatened (10).
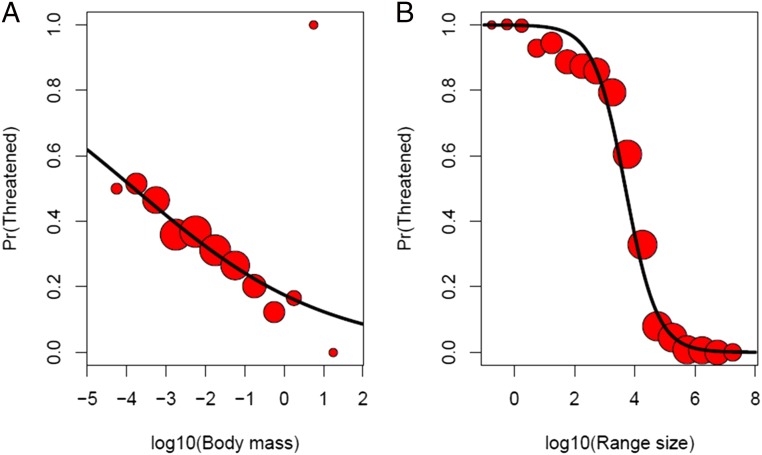
All patterns identified with our analyses are highly significant and of the same sign in nonphylogenetic generalized linear models (n = 3,884 excluding DD species; 4,907 including them), and in analyses with different treatments of DD species. Ignoring GRS, the probability of being threatened declines with increasing body size [slope of logit(Pr(threat)) against log10(Body mass) = −0.406, z = −4.90, P < 0.001; Fig. 1A], with no evidence of a turning point (quadratic slope = −0.002, z = −0.107, P = 0.914). A very small sample of species with body mass ∼5 kg were all threatened (Fig. 1A), but these have negligible leverage on the analyses. However, the relationship between threat status and GRS is also significantly negative [slope against log10(Range size) = −1.902, z = −19.884, P < 0.001; Fig. 1B]. For a given GRS, larger-bodied species are significantly more likely to be threatened (slope = 0.368, z = 3.009, P = 0.003), with no evidence of a turning point (quadratic slope = −0.007, z = −0.068, P = 0.946). Phylogenetic signal in threat status is strong (α = 0.030, 95% bootstrap confidence interval [0.024, 0.035]).
Fig. 1.
Threat status among amphibians declines with increasing body mass, or with increasing range size. Scatterplots show proportions of amphibian species classed as threatened according to IUCN categorization against (A) midpoints of binned log10(Body mass) classes and (B) midpoints of binned log10(Range size) classes. Fitted lines describe trends in probability of being threatened, derived from single-predictor phylogenetic logistic regressions with binary error structure. Point sizes are proportional to the log10 of sample size in each bin.
Threat status declines with increasing body mass among amphibians, but the influence of GRS, and the small body masses of Amphibia generally, means that this should not be used as evidence for greater endangerment of both large and small vertebrates in general.
Footnotes
The authors declare no conflict of interest.
References
- 1.Dirzo R, et al. Defaunation in the Anthropocene. Science. 2014;345:401–406. doi: 10.1126/science.1251817. [DOI] [PubMed] [Google Scholar]
- 2.Ceballos G, et al. Accelerated modern human-induced species losses: Entering the sixth mass extinction. Sci Adv. 2015;1:e1400253. doi: 10.1126/sciadv.1400253. [DOI] [PMC free article] [PubMed] [Google Scholar]
- 3.Gaston KJ, Blackburn TM. Birds, body size and the threat of extinction. Philos Trans R Soc Lond B Biol Sci. 1995;347:205–212. [Google Scholar]
- 4.Ripple WJ, et al. Extinction risk is most acute for the world’s largest and smallest vertebrates. Proc Natl Acad Sci USA. 2017;114:10678–10683. doi: 10.1073/pnas.1702078114. [DOI] [PMC free article] [PubMed] [Google Scholar]
- 5.Kalinkat G, Jähnig SC, Jeschke JM. Exceptional body size-extinction risk relations shed new light on the freshwater biodiversity crisis. Proc Natl Acad Sci USA. 2017;114:E10263–E10264. doi: 10.1073/pnas.1717087114. [DOI] [PMC free article] [PubMed] [Google Scholar]
- 6.Wells KD. The Ecology and Behavior of Amphibians. Chicago Univ Press; Chicago: 2007. [Google Scholar]
- 7.Ives AR, Garland T., Jr Phylogenetic logistic regression for binary dependent variables. Syst Biol. 2010;59:9–26. doi: 10.1093/sysbio/syp074. [DOI] [PubMed] [Google Scholar]
- 8.Ho Ls, Ané C. A linear-time algorithm for Gaussian and non-Gaussian trait evolution models. Syst Biol. 2014;63:397–408. doi: 10.1093/sysbio/syu005. [DOI] [PubMed] [Google Scholar]
- 9.Pyron RA. Biogeographic analysis reveals ancient continental vicariance and recent oceanic dispersal in amphibians. Syst Biol. 2014;63:779–797. doi: 10.1093/sysbio/syu042. [DOI] [PubMed] [Google Scholar]
- 10.Böhm M, et al. The conservation status of the world’s reptiles. Biol Conserv. 2013;157:372–385. [Google Scholar]


