Abstract
Epithelial surfaces form critical barriers to the outside world and are continuously renewed by adult stem cells1. Whereas epithelial stem cell dynamics during homeostasis are increasingly well understood, how stem cells are redirected from a tissue-maintenance program to initiate repair after injury remains unclear. Here, we examined infection by Heligmosomoides polygyrus (Hp), a co-evolved pathosymbiont of mice, to assess the epithelial response to disruption of the mucosal barrier. Hp disrupts tissue integrity by penetrating the duodenal mucosa, where it develops while surrounded by a multicellular granulomatous infiltrate2. Unexpectedly, intestinal stem cell (ISC) markers, including Lgr53, were lost in crypts overlying larvae-associated granulomas, despite continued epithelial proliferation. Granuloma-associated Lgr5− crypt epithelia activated an interferon-gamma (IFNγ)-dependent transcriptional program, highlighted by Sca-1 expression, and IFNγ-producing immune cells were found in granulomas. A similar epithelial response accompanied systemic activation of immune cells, intestinal irradiation, or ablation of Lgr5+ ISCs. Granuloma-associated crypt cells generated fetal-like spheroids in culture, and a sub-population of Hp-induced cells activated a fetal-like transcriptional program, demonstrating that adult intestinal tissues can repurpose aspects of fetal development. Thus, re-initiation of the developmental program represents a fundamental mechanism by which the intestinal crypt can remodel to sustain function after injury.
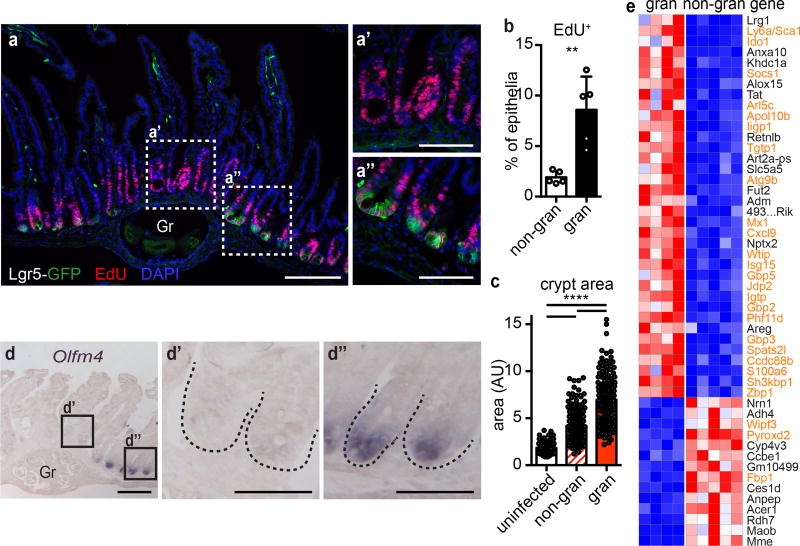
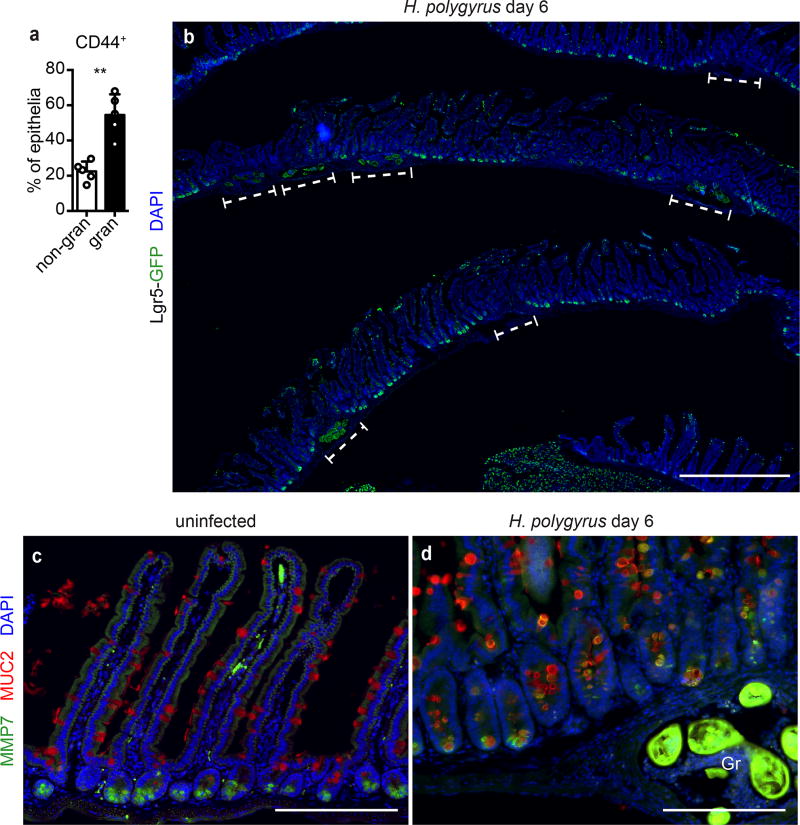
To study how intestinal crypts cope with tissue disruption, we infected Lgr5DTRGFP/+ (Lgr5-GFP) reporter mice4 with Hp. Six days after infection, larvae resided within the intestinal wall surrounded by an immune infiltrate. Crypts overlying granulomas (granuloma-associated crypts, GCs) were hyper-proliferative and enlarged (Fig. 1a–c and Extended Data Fig. 1a), as previously reported5. Strikingly, GCs lost expression of the Lgr5-GFP reporter (Fig. 1a’ and Extended Data Fig. 1b), while non-granuloma-associated crypts retained expression of Lgr5-GFP (Fig. 1a”). Olfm4, another ISC marker, was similarly repressed (Fig. 1d). In addition to loss of Lgr5 and Olfm4, the Paneth cell marker MMP7 often co-stained with the goblet cell marker MUC2 (Extended Data Fig. 1c–d), as previously recognized in helminth infections6 and other perturbations of epithelial lineage commitment7. Thus, the epithelium overlying granulomas exhibits loss of ISC markers and disruption of the ISC niche8.
Figure 1. Helminth infection induces an Lgr5− program in affected crypt epithelium.
Day 6 of H. polygyrus infection. a, Lgr5-GFP and EdU in crypts overlying (a’) and adjacent to (a”) Hp granulomas (“Gr”). n=5; scale bars, 200 µm (a), 100 µm (a’,a”). b, EdU in flow cytometry of total epithelium from granuloma (“gran”) or non-granuloma (“non-gran”) biopsies. n=5. c, Crypt area from uninfected mice, non-gran or gran of infected mice. n=123 crypts from 6 mice (uninfected), 264 (non-gran) and 183 (gran) crypts from 15 infected mice. d, Olfm4 in gran-associated (d’) or non-gran crypts (d”). n=5; scale bars, 200 µm (d), 50 µm (d’,d”). e, RNAseq of crypt epithelium from non-gran or gran biopsies. Data were filtered for ≥ 100 reads average in either group, FDR ≤ 10−4, and the 50 highest genes for fold-change are presented; high (red) and low (blue) relative expression. Orange gene names are predicted IFN targets. n=5 (non-granuloma, 25 mice total) or 4 (granuloma, 20 mice total) independently sorted samples. Unpaired, two-tailed Mann-Whitney test; mean ± S.D. (b–c). ** P < 0.01, **** P < 0.0001.
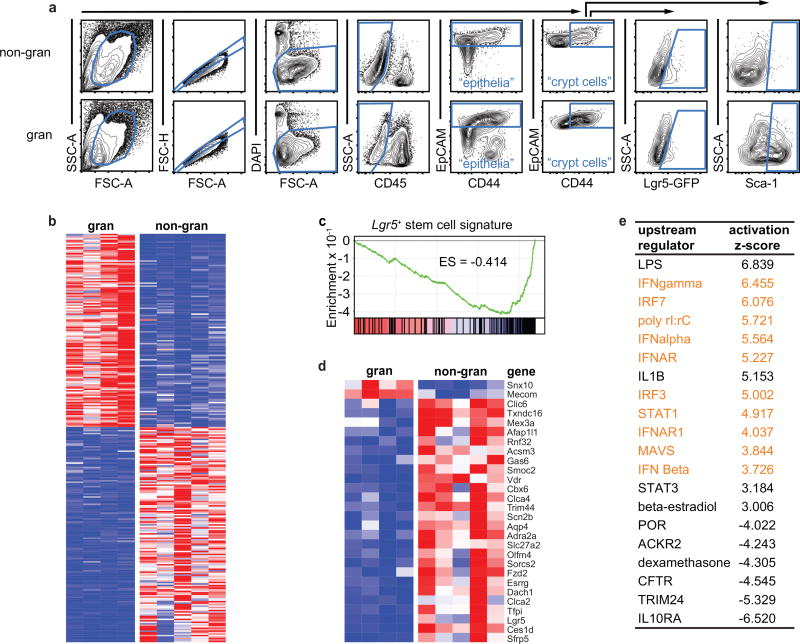
To assess response pathways within GCs, we purified crypt epithelium from granuloma punch biopsies (Extended Data Fig. 2a) and performed RNAseq analysis. We found 277 differentially expressed genes between granuloma and non-granuloma crypt biopsies (Fig. 1e, Extended Data Fig. 2b and Supplementary Table 1). In addition to Lgr5 and Olfm4, a suite of ISC signature genes9 was down-regulated in GCs (Extended Data Fig. 2c–d and Supplementary Table 2), confirming that Hp infection represses ISCs. Among the genes up-regulated in GCs were an abundance of IFN signaling targets (Fig. 1e), and pathway analysis revealed an IFN response (Extended Data Fig. 2e and Supplementary Table 2).
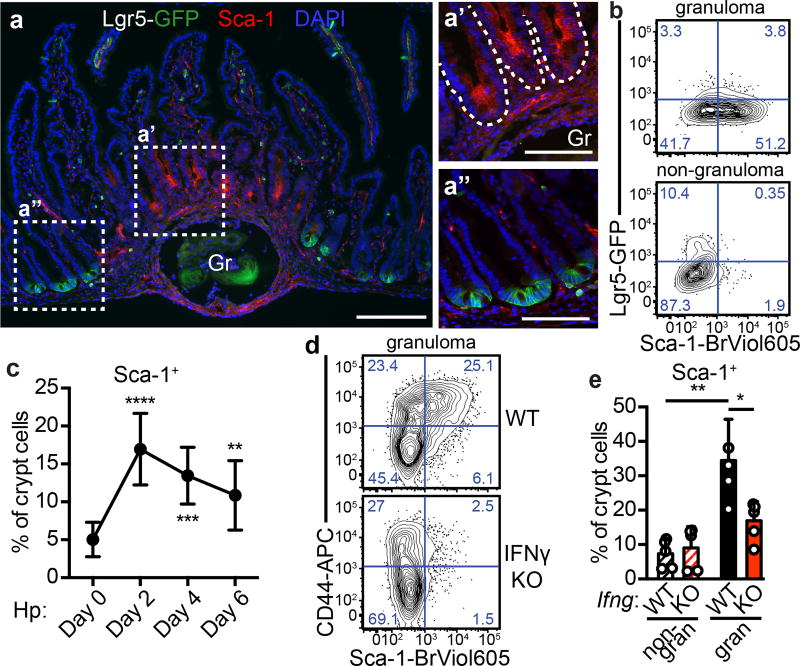
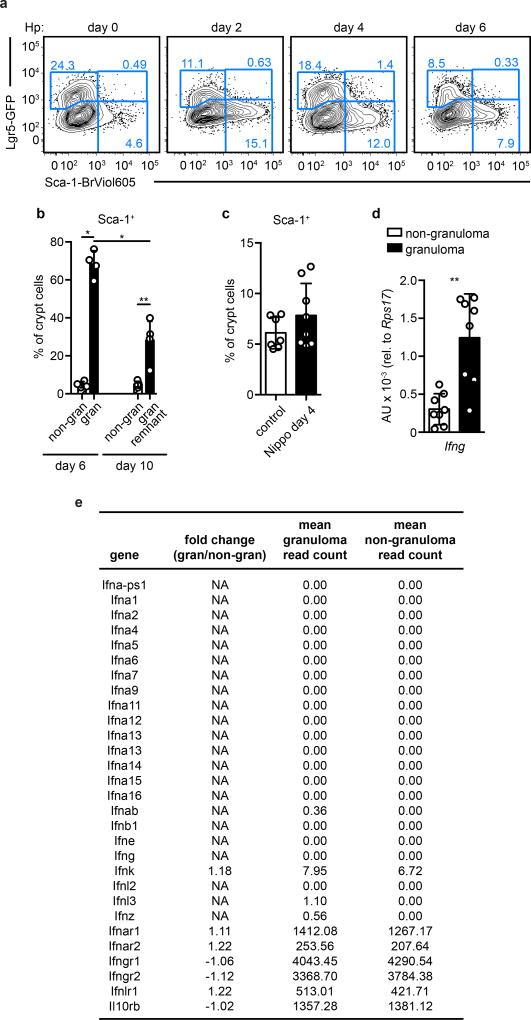
One of the most up-regulated genes was Sca-1 (Ly6a), a surface protein associated with proliferative cells, although not present in human. Sca-1 is an interferon target recognized to be induced on epithelia during colitis10, and immunofluorescence revealed that Sca-1 specifically marked Lgr5-GFP− GCs (Fig. 2a). Flow cytometry confirmed that Sca-1 was enriched in GC biopsies (Fig. 2b) and revealed that Sca-1 up-regulation occurred as early as two days after infection (Fig. 2c and Extended Data Fig. 3a). Furthermore, Sca-1 expression was distinct from Lgr5-GFP at all time points examined. As a result of this tight inverse correlation, Sca-1 was a useful marker of crypt cells responding to Hp-driven epithelial disruption. By day 10 post-infection, diminished Sca-1 expression at granuloma remnants (Extended Data Fig. 3b) indicated that resolution had commenced. Another intestinal helminth, Nippostrongylus brasiliensis, which does not invade intestinal tissue, did not induce Sca-1 expression (Extended Data Fig. 3c), suggesting a requirement for crypt disruption.
Figure 2. IFNγ mediates the helminth-induced crypt phenotype.
Day 6 of H. polygyrus infection, except as noted. a, Lgr5-GFP and Sca-1 in crypts overlying (a’) and adjacent to (a”) granulomas (“Gr”). n=5; scale bars, 200 µm (a), 100 µm (a’,a”). b, Lgr5-GFP and Sca-1 in crypt biopsies. n=4. c, Sca-1 on crypts from unfractionated epithelium at various time points. n=9 (day 0) or 8 (all others). Significance vs. day 0. d, CD44 and Sca-1 in epithelia from granuloma biopsies from IFNγ-KO mice. n=5/group. e, Cells analyzed as in (d). n=5/group. Unpaired, two-tailed Mann-Whitney test; mean ± S.D. (c, e). * P < 0.05, ** P < 0.01, *** P < 0.001, **** P < 0.0001.
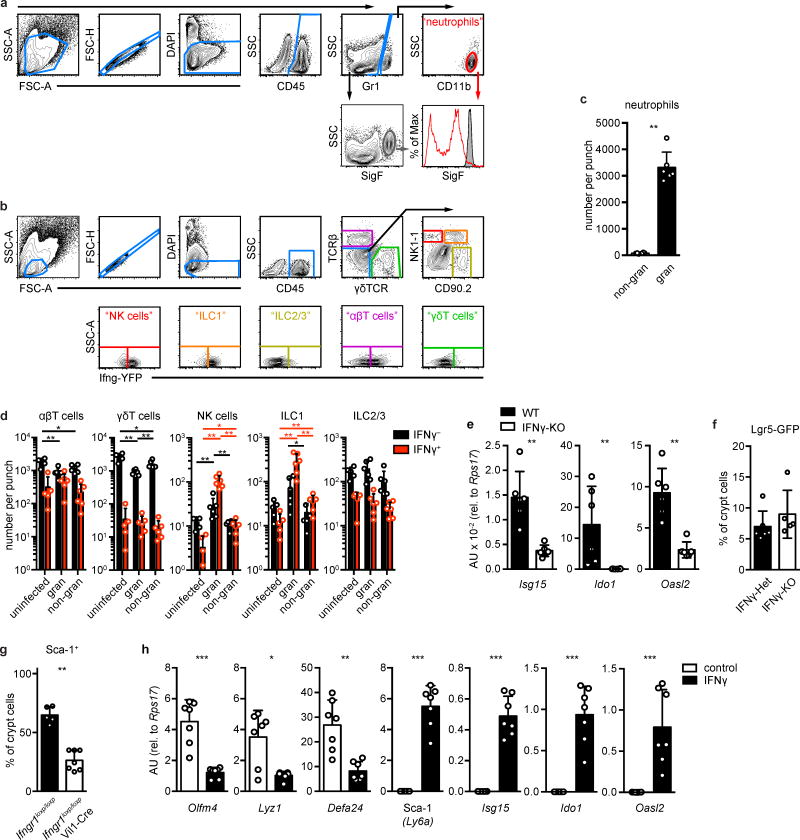
Although helminthes are typically associated with allergic immunity11, our data pointed to a role for IFN. We focused on IFNγ, because elevated transcripts of this gene were found in granulomas of infected mice (Extended Data Fig. 3d), and there was no induction of Type I and Type III IFN transcripts in GCs (Extended Data Fig. 3e). We also found large numbers of neutrophils, which are known targets of IFNγ12, and an accumulation of IFNγ+ lymphocytes in granulomas (Extended Data Fig. 4a–d). Hp infection of IFNγ-null mice showed that Sca-1 (Fig. 2d–e) and IFN target gene induction (Extended Data Fig. 4e) were dependent on IFNγ, although down-regulation of the Lgr5-GFP reporter was unchanged (Extended Data Fig. 4f). To assess the cell-autonomous effects of IFNγ on intestinal epithelia, we deleted the IFNγ receptor in intestinal epithelium and found a similar effect as with germline deletion of IFNγ (Extended Data Fig. 4g). Treating intestinal organoids with IFNγ led to transcriptional changes corresponding to those found in GCs (Extended Data Fig. 4h). Together, these data demonstrate that immune cell-derived IFNγ is a critical component of the GC response.
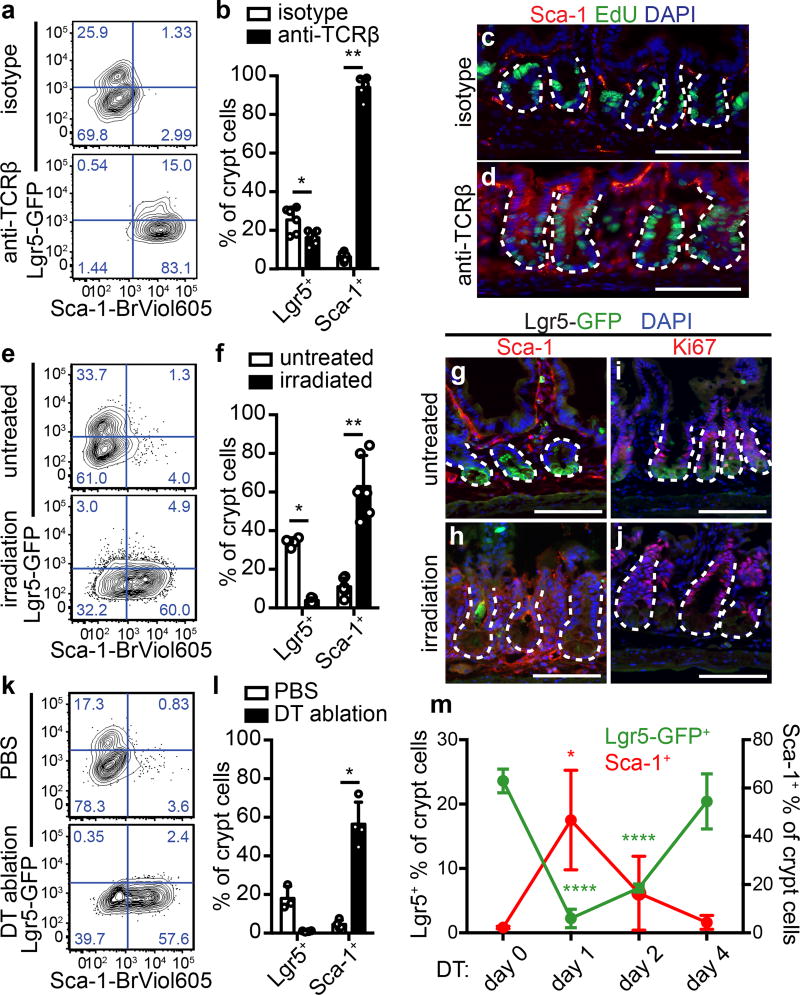
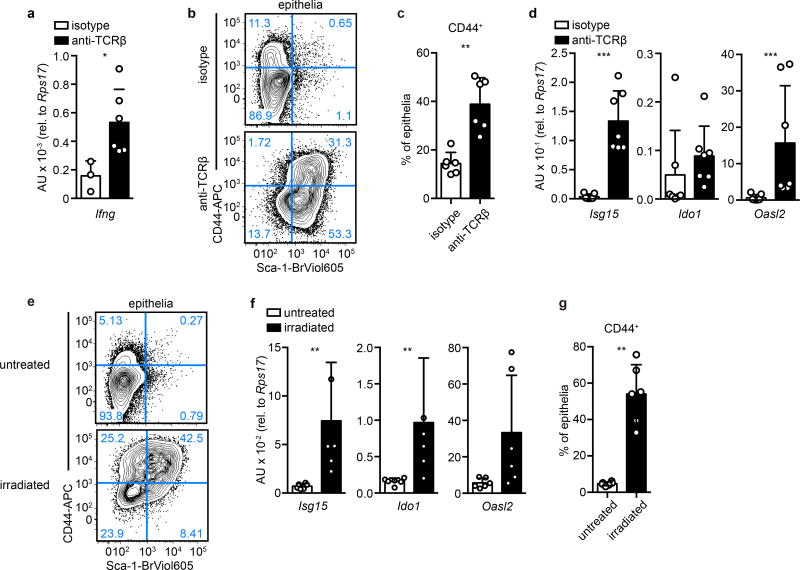
Lymphocyte activation and IFNγ production are elicited in other contexts of epithelial injury13–15. Therefore, we challenged uninfected mice with anti-TCRβ to assess the host response to immune cell activation. After 24 hours, Ifng transcript was elevated (Extended Data Fig. 5a), and the intestinal epithelium broadly resembled the Hp GC response, as evidenced by reduction of Lgr5-GFP, induction of Sca-1, increased proliferation and crypt size (Fig. 3a–d and Extended Data Fig. 5b–c), and expression of a subset of Hp-activated transcriptional targets (Extended Data Fig. 5d).
Figure 3. The crypt response to H. polygyrus is a generalized response to tissue injury.
a–d, Mice were treated with 20 µg anti-TCRβ and analyzed 24 hours later for Lgr5-GFP and Sca-1 in crypt cells (a–b) or Sca-1 and EdU (c–d). n=6/group (a–b). n=4/group; scale bars, 100 µm (c–d). e–j, Mice were treated with 10 gray irradiation and analyzed at 3 days for Lgr5-GFP and Sca-1 in crypt cells (e–h) or Lgr5-GFP and Ki67 (i–j). n=4 (Lgr5, untreated), 5 (Lgr5, irradiated), or 6 (Sca-1) (e–f). n=3/group; scale bars, 100 µm (g–j). k–m, Lgr5DTRGFP/+ mice were treated with diphtheria toxin (DT) and analyzed for Lgr5-GFP and Sca-1 in crypt cells at 24 hours (k–l) or indicated time points (m). n=3 (Lgr5, untreated), or 4 (all others) (k–l). n=3 (day 0) or 4 (days 1, 2, 4) (m). Unpaired, two-tailed Mann-Whitney test (b, f, l) or unpaired, two-tailed t tests (m); mean ± S.D. (b, f, l, m). * P < 0.05, ** P < 0.01, **** P < 0.0001.
The convergence of epithelial responses to immune cell activation following Hp infection and anti-TCRβ challenge might reflect a generalized reaction to tissue perturbation. To test this, we examined additional injury models. First, we lethally irradiated mice and analyzed them after three days, at which time Lgr5 expression is lost during regeneration16,17. We observed Sca-1 induction and an IFN response in crypt cells (Fig. 3e–h and Extended Data Fig 5e–f), as well as continued proliferation (Fig. 3i–j) and increased crypt depth (Extended Data Fig. 5g), as previously reported16.
Because irradiation is relatively non-specific, we sought to restrict cell death to the stem cell compartment by specifically ablating Lgr5-expressing cells4. Twenty-four hours after treatment of Lgr5DTRGFP/+ mice with diphtheria toxin (DT), Lgr5-GFP cells were absent, and Sca-1 was highly induced (Fig. 3k–l and Extended Data Fig. 6a–b). During recovery, Lgr5-GFP+ ISCs re-emerged and Sca-1 expression decreased to baseline levels (Fig. 3m). Notably, Lgr5+ cell ablation did not induce crypt hyperplasia (Extended Data Fig. 6c) or GC-like IFN targets (data not shown), revealing distinctions between the Sca-1 response in Lgr5 ablation and other epithelial perturbations. However, IFN activation has been noted after Lgr5+ cell ablation in tumors18. Thus, diverse insults that disturb Lgr5+ cells induce GC-like responses during regeneration.
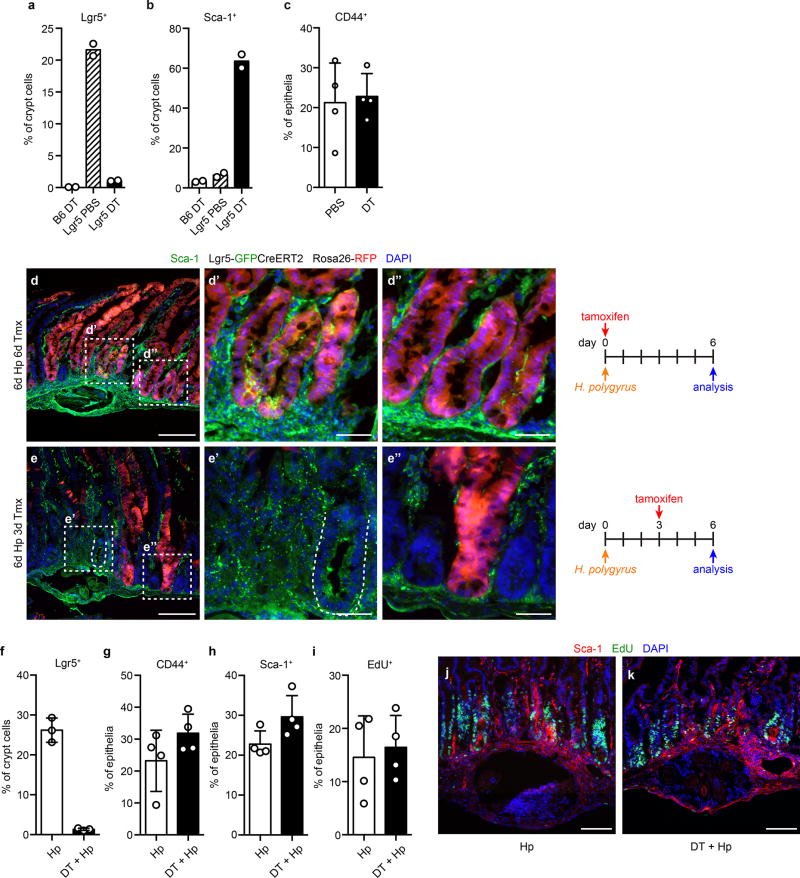
Lgr5+ cells are required for regeneration after irradiation-induced injury17. To test their necessity for the Hp-induced GC phenotype, we ablated Lgr5+ cells immediately before infection. In this setting, although we confirmed that GC cells were part of the Lgr5+ ISC lineage hierarchy (Extended Data Fig. 6d–e), crypt cell frequency, Sca-1 induction, and EdU incorporation were unaffected (Extended Data Fig. 6f–k). These data indicate that while the Hp-induced GC phenotype is mediated by ISC progeny, it can occur independently of Lgr5+ ISCs.
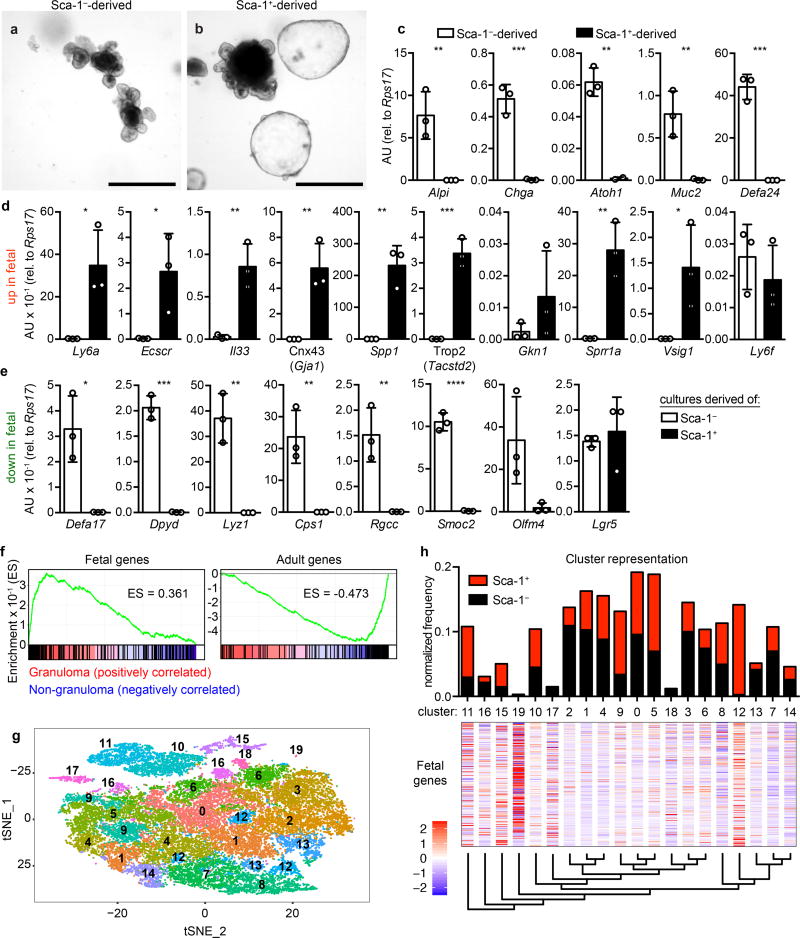
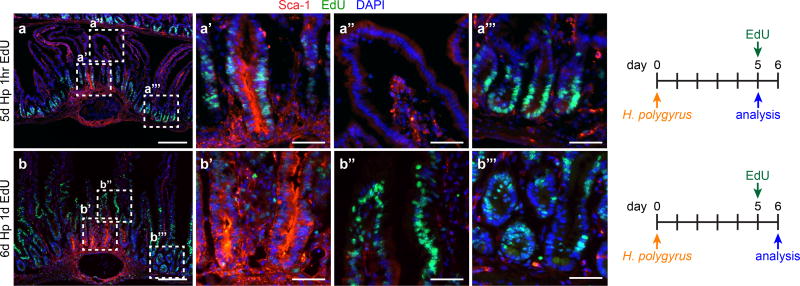
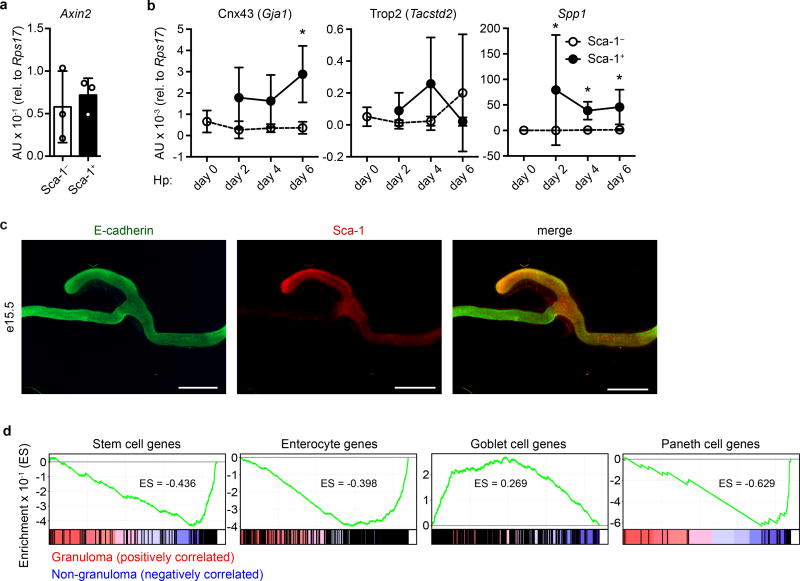
Sca-1+ GC cells were hyper-proliferative and gave rise to granuloma-associated villus epithelium (Extended Data Fig. 7a–b). To assess the generative capacity of GCs, we sorted Sca-1+ and Sca-1− crypt cells from Hp-infected mice and cultured them under standard organoid conditions. Whereas Sca-1− cells formed typical organoids (Fig. 4a), Sca-1+ cells formed large, smooth spheroids devoid of crypt budding (Fig. 4b) and were stably passaged for more than six months (data not shown). Sca-1+ spheroids lost expression of markers of differentiated epithelium (Fig. 4c), suggesting that they reflected growth of an undifferentiated cell type. Spheroids have been observed in high Wnt conditions8; however, in our studies, we did not add exogenous Wnt, and we found no difference in Axin2 expression between Sca-1+ and Sca-1− cultures (Extended Data Fig. 8a), suggesting that Wnt signaling is not hyperactive in Sca-1+ spheroids. Recent work19,20 has demonstrated that spheroids are formed from fetal epithelium. We tested expression of fetal epithelial markers and found that nearly all fetal genes assayed were highly expressed in Sca-1+ cultures (Fig. 4d–e). Like fetal cultures20, Sca-1+ spheroids were not sensitive to R-Spondin1 withdrawal (data not shown). Thus, Sca-1+ cells adopted a state in vitro that was distinct from Sca-1− cells and that highly resembled fetal intestinal epithelium.
Figure 4. Helminth-associated crypts acquire a fetal-like program.
a–e, Sorted Sca-1− (a) or Sca-1+ (b) crypt cells from H. polygyrus (Hp)-infected mice were cultured in organoid conditions and imaged after one passage (a–b), and analyzed for markers of differentiated cells (c) and fetal-derived cultures19 (d–e). n=15; scale bars, 500 µm (a–b). Derived of n=3 mice; P values are from unpaired two-tailed t tests; mean ± S.D. (c–e). f, Bulk RNAseq data (as in Fig. 1e) were analyzed by GSEA for cell signature genes19. ES, enrichment score (ES). All analyses have FDR < 10−3. n=5 (non-granuloma, 25 mice total) or 4 (granuloma, 20 mice total) independently sorted samples. g–h, Single-cell RNA sequencing from n=19,754 Sca-1− and n=6,669 Sca-1+ individually sorted crypt cells from Hp-infected mice. g, t-SNE distribution color coded to represent clusters identified independently by unsupervised hierarchical clustering. The relation of cluster identity to transcriptional signatures of mature lineages can be found in Extended Data Fig. 9. h, Sca-1− and Sca-1+ cell frequency within each cluster, normalized to the total number of cells sequenced from each population (upper panel). Normalized expression values for the fetal gene signature19 were mapped to the clusters (middle panel) and arranged per the unsupervised dendrogram of cluster relatedness (lower panel). * P < 0.05, ** P < 0.01, *** P < 0.001, **** P < 0.0001.
We sought to determine whether the fetal program was activated in vivo and found that the fetal markers Gja1 and Spp1 were up-regulated in GCs during Hp infection (Extended Data Fig. 8b). Furthermore, Sca-1 was expressed in mouse fetal intestinal epithelium at embryonic day 15.5 (Extended Data Fig. 8c). This remarkable similarity led us to re-analyze our RNAseq of GC epithelium. We found strong enrichment of the fetal signature in GC epithelium, while the adult signature was enriched in non-GCs (Fig. 4f and Supplementary Table 2). Furthermore, the signatures21 of stem cells, enterocytes, and Paneth cells, although not goblet cells, were lost in GCs (Extended Data Fig. 8d and Supplementary Table 2). Taken together, these data indicate that GCs adopt an undifferentiated state resembling the fetal epithelium during infection.
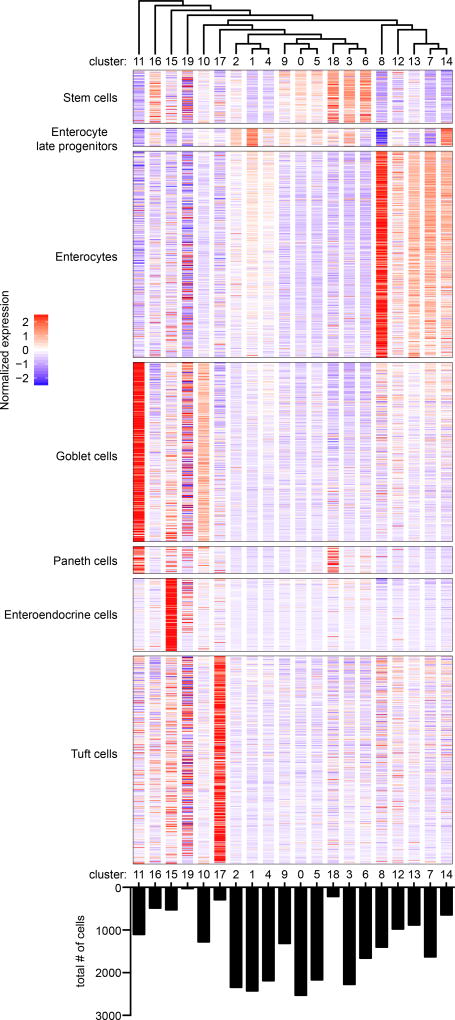
Enrichment of the goblet cell signature in GC epithelium suggested heterogeneity within the pool of Sca-1+ cells. To investigate whether a subgroup of cells underpinned the fetal signature, we performed single-cell RNA sequencing analysis of Sca-1+ and Sca-1− crypt cells. Unsupervised clustering of the merged datasets revealed that most cell clusters were composed of both Sca-1+ and Sca-1− cells (Fig. 4g–h) and, although we excluded mature epithelium, the transcriptional signature of specific lineages could be recognized in some clusters (Extended Data Fig. 9 and Supplementary Table 4). We focused on Cluster 12, which consisted almost entirely of Sca-1+ cells (98.2%). By overlying known intestinal cell type signatures19,21, we found that Cluster 12 was depleted for mature cell markers (Extended Data Fig. 9), and was strongly enriched for the fetal program (Fig. 4h and Supplementary Table 5), suggesting that this cluster represented a unique cell identity elicited by Hp infection within the larger Sca-1+ pool.
It has been postulated that intestinal crypts respond to damage by activation of reserve stem cells16,22 or reacquisition of stem-ness by differentiated progenitors23–25. Here, our use of an evolutionarily adapted parasite led to identification of a novel infection-mediated alteration of the crypt in response to injury. By monitoring the markers Lgr5-GFP and Sca-1, respectively, we found that an overlapping injury response program was engaged by other tissue-damaging agents, indicating a generalized strategy by which the intestine copes with stress. Our data identify a novel cell type arising in the damaged crypts and suggest that crypt repair repurposes aspects of fetal development in order to restore barrier integrity. Indeed, a re-activation of fetal markers has been observed in models of injury in other tissues26–28. Furthermore, a recent report by Yui et al. examining a chemical colitis model also uncovered induction of Sca-1 and a fetal signature in regenerative colonic crypts29. Yui et al. identified extracellular matrix driven activation of Yap-Taz signaling was linked to regeneration, while we found a discrete subset of Sca-1+ crypt cells associated with a fetal gene signature. Our two complementary studies suggest that induction of the fetal program may be a core response to injury in the crypt. Taken together, the helminth-induced changes in crypt epithelia that we discovered point to a repurposing of some of the functional capabilities of the developing fetal gut and highlight a novel mechanism of repair in the intestinal crypt involving infection-induced developmental plasticity.
Methods
Mice
Mice were maintained in the University of California San Francisco (UCSF) specific pathogen-free animal facility in compliance with all ethical guidelines established by the Institutional Animal Care and Use Committee and Laboratory Animal Resource Center. All experimental procedures were approved by the Laboratory Animal Resource Center at UCSF. Male and female mice aged 6–14 weeks were used for all experiments, except those analyzing fetal tissue. Lgr5DTRGFP mice were previously described4. Wild-type (C57BL/6J), Lgr5GFP-CreERT2/+ (B6.129P2-Lgr5tm1(cre/ERT2)Cle/J), Rosa26RFP/+ (B6;129S6-Gt(ROSA)26Sortm14(CAG-tdTomato)Hze/J), IFNγ reporter (B6.129S4-Ifngtm3.1Lky/J), IFNγ-null (B6.129S7-Ifngtm1Ts/J), IFNγ receptor-flox (Ifngr1loxP/loxP; C57BL/6N-Ifngr1tm1.1Rds/J), and Vil1-Cre (B6.Cg-Tg(Vil1-cre)997Gum/J) mice were from The Jackson Laboratory (Bar Harbor, Maine). For analysis of embryonic tissue, timed matings were established and the morning after plugs were recognized was considered embryonic stage e0.5. Fetal intestine was dissected at the time points indicated.
Helminth infection and treatments
Mice were infected by oral gavage with 200 H. polygyrus (Hp) L3 larvae and were killed at the indicated time points. For anti-TCRβ treatment, mice were administered 20 µg per mouse of clone H57 i.p. and analyzed 24 hours later. For irradiation, mice were exposed to 10 gray and analyzed approximately 72 hours later. For ablation of Lgr5+ cells, Lgr5DTRGFP/+ mice were administered 50 µg/kg diphtheria toxin i.p. and analyzed at the indicated time points. For determination of cell proliferation, 500 µg of 5-Ethynyl-2´-deoxyuridine (EdU) was administered i.p. 1 hour prior to sacrifice, except as in Extended Data Figure 7b, at 24 hours prior to sacrifice. For lineage tracing experiments, Lgr5GFP-CreERT2/+ Rosa26RFP/+ mice were infected with Hp and injected with 2.5 mg tamoxifen in corn oil i.p. at the indicated time points and analyzed at day 6.
Tissue preparation and flow cytometry
Preparation of intestinal tissue for flow cytometry was modified from previous work30. The duodenum was dissected, flushed extensively with cold PBS, and the mesenteric tissue was removed. For whole tissue preps, Peyer’s patches were removed and tissue was turned inside-out. For recovery of punch biopsies tissue was fileted open longitudinally. In both cases, tissue was shaken in three changes of 20 ml cold PBS and washed for 20 minutes at 37°C in two changes of 20 ml Ca2+/Mg2+-free HBSS containing 5 mM DTT, 10 mM HEPES, and 2% FCS, followed by 20 ml of Ca2+/Mg2+-replete HBSS containing 10 mM HEPES and 2% FCS. For punch biopsies, granuloma and non-granuloma tissue was dissected with a 1 mm punch tool under low-power magnification. Tissues were digested for 30 minutes at 37°C in 5 ml (whole tissue) or 2 ml (punch biopsies) Ca2+/Mg2+-replete HBSS containing 10 mM HEPES, 2% FCS, 30 µg/ml DNaseI (Roche), and 0.1 Wünsch/ml LibTM (Roche), and whole tissue was homogenized in C tubes using a gentleMACS tissue dissociator (Miltenyi). Homogenate or punch biopsies were passed through a 100 µm filter with assistance of a 3 ml syringe plunger, and enumerated for staining equivalent numbers for flow cytometry or sorting. Fc Block (anti-CD16/32), doublet exclusion, and DAPI exclusion were used in all cases. Data were acquired with a Becton Dickinson Fortessa and analyzed using FlowJo (Tree Star). Cell sorting was performed with a Beckman Coulter MoFlo XDP.
Immunofluorescence and in situ hybridization
For tissue staining in section, mice were perfused with cold 4% PFA in PBS. The proximal 10 cm of duodenum was cleaned, flushed with cold 4% PFA, and fixed in 4% PFA for 4 hours at 4°C. The tissue was cryo-protected in 30% sucrose overnight at 4°C. Samples were embedded in OCT and 8 µm sections were prepared for immunofluorescence staining. For immunohistochemistry and in situ hybridization, the samples were fixed overnight in 4% PFA, paraffin embedded, and sectioned at 5 µm for immunohistochemistry or 10 µm for in situ hybridization. For crypt area quantitation, crypts clearly above distended granuloma tissue containing visible larval worms were called as “gran” and others were called “non-gran”. Crypt area was quantitated in ImageJ. For fetal whole mount imaging, fetal intestines were fixed in 4% PFA in PBS for 3 hrs, permeabilized, and blocked for 4 hours at room temperature. Primary and secondary antibodies were incubated at 4°C overnight. Images were acquired and processed with a Leica DM5000 B or a Zeiss Axio Imager 2 and Adobe Photoshop.
In Situ Hybridization
An Olfm4 probe was designed by PCR amplifying an 898 bp sequence from total intestinal cDNA using the primers 5’-AACCTGACGGTCCGAGTAGA-3’ (forward) and 5’-TGCTGGCCTCAGTTGCATAA-3’ (reverse). Olfm4 cDNA was cloned into a pGEM-T Easy vector (Promega). Olfm4 anti-sense probes were prepared and in situ hybridization was performed as described31.
Bulk RNA sequencing
Five wild-type mice were infected with Hp and six days later 1 mm punch biopsies from granuloma and non-granuloma tissue were taken, pooled by tissue, digested, and sorted for DAPIlo CD45− EpCAM+ CD44+ crypt epithelium. RNA from six granuloma (30 mice total) and five non-granuloma (25 mice total) sorts was submitted for RNA sequencing. Two granuloma data sets were excluded due to low unique mapping rates and failure to group by tissue in principle components analysis and hierarchical clustering. The remaining data were filtered for a combination of minimum read count, false discovery rate, and fold-change comparison, as indicated in figure legends. Heat maps were generated using Morpheus (https://software.broadinstitute.org/morpheus/) and upstream regulators were determined using Ingenuity Pathways Analysis (Qiagen). Predicted mouse IFN targets were determined using Interferome (http://interferome.its.monash.edu.au/interferome) with default settings. GSEA analysis32 was done with 1000 permutations by gene set. The expression dataset was generated by filtering out low abundance genes. Hallmark gene sets were obtained from the Broad MSigDB33. Additional gene sets were generated from published datasets9,19,21. The gene-filtered expression data are available in Supplementary Table 1 and the GSEA analysis results and input files are available in Supplementary Table 2.
Single cell RNA sequencing
Sca-1+ or Sca-1− crypt cells were sorted from one mouse infected with Hp for 6 days. The two resulting cell suspensions (~70,000 cells each) were submitted as separate samples to be barcoded for single cell RNAseq using the Chromium Controller (10× Genomics) and the Single Cell 3’ Library Kit v2 (PN-120236/37/62). Resulting libraries were sequenced on a HiSeq 4000 (Illumina) using HiSeq 4000 PE Cluster Kit (PN PE-410-1001) with HiSeq 4000 SBS Kit (150 cycles, PN FC-410-1002), with one sample being loaded per sequencing lane. 19,834 Sca-1− cells (approximately 15,000 reads per cell) and 7,354 Sca1+ cells (approximately 40,000 reads per cell) were successfully barcoded and their transcriptomes sequenced. Raw sequencing data were processed for initial QC analysis and alignment by our sequencing core (Institute of Human Genetics, UCSF) using Cell Ranger software. Further analysis of differential gene expression and unsupervised hierarchical clustering were performed using the Seurat package (v2.0)34,35. Samples were merged after read depth correction and the combined dataset was filtered to exclude cells expressing less than 200 genes. Additionally, genes detected in less than 10 cells were removed from the analysis. Variable gene expression was assessed in the filtered dataset after correction for mitochondrial gene expression. Linear reduction of the data was performed using principle components analysis, focusing on the first 15 principle components determined to be significant to explain variation in the dataset via a large permutation test. Cells were clustered using the function FindClusters with a resolution parameter of 2.0. Graphical representation was achieved using the t-SNE algorithm, upon which the independently identified clusters were color-coded. Published lists19,21 of markers for various intestinal crypt cell types were visualized on the clusters with the DoHeatmap function of the Seurat package. For analysis of cluster contribution by Sca-1+ or Sca-1− crypt cells (Fig. 4h), cell numbers were first normalized to the total number sequenced for each population. We considered Cluster 19 to be an aberrant cluster due to low cell number (33 of 26,423 total), enrichment for multiple intestinal lineages, and isolation in t-SNE analysis. The mean normalized expression values by cluster are available in Supplementary Table 3 and mean normalized expression values presented in the heat maps are available in Supplementary Table 4. The hypergeometric test for enrichment of the fetal gene program signature within each cluster is available in Supplementary Table 5.
Antibodies
The following antibodies (BioLegend) were used for flow cytometry: CD45 (30-F11), CD326/EpCAM (G8.8), CD44 (IM7), Sca-1 (D7), TCRβ (H57), γδTCR (GL3), NK1.1 (PK136), CD90.2 (53-2.1), CD11b (M1/70), Gr1 (RB6-8C5). For immunofluorescence staining in section, the follow antibodies were used: GFP (GFP-1020, Aves; ab13790, Abcam), Ki67 (Sp6, Thermo Fischer Scientific), E-cadherin (24E10, Cell Signaling Technology), Sca-1 (e13-161.7, Biolegend), Muc2 (SC-15334, Santa Cruz Biotechnology), Mmp7 (AF2967, R&D Systems). EdU was detected using Click-iT Plus EdU Assay Kit (ThermoFisher).
Organoid culture
Cultures from sorted single cells were established as described36. Briefly, CD45− EpCAM+ CD44+ Sca-1+ and Sca-1− cells were sorted into PBS containing 10% FCS. Cells were re-suspended in GFR, Phenol-free Matrigel (Fisher) supplemented with 500 ng/ml EGF (Sigma-Aldrich), 1 µg/ml Noggin (R&D Sytems), 10 µM Jagged-1 peptide (Anaspec), and 10% R-Spondin1 Conditioned Medium (Gift of Noah Shroyer, Baylor College of Medicine). Fifty µl of Matrigel containing cells were plated in a 24-well cell culture plate, and left to set at 37°C for 15 minutes. Pre-warmed 37°C ENR Medium (Advanced DMEM/F12, 10 mM HEPES, 1X GlutaMAX, 1% Pen/Strep, 1X N-2 Supplement, 1X B-27 Supplement, 1 mM N-Acetylcysteine, 100 ng/ml Noggin, 50 ng/ml EGF, 5% R-Spondin1 Conditioned Media) with 2.5 µM CHIR99021, 2.5 µM Thiazovinin, and 1 µM Jagged-1 peptide was overlaid. Cells were cultured at 37°C. After 3 days, the medium was exchanged for ENR medium without CHIR99021, Thiazovinin, or Jagged-1 peptide. Cultures were passaged after 8 days and then every 5–7 days thereafter with growth factor-free Matrigel. Cultures were typically analyzed at the end of the first passage by imaging and qPCR. Some qPCR experiments were conducted on established cultures, such as in Figure 4c–e. For in vitro IFNγ treatment, wild type organoid lines were prepared from whole crypts and treated 3 days after passage by exchanging the standard organoid medium with fresh organoid medium containing 5 ng/ml IFNγ (485-MI, R&D Systems). Twenty-four hours later, organoids were harvested by centrifugation, aspirating the media and Matrigel, and lysed using RLT buffer (Qiagen).
Quantitative PCR
RNA from 5 mm whole tissue (after QIAshredder), sorted cells, or organoids was extracted using RNeasy Mini or Micro Kits (Qiagen). cDNA was synthesized with High Capacity cDNA Reverse Transcription Kits (Applied Biosystems). qPCR reactions were performed using Power SYBR Green (Invitrogen) on an Applied Biosystems StepOnePlus for whole tissue, or iTaq Universal SYBR Green Supermix (Bio Rad) in 384-well plates on a QuantStudio 6 Flex Real-Time PCR System (Thermo Fisher Scientific) for sorted cells and organoids. Primers used for qPCR are listed in Supplementary Table 6.
Statistics
Except in Extended Data Figure 4h, all data points are biological replicates, randomly assigned without investigator blinding. All experiments were independently replicated with similar results at least twice, except in Extended Data Figure 6a–b and the single-cell RNA sequencing experiment, which were both performed once. No data were excluded, except in the bulk RNAseq experiment, as noted in the Methods. No statistical methods were used to predetermine sample size and differences in intra-sample variances were present. Statistical significance was determined in Prism (GraphPad Software) using an unpaired, two-tailed Mann-Whitney test without multiple comparisons correction, except for the use of unpaired, two-tailed t-tests in Figure 3m and Figure 4c–e, as noted in the legend. Bar charts indicate the mean of samples and error bars represent ± S.D. of the mean. * P< 0.05, ** P < 0.01, *** P < 0.001, **** P < 0.0001. Hypergeometric tests were performed using GeneProf37.
Data availability
The RNA sequencing data reported in this study are available at the Gene Expression Omnibus under accession codes GSE97405 (bulk) and GSE108233 (single-cell). The source data for all charts are available online.
Extended Data
Extended Data Figure 1. Helminth infection alters the crypt and intestinal stem cell niche.
Day 6 of H. polygyrus infection. a, Flow cytometry of CD44+ epithelium from non-gran or gran biopsies. n=5. b, Lgr5-GFP staining in the duodenum. Granulomas are indicated by the dashed brackets. In some granulomas, the helminth larva is recognizable by autofluorescence. The presence of rare Lgr5-GFP negative crypts is likely due to a sectioning artifact. Representative of n=3. Scale bar represents 1 mm. c–d, MMP7 and MUC2 staining in normal duodenum or duodenum from mice infected with H. polygyrus. Gr, granuloma. Representative of n=5. Scale bars represent 200 µm. Unpaired, two-tailed Mann-Whitney test; mean ± S.D. (a). ** P < 0.01.
Extended Data Figure 2. RNAseq analysis of granuloma-associated crypt epithelium.
a, Representative gating example of epithelia, crypt cells, Lgr5-GFP, and Sca-1 in biopsied tissue 6 days after H. polygyrus infection. Unfractionated tissue preps (as in Extended Data Fig. 3a) were gated similarly. b–e, Crypt epithelium was sorted from granuloma and non-granuloma biopsies and subjected to RNAseq analysis as indicated in the Methods. b, The data were filtered for ≥ 100 reads average in either group, false discovery rate ≤ 0.05, and fold-change comparison of ≥ 2. The 277 genes that passed were compiled into a heat map demonstrating high (red) and low (blue) relative expression. c, GSEA for Lgr5+ signature genes9. FDR < 0.01. ES, enrichment score. d, Lgr5+ intestinal stem cell signature genes9 were cross-referenced to the RNAseq data set. Data were filtered as in (b) except no fold-change requirement was applied. e, The unfiltered RNAseq data set was analyzed for upstream regulators using Ingenuity Pathways Analysis. The activation Z-score indicates the extent of enrichment of targets within the RNAseq dataset downstream of the indicated regulator, with a positive score indicating enrichment. IFN related pathways are highlighted in orange.
Extended Data Figure 3. Sca-1 is expressed on granuloma crypt epithelium and IFNγ is present in granulomas.
a, Lgr5-GFP and Sca-1 expression on crypt cells from unfractionated duodenum preps of Lgr5-GFP mice were analyzed after H. polygyrus (Hp) infection. Representative of n=5 (day 0) or 4 (days 2, 4, 6). b, Sca-1 expression on crypt cells from biopsies from mice 6 or 10 days after infection with Hp. n=4 (day 6) or 5 (day 10). c, Sca-1 expression on crypt cells from unfractionated duodenum preps of mice 4 days after infection with N. brasiliensis (Nippo). n=7 (controls) or 8 (Nippo). d, Non-granuloma or granuloma biopsies from WT mice were analyzed for Ifng transcript. n=8. e, Fold change and read counts of IFN and IFN receptor genes from RNAseq performed as in Extended Data Fig. 2b with no filter applied. “NA” results from division by zero. Unpaired, two-tailed Mann-Whitney test; mean ± S.D. (b–d). * P < 0.05, ** P < 0.01.
Extended Data Figure 4. IFNγ produced by Hp-responsive immune cells drives the granuloma gene signature.
a–f, Mice were infected with H. polygyrus (Hp) and analyzed at day 6, unless otherwise indicated. a–b, Representative gating example of neutrophils (a) and NK cells, ILC1, ILC2/3, αβ T cells, and γδ T cells (b). c, Neutrophils were enumerated from non-granuloma (“non-gran”) or granuloma (“gran”) biopsies. n=6. d, Ifng reporter mice were untreated (uninfected) or infected (gran, non-gran) with Hp and analyzed 5–6 days later for hematopoietic (CD45+) populations: NK cells, ILC1, ILC2/3, αβ T cells, γδ T cells. No reporter signal was seen in non-lymphoid populations. n=5 (uninfected) or 6 (gran, non-gran). e, Crypt cells were sorted from granuloma biopsies of IFNγ-null (KO) mice and analyzed for the indicated transcripts. n=6/group. f, Lgr5-GFP mice were bred to IFNγ-KO mice and analyzed for Lgr5-GFP expression in crypt epithelia from granuloma biopsies. n=6 (Het) or 5 (KO). g, Ifngr1loxp/loxp mice were bred to Vil1-Cre mice and analyzed for Sca-1 expression in crypt epithelia from granuloma biopsies. n=5 (Ifngr1loxp/loxp) or 7 (Ifngr1loxp/loxp;Vil1-Cre). h, Wild type organoids were treated with 5 ng/ml IFNγ for 24 hours and analyzed for the indicated transcripts. n=7 cultures per group. Unpaired, two-tailed Mann-Whitney test; mean ± S.D. (c–h). * P < 0.05, ** P < 0.01, *** P < 0.001.
Extended Data Figure 5. Inflammation via immune cell activation and irradiation induces granuloma-like epithelial responses.
a–d, Mice were treated with 20 µg isotype antibody or anti-TCRβ (H57) and analyzed 24 hours later. a, Unfractionated tissue analyzed for Ifng transcript. n=3 (isotype) or 6 (anti-TCRβ). b, Total epithelium was analyzed for CD44 and Sca-1. Representative of n=6/group. c, Epithelium was assessed for crypt size by flow cytometry using frequency of CD44. n=6/group. d, Crypt cells were sorted and analyzed for the indicated transcripts. n=7/group. e–g, Mice were untreated or subjected to 10 gray irradiation and analyzed 3 days later. e, CD44 and Sca-1 expression on total epithelium. Representative of n=6/group. f, Crypt cells were sorted and analyzed for the indicated transcripts. n=6/group. g, Frequency of CD44+ crypt cells among total epithelium. n=6/group. Unpaired, two-tailed Mann-Whitney test; mean ± S.D. (a, c, d, f, g). * P < 0.05, ** P < 0.01, *** P < 0.001.
Extended Data Figure 6. Granuloma crypt epithelium arises from pre-existing Lgr5+ cells but does not require Lgr5+ cells.
a–c, Lgr5DTRGFP/+ (Lgr5) or wild-type (B6) mice were treated with diphtheria toxin (DT) and analyzed 1 day later for Lgr5-GFP (a), Sca-1 (b), or frequency of crypt cells among total epithelium (c). n=2/group (a,b) or 4/group (c). d–e, Lineage tracing of Lgr5+ precursors and Sca-1 staining. Lgr5GFP-CreERT2/+ Rosa26RFP/+ mice were administered 2.5 mg tamoxifen either immediately prior to (d) or 3 days after (e) infection with H. polygyrus (Hp). Mice were analyzed at day 6. Scale bars represent 200 µm (d,e) or 50 µm (d’,d”,e’,e’’). Representative of n=3 (d) or n=2 (e). f–k, Lgr5DTRGFP/+ mice were treated with DT immediately prior to infection with Hp and analyzed by flow cytometry at day 1 for Lgr5-GFP (f), or at day 6 for CD44 (g), Sca-1 (h), and EdU (i) in epithelial cells from granuloma biopsies. n=3/group (f) or 4/group (g–i). j–k, Sca-1 and EdU detection. Scale bars represent 100 µm. Representative of n=3. Mean ± S.D. (c, f–i).
Extended Data Figure 7. Granuloma crypt epithelium contributes to epithelial turnover.
a–b, WT mice were injected with EdU at day 5 of infection and analyzed after 1 hour (a) or 24 hours (b). Scale bars represent 200 µm (a–b) or 50 µm (a’–b’’’). Representative of n=4 (day 5) or n=6 (day 6).
Extended Data Figure 8. Granuloma crypt epithelium activates a fetal-like program and exhibits altered differentiation.
a, Material from the cultures described in Fig. 4a–b was analyzed for Axin2 transcript. Cultures derived of n=3 mice. b, Sca-1+ or Sca-1− crypt cells were sorted from mice infected with H. polygyrus for the indicated times and analyzed for fetal transcripts. n=5 (Sca-1− day 0), or 4 (all others). c, Whole mount embryonic day 15.5 (e15.5) fetal intestine was fixed and stained for Sca-1 and E-cadherin. Representative of n=3 embryonic day 15.5–16.5 fetuses. Scale bar represents 1 mm. d, Bulk RNAseq data (as in Fig. 1e) were analyzed by Gene Set Enrichment Analysis for intestinal epithelial signature genes21. Enrichment score (ES) is indicated and all analyses have FDR < 10−3. n=5 (non-granuloma, 25 mice total) or 4 (granuloma, 20 mice total) independently sorted samples. Unpaired, two-tailed Mann-Whitney test; mean ± S.D. (a–b). * P < 0.05.
Extended Data Figure 9. Markers of adult intestinal cell types in single cell analysis of Sca-1+ and Sca-1− crypt epithelium.
Clusters identified by unsupervised hierarchical clustering were arranged per the unsupervised dendrogram of cluster relatedness (upper panel) and normalized expression values for intestinal cell type gene signatures21 were displayed as a heat map in each cluster (middle panel). The total number of cells in each cluster are shown (lower panel).
Supplementary Material
Acknowledgments
We thank M. Consengco, R. D’Urso, J. Ming, A. Rathnayake, N. Wang, and Z. Wang for technical expertise, the UCSF Institute of Human Genetics Core and Functional Genomics Core for performing the RNAseq experiments, and members of the Klein and Locksley labs for discussions. We also thank K. Lindquist for advice with GSEA analysis. This work was supported by the National Institutes of Health (AI026918, AI030663, and U01DK103147 from the Intestinal Stem Cell Consortium – a collaborative research project funded by the National Institute of Diabetes and Digestive and Kidney Diseases and the National Institute of Allergy and Infectious Diseases), the Howard Hughes Medical Institute (HHMI), the California Institute for Regenerative Medicine (RN3-06525), and the Sandler Asthma Basic Research Center at the University of California, San Francisco. A.K.S. is an HHMI Fellow. Y.M.N. was awarded a Genentech Graduate Fellowship in 2014.
Footnotes
Supplementary Information is linked to the online version of the paper at www.nature.com/nature.
Author Contributions
Y.M.N. and A.K.S. jointly conceived the study and designed, performed, and interpreted histology, cytometry, transcriptomic, and culture experiments. P.M. performed computational analysis of the single-cell transcriptomic experiment. A.K.M.R. and T.A.L. performed and interpreted histology experiments. F.J.dS. contributed essential reagents. O.D.K. and R.M.L. directed the study and wrote the manuscript with Y.M.N. and A.K.S.
F.J.dS. is an employee of Genentech, Inc. and owns shares of Roche.
References
- 1.Karin M, Clevers H. Reparative inflammation takes charge of tissue regeneration. Nature. 2016;529:307–315. doi: 10.1038/nature17039. [DOI] [PMC free article] [PubMed] [Google Scholar]
- 2.Maizels RM, et al. Immune modulation and modulators in Heligmosomoides polygyrus infection. Exp. Parasitol. 2012;132:76–89. doi: 10.1016/j.exppara.2011.08.011. [DOI] [PMC free article] [PubMed] [Google Scholar]
- 3.Barker N, et al. Identification of stem cells in small intestine and colon by marker gene Lgr5. Nature. 2007;449:1003–7. doi: 10.1038/nature06196. [DOI] [PubMed] [Google Scholar]
- 4.Tian H, et al. A reserve stem cell population in small intestine renders Lgr5-positive cells dispensable. Nature. 2011;478:255–9. doi: 10.1038/nature10408. [DOI] [PMC free article] [PubMed] [Google Scholar]
- 5.Ferguson A, Jarrett EE. Hypersensitivity reactions in small intestine. I Thymus dependence of experimental ‘partial villous atrophy’. Gut. 1975;16:114–7. doi: 10.1136/gut.16.2.114. [DOI] [PMC free article] [PubMed] [Google Scholar]
- 6.Kamal M, et al. Paneth and intermediate cell hyperplasia induced in mice by helminth infections. Parasitology. 2002;125:275–281. doi: 10.1017/s0031182002002068. [DOI] [PubMed] [Google Scholar]
- 7.VanDussen KL, et al. Notch signaling modulates proliferation and differentiation of intestinal crypt base columnar stem cells. Development. 2012;139:488–97. doi: 10.1242/dev.070763. [DOI] [PMC free article] [PubMed] [Google Scholar]
- 8.Sato T, et al. Paneth cells constitute the niche for Lgr5 stem cells in intestinal crypts. Nature. 2011;469:415–418. doi: 10.1038/nature09637. [DOI] [PMC free article] [PubMed] [Google Scholar]
- 9.Muñoz J, et al. The Lgr5 intestinal stem cell signature: robust expression of proposed quiescent ‘+4’ cell markers. EMBO J. 2012;31:3079–91. doi: 10.1038/emboj.2012.166. [DOI] [PMC free article] [PubMed] [Google Scholar]
- 10.Flanagan K, et al. Intestinal epithelial cell up-regulation of LY6 molecules during colitis results in enhanced chemokine secretion. J. Immunol. 2008;180:3874–3881. doi: 10.4049/jimmunol.180.6.3874. [DOI] [PubMed] [Google Scholar]
- 11.Grencis RK. Immunity to helminths: Resistance, regulation, and susceptibility to gastrointestinal nematodes. Annu. Rev. Immunol. 2015;33:201–225. doi: 10.1146/annurev-immunol-032713-120218. [DOI] [PubMed] [Google Scholar]
- 12.Amulic B, Cazalet C, Hayes GL, Metzler KD, Zychlinsky A. Neutrophil function: From mechanisms to disease. Annu. Rev. Immunol. 2012;30:459–489. doi: 10.1146/annurev-immunol-020711-074942. [DOI] [PubMed] [Google Scholar]
- 13.Miura N, et al. Anti-CD3 induces bi-phasic apoptosis in murine intestinal epithelial cells: possible involvement of the Fas/Fas ligand system in different T cell compartments. Int. Immunol. 2005;17:513–522. doi: 10.1093/intimm/dxh231. [DOI] [PubMed] [Google Scholar]
- 14.Sollid LM, Jabri B. Triggers and drivers of autoimmunity: lessons from coeliac disease. Nat. Rev. Immunol. 2013;13:294–302. doi: 10.1038/nri3407. [DOI] [PMC free article] [PubMed] [Google Scholar]
- 15.Zhou P, Streutker C, Borojevic R, Wang Y, Croitoru K. IL-10 modulates intestinal damage and epithelial cell apoptosis in T cell-mediated enteropathy. Am. J. Physiol. Gastrointest. Liver Physiol. 2004;287:G599–604. doi: 10.1152/ajpgi.00063.2004. [DOI] [PubMed] [Google Scholar]
- 16.Yan KS, et al. The intestinal stem cell markers Bmi1 and Lgr5 identify two functionally distinct populations. Proc. Natl. Acad. Sci. 2011;109:466–471. doi: 10.1073/pnas.1118857109. [DOI] [PMC free article] [PubMed] [Google Scholar]
- 17.Metcalfe C, Kljavin NM, Ybarra R, de Sauvage FJ. Lgr5+ stem cells are indispensable for radiation-induced intestinal regeneration. Cell Stem Cell. 2014;14:149–159. doi: 10.1016/j.stem.2013.11.008. [DOI] [PubMed] [Google Scholar]
- 18.Melo F, de SE, et al. A distinct role for Lgr5(+) stem cells in primary and metastatic colon cancer. Nature. 2017;543:676–680. doi: 10.1038/nature21713. [DOI] [PubMed] [Google Scholar]
- 19.Mustata RC, et al. Identification of Lgr5-independent spheroid-generating progenitors of the mouse fetal intestinal epithelium. Cell Rep. 2013;5:421–32. doi: 10.1016/j.celrep.2013.09.005. [DOI] [PubMed] [Google Scholar]
- 20.Fordham RP, et al. Transplantation of expanded fetal intestinal progenitors contributes to colon regeneration after injury. Cell Stem Cell. 2013;13:734–44. doi: 10.1016/j.stem.2013.09.015. [DOI] [PMC free article] [PubMed] [Google Scholar]
- 21.Haber AL, et al. A single-cell survey of the small intestinal epithelium. Nature. 2017;551:333–339. doi: 10.1038/nature24489. [DOI] [PMC free article] [PubMed] [Google Scholar]
- 22.Asfaha S, et al. Krt19(+)/Lgr5(−) cells are radioresistant cancer-initiating stem cells in the colon and intestine. Cell Stem Cell. 2015;16:627–38. doi: 10.1016/j.stem.2015.04.013. [DOI] [PMC free article] [PubMed] [Google Scholar]
- 23.van Es JH, et al. Dll1+ secretory progenitor cells revert to stem cells upon crypt damage. Nat. Cell Biol. 2012;14:1099–1104. doi: 10.1038/ncb2581. [DOI] [PMC free article] [PubMed] [Google Scholar]
- 24.Tetteh PW, et al. Replacement of lost Lgr5-positive stem cells through plasticity of their enterocyte-lineage daughters. Cell Stem Cell. 2016;18:203–13. doi: 10.1016/j.stem.2016.01.001. [DOI] [PubMed] [Google Scholar]
- 25.Buczacki SJA, et al. Intestinal label-retaining cells are secretory precursors expressing Lgr5. Nature. 2013;495:65–69. doi: 10.1038/nature11965. [DOI] [PubMed] [Google Scholar]
- 26.Fernandez Vallone V, et al. Trop2 marks transient gastric fetal epithelium and adult regenerating cells after epithelial damage. Development. 2016;143:1452–63. doi: 10.1242/dev.131490. [DOI] [PMC free article] [PubMed] [Google Scholar]
- 27.Gadye L, et al. Injury activates transient olfactory stem cell states with diverse lineage capacities. Cell Stem Cell. 2017;21:775–790.e9. doi: 10.1016/j.stem.2017.10.014. [DOI] [PMC free article] [PubMed] [Google Scholar]
- 28.Lin B, et al. Injury induces endogenous reprogramming and dedifferentiation of neuronal progenitors to multipotency. Cell Stem Cell. 2017;21:761–774.e5. doi: 10.1016/j.stem.2017.09.008. [DOI] [PMC free article] [PubMed] [Google Scholar]
- 29.Yui S, et al. YAP/TAZ-dependent reprogramming of colonic epithelium links ECM remodeling to tissue regeneration. Cell Stem Cell. 2018;22:35–49. doi: 10.1016/j.stem.2017.11.001. [DOI] [PMC free article] [PubMed] [Google Scholar]
- 30.Goodyear AW, Kumar A, Dow S, Ryan EP. Optimization of murine small intestine leukocyte isolation for global immune phenotype analysis. J. Immunol. Methods. 2014;405:97–108. doi: 10.1016/j.jim.2014.01.014. [DOI] [PubMed] [Google Scholar]
- 31.Gregorieff A, Clevers H. Current Protocols in Stem Cell Biology. John Wiley & Sons, Inc; 2015. pp. 2F.1.1–2F.1.11. [DOI] [PubMed] [Google Scholar]
- 32.Subramanian A, et al. Gene set enrichment analysis: a knowledge-based approach for interpreting genome-wide expression profiles. Proc. Natl. Acad. Sci. U. S. A. 2005;102:15545–50. doi: 10.1073/pnas.0506580102. [DOI] [PMC free article] [PubMed] [Google Scholar]
- 33.Liberzon A, et al. The molecular signatures database (MSigDB) hallmark gene set collection. Cell Syst. 2015;1:417–425. doi: 10.1016/j.cels.2015.12.004. [DOI] [PMC free article] [PubMed] [Google Scholar]
- 34.Macosko EZ, et al. Highly parallel genome-wide expression profiling of individual cells using nanoliter droplets. Cell. 2015;161:1202–1214. doi: 10.1016/j.cell.2015.05.002. [DOI] [PMC free article] [PubMed] [Google Scholar]
- 35.Satija R, Farrell JA, Gennert D, Schier AF, Regev A. Spatial reconstruction of single-cell gene expression data. Nat. Biotechnol. 2015;33:495–502. doi: 10.1038/nbt.3192. [DOI] [PMC free article] [PubMed] [Google Scholar]
- 36.Mahe MM, et al. Establishment of gastrointestinal epithelial organoids. Curr. Protoc. Mouse Biol. 2013;3:217–40. doi: 10.1002/9780470942390.mo130179. [DOI] [PMC free article] [PubMed] [Google Scholar]
- 37.Halbritter F, Vaidya HJ, Tomlinson SR. GeneProf: analysis of high-throughput sequencing experiments. Nat. Methods. 2011;9:7–8. doi: 10.1038/nmeth.1809. [DOI] [PubMed] [Google Scholar]
Associated Data
This section collects any data citations, data availability statements, or supplementary materials included in this article.
Supplementary Materials
Data Availability Statement
The RNA sequencing data reported in this study are available at the Gene Expression Omnibus under accession codes GSE97405 (bulk) and GSE108233 (single-cell). The source data for all charts are available online.


