Abstract
Diabetic retinopathy (DR) remains the leading cause of visual loss in working age adults in the United States and other developed countries worldwide. Previous studies have reported hemodynamic changes in the diabetic eye that precede clinically evident pathological alterations of the retinal microvasculature. There exists a pressing need for new methods to allow greater understanding of these early hemodynamic changes that occur in DR. In the current study, we propose a noninvasive method for the assessment of hemodynamics around the fovea (a region of the eye of paramount importance for vision). The proposed methodology combines adaptive optics scanning laser ophthalmoscopy and computational fluid dynamics modeling and simulation.
Our preliminary results indicate that the technique presented here is feasible for the assessment of hemodynamics in the foveal region of the eye and, moreover, that it is capable of detecting differences in hemodynamics between eyes that may be associated with DR status. We believe that the proposed methodology has the potential to become a useful tool for the evaluation of human retinal hemodynamics in a clinical context.
I. Introduction
Diabetic retinopathy (DR) is the most common vascular complication in diabetic patients. The chronic hyperglycemic state of diabetes leads to pathological alterations of the retinal microvascular structures and blood flow abnormalities. Currently, DR remains the leading cause of visual loss in working age adults in the United States and other developed countries worldwide.
The fovea centralis is the central area of the retina responsible for sharp central vision and visual detail, and nourished in part by a network of small retinal capillaries. This foveal capillary network provides a supply of nutrients and oxygen and disposes of cellular byproducts to maintain good visual function. However, this network is compromised in many diabetic patients by chronic hyperglycemia, leading to structural alterations in the capillaries and changes in blood flow even early in diabetes. Over the long term, these changes can lead to substantial, sometimes irreversible vision loss in diabetic patients. Given the visual importance of the parafoveal capillary network, it may be essential to be able to visualize and assess subtle alterations of retinal vasculature and early pathologic changes even before visual loss may occur. Current available, standard retinal imaging techniques, such as optical coherence tomography (OCT), color fundus photography or fluorescein angiography (FA) are widely used to provide information on healthy and diseased vascular structures. However, these technologies provide limited resolution to visualize the capillary network, or involve the invasive use of contrast agents, which may be associated with the risk of adverse reactions. [1–2]. Furthermore, the aforementioned techniques do not generally provide information about parafoveal capillary hemodynamics.
In this paper, we combine the advanced ultrahigh resolution imaging technique of adaptive optics scanning laser ophthalmoscopy (AOSLO) with computational models of fluid dynamics to non-invasively evaluate hemodynamics in parafoveal retinal vessels and to assess differences in hemodynamics between nondiabetic and diabetic study eyes.
II. Methods
A. Study Subjects
Eyes under study were classified into two groups: diabetic and nondiabetic (control). The control group included three nondiabetic eyes (from two different study participants). The diabetic group included two eyes from one participant each mild nonproliferative diabetic retinopathy (NPDR, patient with type 1 diabetes duration of 19 years), and one eye with quiescent proliferative diabetic retinopathy (QPDR, patient with type 1 diabetes with duration of 29 years). Participants had a mean (±standard deviation) age of 34(±3) years and 2 were male.
B. Image Acquisition, Processing and Luminal Surface Reconstruction
The AOSLO used in this study was a modified version of the Indiana system [3]. The imaging and wavefront sensor beams were provided by superluminescent diodes with wavelengths centered at 830 nm and 780 nm, respectively (Superlum, BLM-S-830 and BLM-S-780). A micro-electromechanical system (MEMS) deformable mirror (DM, Boston Micromachines Corp, Multi-DM), which has an active area of 4.95 mm × 4.95 mm and 12 × 12 actuators with a maximum stroke of 5.5 μm, was used to provide wavefront correction. This AOSLO system compensates for >90% of the optical aberration from an eye and achieves ~2.5 μm resolution in eyes with clear media and dilated pupils.
In order to increase sensitivity, confocal pinhole aperture size was about 10× the Airy disk diameter, and a fixed pinhole offset of 300 μm from the center was applied to collect the multiply scattered light (also known as pinhole offset imaging) [4]. Firstly, 50-frame videos (30 frames/sec, 2° × 2° area) were captured and aligned with a custom-made MATLAB (The MathWorks, Inc.) program. Then, standard deviation perfusion maps [5] were generated on a pixel by pixel basis, where the temporal variations in image brightness were highlighted due to the motion of erythrocytes. Lastly, the perfusion maps were montaged to form 5° × 5° greyscale images. Errors from images montaging were minimized by auto-align function in Photoshop (CS6, Adobe Systems, Inc.).
Frangi filtering [6] (as implemented in the ImageJ software package) was applied to the images to enhance tubular structures followed by image thresholding and manual editing by a trained grader. The resulting binary masks were used to reconstruct a three-dimensional (3D) model of the luminal surface of the vessels based on the methodology previously described in [7]. Briefly, binary masks were processed with MATLAB in order to compute the graph associated with the image skeleton, calculate vessel radii along the network, and register radii to the graph.
The raw data underwent two automatic post-processing operations to remove artifacts introduced during imaging and manual editing of the images. These were caliber normalization and vessel crossing correction. Caliber normalization involves enforcing a minimum vessel diameter of 6 μm. This operation is performed in order to remove artificial narrowing, which would otherwise become vessel segments of high resistance and reduce flow upstream/downstream from them. This, in turn, would affect the values of wall shear stress (WSS) computed by the flow model. Second, vessel crossing correction involves applying a transformation to the network graph to account for the fact that our AOSLO scans are two-dimensional (2D) projections of a 3D vascular network and therefore graph nodes with four incident edges correspond to vessels running past each other at different depths. These nodes can be easily identified in the network graph and the four incident edges can be paired up based on the intersecting angles they define. Each of these pairs of edges is then translated in opposite directions (assigned randomly) along the axis perpendicular to the 2D projection. Furthermore, enough distance between them is ensured, based on the radii computed, to avoid contact. Finally, a 3D triangulation of the luminal surface is generated based on the corrected network graph and radii with the software package VMTK (Orobix srl).
C. Blood Flow Simulation
In order to construct computational blood flow models of the capillary networks under study, we require for each imaged eye: a) a definition of the flow domain (e.g. the previously described reconstruction of the network luminal surface), b) a characterization of blood flow at the boundaries of the domain (i.e. inlets, outlets, and vessel walls), and c) an appropriate blood rheological model.
The inlets and outlet of the network are the closed surfaces defined by the open ends of the vessels that connect the subset of the retinal vasculature imaged to the rest of the cardiovascular system. The arteriolar/venular identity of the inlets/outlets was determined by registration to a 100° color fundus photograph.
A constant pressure difference was imposed between the inlets and outlets of the model. We refer to this pressure difference as ocular perfusion pressure (OPP), which is given by OPP = ⅔ MAP – IOP [8], where MAP is the ocular mean arterial pressure (weighted average of systolic and diastolic pressures, MAP = ⅔ diastolic + ⅓ systolic) and IOP is the intraocular pressure. Due to the difficulty of computing MAP from in vivo ocular arterial pressure measurements, we use brachial arterial pressure as a surrogate in the calculation of OPP [9]. IOP and systolic/diastolic brachial pressures where measured for each subject right before the AOSLO imaging session. Blood velocity is taken to be zero at the vessel walls (i.e. no-slip boundary condition).
At a constitutive level, blood is a dense suspension of cells in an aqueous medium known as blood plasma. This configuration leads to complex rheological properties such as the shear thinning and Fåhræus-Lindqvist effects. It is often argued that in larger vessels these effects are secondary. However, when modeling blood flow in capillaries, they must be taken into account in order to correctly capture the changes in blood viscosity occurring along the capillary beds under study. In the current work, we use the Carreau-Yasuda shear-thinning rheology model parameterized with human data as presented in [10].
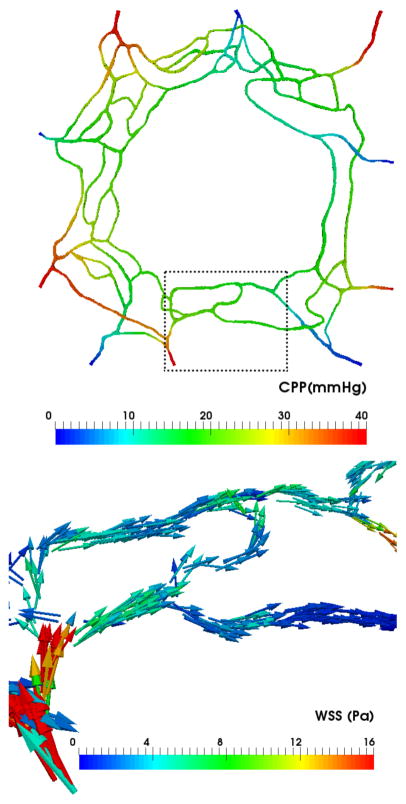
The computational fluid dynamics software package HemeLB (see [7] for more details) was used to compute high-resolution estimates of pressure, velocity, and WSS across the parafoveal capillary networks under study. On average, over 600,000 data points were generated across each vascular network.
Simulations were run using 96 cores of a local cluster at the Centre for Computational Science, Department of Chemistry, University College London, UK. Each simulation took around 3 minutes to complete.
D. Data Post-processing and Statistics
Flow visualizations were generated with Paraview (Kitware, Inc.) and post-processing of the results was performed with custom-made Python scripts. A trained grader performed manual delineation of the parafoveal inner ring for each of the acquired images in order to isolate them from feeding arterioles/venules. WSS was sampled within the delineated area and WSS mean and standard deviation was computed for each of the subjects.
III. Results
A. Image Acquisition
Figure 1 presents the AOSLO perfusion map of an eye in the diabetic group (mild NPDR) overlaid against a standard fundus image. The AOSLO standard deviation perfusion map technique provides much higher resolution than the associated fundus photograph and successfully resolves the parafoveal vasculature to a level of detail suitable for the segmentation of individual vessels. In contrast, the larger field of the associated fundus image allows the determination of the arteriolar/venular nature of the perifoveal network inlets/outlets by tracing these vessels back towards their origin at the optic nerve.
Figure 1.
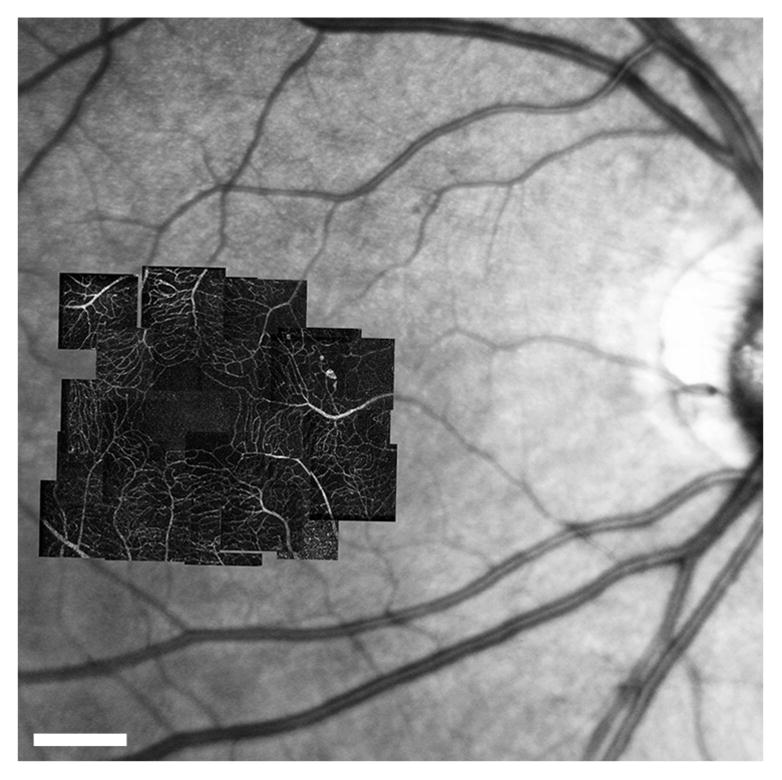
AOSLO perfusion maps montaged at fovea over fundus photograph. Diabetic group (mild NPDR case). Scale bar = 500μm.
B. Image Segmentation
The left panel of Figure 2 shows the central 5° × 5° of the perfusion map in Figure 1. A number of arterioles and venules radially approach the fovea to feed/drain the innermost capillaries. In the parafoveal region, capillaries are organized concentrically with the innermost ring being approximately 300 μm in radius. The innermost capillaries are organized in a single layer and then start to form overlapping anterior and posterior plexuses as they move further away from the fovea.
Figure 2.
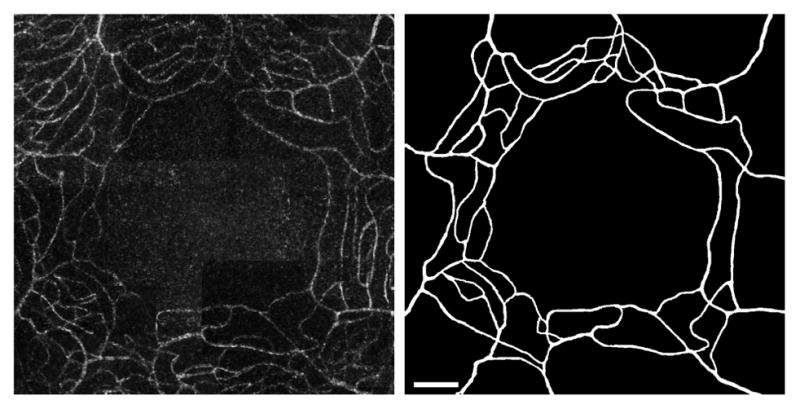
Diabetic group subject (mild NPDR). Left: central 5° × 5° of the parafoveal capillary network. Right: segmentation results from AOSLO image with the same field of view. Scale bar = 100μm.
The right panel of Figure 2 presents the results of our segmentation workflow applied to the previous image. We found that application of the Frangi filter allowed enhancement of tubular structures in the image such that, following filter application, most background noise could be removed by thresholding. This approach does however still require manual correction by a trained retinal image grader in order to correct discontinuities and artificial narrowing of vessels, especially in regions where the signal-to-noise ratio is low. This manual intervention is time consuming and may present a challenge for reproducibility.
Figure 3 presents the initial perfusion map and subsequent segmentation results for a diabetic eye with a more advanced state of DR – quiescent proliferative DR. In this case, we observe an increase in vessel tortuosity as well as a loss of the ring-like organization of the innermost capillaries due to capillary drop out, non-perfusion and shunting.
Figure 3.
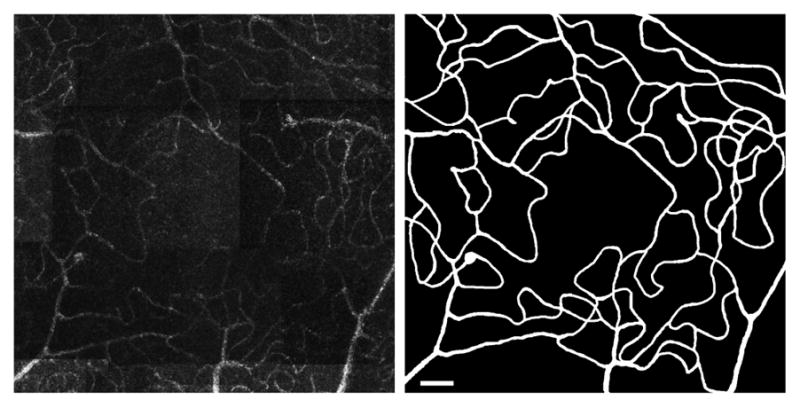
Diabetic group subject (QPDR). Left: central 5° × 5° of the parafoveal capillary network. Right: segmentation results from AOSLO image with the same field of view. Scale bar = 100μm.
C. Flow Model Construction and Simulation
The top panel in Figure 4 shows the 3D luminal surface reconstruction generated from the binary mask in Figure 2. The bottom panel shows a closer view of one of the corrected vessel crossings using the algorithm described in Section II.
Figure 4.
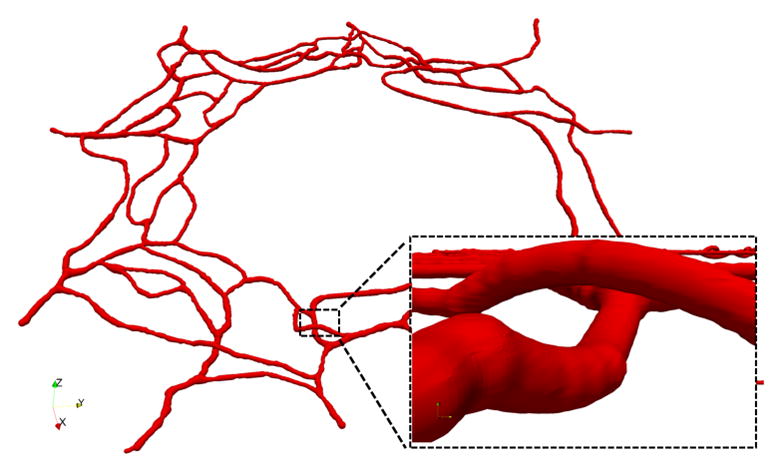
3D view of the reconstructed luminal surface with close up of one of the corrected vessel crossings.
The measured values of OPP used as boundary conditions in the flow models are as follows. Control group: 50.22, 45.22, and 51.22 mmHg. Diabetic group: 41.22, 41.22, and 50.67 mmHg. No major differences in OPP were appreciated between the groups. These values are generally in range with the following measurements previously available in the literature: 48.4±1.3 mmHg (n=16, mean age 21.9 years) [11], 56.2±1.6 mmHg (n=16, mean age 56.8 years) [11], 40±6 mmHg (n=13, age 19–23 years) [12].
The top panel in Figure 5 presents a capillary perfusion pressure (CPP) map for the model in Figure 4. CPP is defined as the pressure difference at any given point with respect to the pressure at the network outlets (IOP in our models). For every feeding arteriole, the model predicts a pressure drop of approximately 15 mmHg between the inlet and the downstream point where the arteriole meets the capillary rings. The innermost ring has CPPs in the 10–25 mmHg range. The bottom panel in the same figure plots the WSS vectors on the luminal surface of the vessels. We observe how feeding arterioles experience the highest magnitudes of WSS in the domain, which is consistent with the experimental observations of [12]. The innermost ring appears to be under WSS magnitudes in the 0.1–5 Pa range, with WSS gradients correlated with vessel narrowing and branching points.
Figure 5.
Top: Capillary perfusion pressure (CPP) across the network (defined as the pressure difference with respect to the network outlets). Bottom: Wall shear stress (WSS) vectors in the subset of the network highlighted in the top panel.
D. WSS Comparison between groups
We computed mean (±standard deviation) of the over 600,000 WSS values sampled within the innermost capillary ring for each of the six flow models generated. The results are: a) control group 2.97 (±2.70), 4.54 (±3.40), 5.01 (±4.61) Pa; b) diabetic group 2.17 (±1.82), 2.72 (±2.27), 3.66 (±2.49) Pa. Although there is overlap between WSS values from each group, parafoveal capillaries in the diabetic eyes tend to demonstrate lower average WSS values than those in nondiabetic eyes.
IV. Conclusion
Due primarily to standard imaging resolution limitations, previous studies of human retinal hemodynamics have not been able to assess flow in the smallest capillaries of the parafoveal region. Our novel approach leverages the potential of computational modelling with the ultrahigh resolution, noninvasive AOSLO imaging technique to enable in vivo estimation of CPP and WSS in the human eye. AOSLO imaging can be more difficult in eyes with media opacity or small pupils. Nonetheless, our study demonstrates that AOSLO-derived computational blood flow models may be a feasible future tool for the evaluation of human retinal hemodynamics in a clinical or research context, especially as this technology evolves and improves.
The preliminary data obtained to date by the authors suggest that the presence of DR correlates with changes in the hemodynamic environment of the parafoveal vasculature. Previous studies have suggested a link between abnormal retinal blood flow in the larger retinal vessels and the development of DR [13]. To the best of our knowledge, however, this is the first study to provide quantitative evidence supporting a change in WSS experienced by the parafoveal capillaries in the presence of diabetic retinopathy.
Acknowledgments
The authors acknowledge the HemeLB development team and the UCL Research Software Development Team (RSD@UCL) for their contribution to this work. The authors declare that they received IRB approval from Joslin’s Committee of Human Studies for this study.
Footnotes
Research supported by National Eye Institute (NEI/NIH R01 EY024702-01), Juvenile Diabetes Research Foundation (JDRF 3-SRA-2014-264-M-R), Massachusetts Lions Eye Research Fund, Inc., EPSRC grants “2020 Science” (EP/I017909/1) and “UKCOMES” (EP/L00030X/1), and the EC-FP7 project CRESTA (grant no. 287703).
Contributor Information
Miguel O. Bernabeu, Centre for Computational Science, University College London, London WC1E 6BT, UK. He is now with the Centre for Medical Informatics, Usher Institute, College of Medicine and Veterinary Medicine, The University of Edinburgh, Edinburgh EH16 4TJ, UK.
Yang Lu, Beetham Eye Institute, Joslin Diabetes Center, Boston, MA 02215, USA.
Jan Lammer, Medical University of Vienna, Austria.
Lloyd P. Aiello, Beetham Eye Institute, Joslin Diabetes Center, Boston, MA 02215, USA and the Department of Ophthalmology, Harvard Medical School, Boston, MA 02215, USA
Peter V. Coveney, Centre for Computational Science, University College London, London WC1E 6BT, UK
Jennifer K. Sun, Beetham Eye Institute, Joslin Diabetes Center, Boston, MA 02215, USA and the Department of Ophthalmology, Harvard Medical School, Boston, MA 02215, USA
References
- 1.Lira RP, et al. Adverse reactions of fluorescein angiography: a prospective study. Arq Bras Oftalmol. 2007;70(4):615–8. doi: 10.1590/s0004-27492007000400011. [DOI] [PubMed] [Google Scholar]
- 2.Kwan AS, et al. Fluorescein angiography and adverse drug reactions revisited: the Lions Eye experience. Clin Experiment Ophthalmol. 2006;34(1):33–8. doi: 10.1111/j.1442-9071.2006.01136.x. [DOI] [PubMed] [Google Scholar]
- 3.Burns SA, et al. Large-field-of-view, modular, stabilized, adaptive-optics-based scanning laser ophthalmoscope. J Opt Soc Am A Opt Image Sci Vis. 2007;24:1313–26. doi: 10.1364/josaa.24.001313. [DOI] [PMC free article] [PubMed] [Google Scholar]
- 4.Chui TYP, et al. The use of forward scatter to improve retinal vascular imaging with an adaptive optics scanning laser ophthalmoscope. Biomed Opt Expr. 2012;3(10):2537–49. doi: 10.1364/BOE.3.002537. [DOI] [PMC free article] [PubMed] [Google Scholar]
- 5.Tam J, et al. Noninvasive Visualization and Analysis of Parafoveal Capillaries in Humans. Invest Ophthalmol Vis Sci. 2010;51(3):1691–8. doi: 10.1167/iovs.09-4483. [DOI] [PMC free article] [PubMed] [Google Scholar]
- 6.Frangi AF, et al. Multiscale Vessel Enhancement Filtering. Medical Image Computing and Computer-Assisted Interventation — MICCAI’98 LNCS. 1998;1496:130. [Google Scholar]
- 7.Bernabeu MO, et al. Computer simulations reveal complex distribution of haemodynamic forces in a mouse retina model of angiogenesis. J R Soc Interface. 2014;11:20140543. doi: 10.1098/rsif.2014.0543. [DOI] [PMC free article] [PubMed] [Google Scholar]
- 8.Boltz A, et al. Effect of Latanoprost on Choroidal Blood Flow Regulation in Healthy Subjects. Invest Ophthalmol Vis Sci. 2011;52:4410–4415. doi: 10.1167/iovs.11-7263. [DOI] [PubMed] [Google Scholar]
- 9.Caprioli J, Coleman AL. Blood Pressure, Perfusion Pressure, and Glaucoma. Am J Ophthalmol. 2010;149(5):704–12. doi: 10.1016/j.ajo.2010.01.018. [DOI] [PubMed] [Google Scholar]
- 10.Boyd J, et al. Analysis of the Casson and Carreau-Yasuda non-Newtonian blood models in steady and oscillatory flows using the lattice Boltzmann method. Phys Fluids. 2007;19:093103. [Google Scholar]
- 11.Liu JH, et al. Laboratory assessment of diurnal and nocturnal ocular perfusion pressures in humans. J Ocul Pharmacol Ther. 2003;19(4):291–7. doi: 10.1089/108076803322279354. [DOI] [PubMed] [Google Scholar]
- 12.Nagaoka T, et al. Noninvasive evaluation of wall shear stress on retinal microcirculation in humans. Invest Ophthalmol Vis Sci. 2006;47(3):1113–9. doi: 10.1167/iovs.05-0218. [DOI] [PubMed] [Google Scholar]
- 13.Burgansky-Eliash Z, et al. Increased retinal blood flow velocity in patients with early diabetes mellitus. Retina. 2012;32(1):112–9. doi: 10.1097/IAE.0b013e31821ba2c4. [DOI] [PubMed] [Google Scholar]


