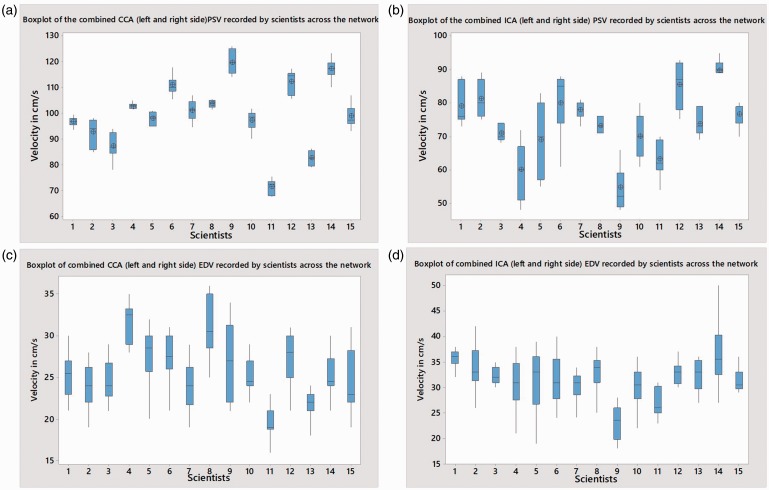
Figure 3.
A box plot of combined (left and right side) CCA (a), ICA (b), PSV and CCA (c) ICA (d) EDV measurements by scientists. The box plot indicates the range, median and the quartiles. CCA: common carotid artery; EDV: end diastolic velocity; ICA: internal carotid artery; PSV: peak systolic velocity.

