

Abstract
Research on the neural correlates of consciousness (NCC) has implicated an assortment of brain regions, event-related brain potentials (ERPs) components, and network properties associated with visual awareness. Recently, the P3b ERP component has emerged as a leading NCC candidate. However, typical P3b paradigms depend on the detection of some stimulus change, making it difficult to separate brain processes elicited by the stimulus itself from those associated with updates or changes in visual awareness. Here we used binocular rivalry to ask whether the P3b is associated with changes in awareness even in the absence of changes in the object of awareness. We recorded ERPs during a probe-mediated binocular rivalry paradigm in which brief probes were presented over the image in either the suppressed or dominant eye, to determine whether the elicited P3b activity is probe- or reversal-related. We found that the timing of P3b (but not its amplitude) was closely related to the timing of the report of a perceptual change rather than to the onset of the probe. This is consistent with the proposal that P3b indexes updates in conscious awareness, rather than being related to stimulus processing per se. Conversely, the probe-related P1 amplitude (but not its latency) was associated with reversal latency, suggesting that the degree to which the probe is processed increases the likelihood of a fast perceptual reversal. Finally, the response-locked P3b amplitude (but not its latency) was associated with the duration of an intermediate stage between reversals in which parts of both percepts coexist (piecemeal period). Together, the data suggest that the P3b reflects an update in consciousness, and that the intensity of that process (as indexed by P3b amplitude) predicts how immediate that update is.
Keywords: binocular rivalry, consciousness, P1, P3b, event-related brain potentials (ERPs)
Introduction
Central to the neuroscientific study of consciousness is the question of what brain processes give rise to visual awareness. Decades of research have focused on the neural correlates of consciousness (NCC); that is, on what brain processes differ as a function of whether or not an observer is aware of a target stimulus. Such endeavors have implicated an assortment of brain regions (Rees, 2013; Rees, Kreiman & Koch, 2002), event-related brain potentials (i.e., ERP components; Koivisto & Revonsuo, 2010; Del Cul, Baille, & Dehaene, 2007), and network properties (Melloni et al., 2007) associated with awareness, resulting in several prominent theories of consciousness (Baars, 1988; Crick & Koch, 1995; Dehaene et al., 2003; 2014; Tononi, 2008). Here we examine the role of the P3b ERP component in awareness both because it has been formally considered as a marker of consciousness (Dehaene et al., 2003, 2014; Del Cul et al., 2007; Koivisto & Revonsuo, 2010; Vogel et al., 1998; but see Silverstein et al, 2015 who show P3b oddball effects for subliminal stimuli) and because it has been instrumental in shaping a particular theory of awareness (Dehaene et al., 2003; 2014).
The P3b, characterized as a broadly-distributed parietal positivity peaking 300 ms post stimulus onset (or longer if stimulus classification is more difficult; Kutas, McCarthy & Donchin, 1977), is strongly attenuated, if not absent, for undetected stimuli presented during critical lags of an attentional blindness paradigm (Vogel, Luck, & Shapiro, 1998). Contrastive approaches using near-threshold stimuli, show that while exogenous ERP components (i.e., P1 and N1) may be graded as a function of stimulus intensity or visibility, only the P3b is predictive of whether a target stimulus will be detected (Del Cul et al., 2007, Koivisto & Revonsuo 2010). From our own lab, though not a main finding of the paper, Mathewson et al. (2009) likewise reported enhanced P3b activity for detected compared to undetected targets for metacontrast masking targets that were otherwise physically identical. Attempts to determine the neural contributors to the P3b typically implicate regions of the frontoparietal network including regions of inferior frontal cortex and temporal-parietal cortex (Polich, 2007). These same regions tend to be implicated in fMRI studies of visual awareness, whereby detected stimuli elicit greater activity relative to undetected stimuli (Rees et al., 2002).
Many prominent theories of conscious awareness postulate a positive-feedback mechanism such that once the strength of the representation reaches a threshold, it dominates perception. Versions of this theory include Edelman’s (Seth et al., 2006), which ascribes the positive feedback mechanism as re-entrant thalamo-cortico circuits (see also Tononi & Koch, 2008), and the work of Dehaene and colleagues who link the triggering process to the elicitation of the P3b component (Dehaene et al., 2003; 2014). Dehaene’s theory of conscious access entails an “ignition” mechanism whereby information being processed in relatively local and specialized cortical processors is made globally available to other processors, which may relate to updating working memory, and preparing and executing task-related responses. Such a characterization has commonalities with other cognitive processes ascribed to the P3b including the maintenance of contextual representations (Polich, 2007; 2012), context updating (Donchin 1981; Donchin & Coles 1988), stimulus classification (Kutas et al., 1977; Luck, Woodman, & Vogel, 2000), and closures of perception/action cycles (Verleger, Jaskowski, & Wascher, 2005). Common to most P3b theories is the idea that the P3b reflects some type of attention reallocation mechanism, whereby attention is reallocated to detected, task-relevant stimuli (Fabiani, Gratton, & Federmeier, 2007; Polich, 2007).
Whereas the approach of comparing brain responses to near-threshold stimuli that are detected or not detected provides very useful data, there is a potential confound with this near-threshold paradigm. Specifically, although the objective level of stimulus energy is equated in these conditions, the detection of an item may still be related to the excitability level of the sensory cortex at the moment the stimulus is presented. Indeed, previous research has shown that this is the case: for instance, Mathewson et al. (2009) showed that alpha amplitude and phase mediate the probability that a particular near-threshold target is detected. In this sense, the enhanced P3b observed for detected stimuli in this case may merely reflect the magnitude of the brain response to a stimulus that, for all practical purposes, is subjectively stronger than another stimulus occurring at a moment of low excitability. It is therefore useful to compare conditions in which a change in awareness is exogenously determined (i.e., occurs after the presentation of an external stimulus with abrupt onset), with conditions in which the change in awareness is endogenously determined (i.e., in which it occurs even in the absence of variations in the external stimulus). In fact, in our daily lives, updates to consciousness may occur in the absence of abrupt stimulus onsets: sometimes we simply become aware of something that has been there all along, such as awareness of the presence of our own nose in our visual field, which we probably weren’t aware of prior to reading this sentence. If the P3b actually reflects an update in conscious awareness, it should be present in these cases as well.
In laboratory settings, updates to consciousness in the absence of an exogenous change in stimulation are typically studied in the context of stimuli eliciting bi-stable representations (e.g., Necker cube; see Attneave, 1971). One such situation is the binocular rivalry phenomenon, which occurs when perception repeatedly switches between simultaneously presented images. As is the case in our daily lives, changes in perception during binocular rivalry occur in the absence of changes in the external environment. Thus, binocular rivalry reversals can be used to study updates in awareness that are not accompanied by physical changes in the input to the visual system. If the P3b really indexes the cascade of events leading to the global sharing of information across of number of specialized cortical processors (i.e., cortical ignition), then we should see P3b activity accompanying reversals during binocular rivalry. In fact, Valle-Inclan et al. (1999) reported P3b activity in a binocular rivalry paradigm. However, because they time-locked their ERP responses to the appearance of a probe stimulus, it remains unclear whether the P3b is probe-related or instead related to the reversals themselves, as would be predicted by the ignition theory (Dehaene et al., 2003; 2014).
By analyzing ERPs time locked to reversal-related responses, we can determine whether P3b activity in this probe-mediated paradigm is probe-related or reversal-related. We know that probes presented to the suppressed eye increase the likelihood of a reversal and are accompanied by a larger P3b amplitude, whereas probes presented to the dominant eye decrease the likelihood of a reversal and fail to produce a clear P3b (Fox, 1991; Valle-Inclan et al., 1999; Walker & Powell, 1979). What is not known is whether P3b activity (either amplitude or latency) is more closely associated with probe onset or reversal latency. If P3b activity is reversal- rather than probe-related, this would be more consistent with the P3b generally indexing updates in conscious awareness (an endogenous change in the brain) rather than being dependent on the detection of some exogenous event (i.e., stimulus onset).
We can also ask whether earlier probe-evoked ERPs (P1, N1) are associated with reversal-related activity. These components provide information about the degree to which the probe was processed. For instance, we can use the P1 and N1 to investigate probe efficacy. The P1 (latency ≈ 150 ms after probe onset) is an early sensory component that is modulated by sensory parameters, and is also sensitive to attention (Luck, Hillyard, Mouloua, Woldorff, Clark et al., 1994; Luck, Woodman, & Vogel, 2000; Mangun 1995), which may result from arousal (Vogel & Luck, 2000), inhibition of unattended stimuli (Hillyard, Vogel, & Luck, 1998) or suppression of distracting information (Brumback, Low, Gratton, & Fabiani, 2004). For our purposes, the P1 is perhaps best thought of as being associated with improved perceptual quality, or salience (Luck et al., 2000), regardless of the specific mechanisms by which this is achieved. The visual N1 is also modulated by attention such that larger amplitudes are observed when stimuli are attended (Luck et al., 2000). Larger P1/N1 amplitudes might reflect the quality or strength of the probe’s representation, which, when sufficiently “strong” in the cortical regions processing information from the suppressed eye, will accelerate switches in perception. Again, we ask whether these sensory components (P1/N1) are associated with reversal latency.
In summary, we are addressing the following questions: 1) Is the P3b observed in probe-mediated binocular rivalry probe-related or reversal related? If P3b activity is found to index reversal-related activity but not probe-related activity, then it becomes a candidate for the NCC. 2) Is the likelihood that a probe will induce a reversal associated with the amplitudes of early ERP responses (P1, N1) to the probe in sensory areas? If it is, these components could be considered pre-requisites to the NCC (Aru, Bachmann, Singer, & Melloni, 2012). Answers to these questions, and the data that support them, should impact how we think about the P3b as well as conscious awareness.
Methods
Participants
Eighteen healthy adults from the Champaign-Urbana community (12 female, age range = 21-29) participated in a two-session experiment after providing written informed consent as approved by the University of Illinois Institutional Review Board. Participants self-reported normal or corrected-to-normal vision. They were compensated $15 per hour of participation. Data from three subjects were excluded (two female, one male); one due to technical errors, one due to too few trials (fewer than 30 trials remained in one condition after artifact rejection), and one because she was aware of the hypothesis and experimental manipulation.
Apparatus and Stimuli
Binocular rivalry was induced by presenting textures to one eye and faces to the other eye (see examples in Figure 1a). Texture images consisted of 4 texture patterns including sand, gravel, tile, and plaster. Face images consisted of two male and two female emotionally-neutral faces. All images were oval-shaped, centered in a frame to aid binocular fusion. The oval-shaped images subtended 2.73 and 4.36 degrees of visual angle along the horizontal and vertical principal axes, respectively. The frame around the stimuli consisted of two rectangles, each two pixels wide and served to aid binocular fusion. The inner and outer frames subtended 3.14 × 4.77 and 3.55 × 5.18 degrees of visual angle, respectively. Behavioral pilot studies determined which face and texture image pairs yielded the best balance of dominance; that is, that both images in the pair dominated perception equally often for a majority of subjects. Eight pairs (4 male/texture and 4 female/texture) were chosen and counterbalanced for red/blue pairs, yielding a total of 16 pairs. Image luminance was adjusted so that mean image brightness of both the oval-shaped face and the texture images measured 12.8 cd/m2 in a dark room. A small fixation cross subtending 0.25 degrees and measuring 4 pixels wide was placed in the center of the oval images. The fusion frames and fixation cross were gray and measured 12.6 cd/m2 in a dark room. Background luminance was 0.5 cd/m2.
Figure 1.


Binocular rivalry and probe stimuli. (a) Sample image pairs used to induce binocular rivalry. (b) Probe stimulus overlaid on one of the rivalry images to show the relative size of the probe compared to rivalry stimuli, and the probe’s location.
Subjects were seated 105 cm from the display monitor (17” Hewlett Packard® LCD, refresh rate 75 Hz, screen resolution 768 × 1024) and viewed the image pairs through prism lenses (base out, diopter of 14; average pupillary distance). Optical sensors were used to determine stimulus presentation delays due to refresh lags in the LCD (M = 20 ms, SD = 5 ms). Stimulus onset times were adjusted accordingly. A viewing box equipped with a central divider ensured that subjects viewed each image with only one eye. Subjects were asked to maintain careful fixation, and to keep still while positioned on a chin rest. They were instructed to hold down one of two buttons on a keyboard (Empirisoft Corporation ®) using their right index finger for as long as that percept remained perceptually dominant (i.e., “complete or nearly complete percept”, as in Meng & Tong, 2004). Number pad buttons ‘1’ and ‘2’ corresponded to face or texture percepts (counterbalanced across subjects). Subjects were instructed to press neither button during periods in which neither image dominated perception (i.e., “piecemeal dominance”).
Probe stimuli (Figure 1b) were checkered circles that subtended 1 degree of visual angle in diameter and were composed of alternating quadrants of 125 and 255 (out of 255) grayscale luminance values. Probes were presented on average 500 ms (jittered between 253-747 ms; interval chosen randomly from a uniform distribution) after each button press (signifying the start of a new percept) and were centered at an eccentricity of 0.85 degrees of visual angle above a fixation cross. Probes were displayed for 200 ms in either the dominant or suppressed eye with equal probability. Subjects were provided with no information about the probe or task other than to maintain careful fixation and accurately report their perception. Stimuli were presented and responses were recorded using E-Prime 2.0 (Psychology Software Tools, Inc.) running on a Windows 7 desktop computer.
Data were collected in two separate sessions, each consisting of 12 blocks of runs, each block lasting 4 minutes. Sessions started with a brief practice block and instructions. Subjects received short 1-2 minute breaks in between blocks and longer breaks as needed. Blocks consisted of 4 trials lasting 1 minute each. Trials began with a 1.5 second presentation of the fixation cross and fusion frame, followed by ~58 seconds of the face and texture stimulus pair, and ended with the 0.5 second presentation of a red/blue noise mask. A total of approximately 96 minutes of binocular rivalry data were collected for each subject.
Behavioral analysis
Reversal latencies were calculated as the amount of time between the onset of the probe and the button release. Piecemeal duration was calculated as the amount of time between the button release and subsequent button press. Percepts were sorted into two conditions based on where the probe appeared after the button press: suppressed-eye or dominant-eye probes. Percepts were excluded from all analyses if the button release occurred less than 400 ms after the probe appeared, as the reversals in this time window are unlikely to be caused by the probe. Median reversal latencies and piecemeal durations were calculated separately for each condition, condition quartile, and subject.
Probe-locked ERP recording and analysis
Continuous EEG was recorded concurrently with fast optical imaging (optical imaging data are not reported here), making it necessary to use a limited EEG recording montage. Eight passive electrodes made contact with the scalp through a helmet used to secure the optical imaging optodes. Electrodes were placed off the midline scalp at locations roughly corresponding to F3/F4, C3/C4, P3/P4 and O1/O2 of the standard 10/20 system (Jasper, 1958), as well as on the left and right mastoids. Scalp electrodes were referenced to the left mastoid online and arithmetically re-referenced offline to an average mastoid reference (Luck, 2014; see also Keil et al., 2014). Electrodes were also placed above and below the left eye, and at the outer canthi of each eye to measure the vertical and horizontal electrooculogram (EOG). Electrical impedance was maintained below 10 kΩ. EEG was sampled at 500 Hz. Online, the EEG was filtered using a bandpass filter of 0.1-250 Hz. Offline, all analyses were done using custom scripts in MATLAB and EEGLAB (Delorme & Makeig, 2004). The EEG was again filtered using a low-pass filter of 15 Hz for the analyses of the probe-locked ERPs sorted by reversal latency, because it has been shown that estimations of peak latency and/or amplitude are far more accurate with a narrow compared to a wide filter (Gratton, Kramer, Coles & Donchin, 1989). A 30 Hz filter was used for all other analyses.
Data were segmented into 1200-ms epochs time-locked to the onset of the probe stimulus (−200 to 998 ms). Trial activity was baseline-corrected using the average amplitude from −200 to 0 ms. Trials with A/D saturation (i.e., artifacts greater in absolute magnitude of more than 500 μV) were removed before detection and correction of ocular artifacts (Gratton, Coles, & Donchin, 1983). Trials with other artifacts greater in absolute magnitude than 250 μV were then excluded from further analysis. Trials containing eye blinks within the entire epoch, including baseline, were rejected. This resulted in the exclusion of less than 44% of trials per subject (range = 4%-43%). No subject had fewer than 238 trials per condition for dominant- vs. suppressed-eye comparisons (range = 238-857), and no fewer than 59 trials per quartile for the suppressed-eye quartile comparisons (range = 59-219).
Grand-average ERP waveforms were calculated separately for dominant- and suppressed-eye probes. ERPs for each subject and condition were then created and combined to generate the grand average ERP at each electrode location. Paired-sample t-tests (two-tailed) were used to compare mean voltage differences between the two conditions within each of 3 component windows including P1, N1, and P3b (see Table 1). Component windows were chosen to be centered on visually inspected peaks from the grand average of all probe trials at the electrode locations corresponding to their analyses (i.e., collapsed over dominant- and suppressed-eye probes). Measurement window widths for the P1, and N1 were set at 40 ms, which prevented overlap between adjacent component windows. A component window of 400 ms for P3b was chosen since this component has a longer and more variable time course. Electrode locations P3 and P4 were chosen for P1, N1 and P3b analyses since P3b amplitudes are greatest over parietal electrode locations (Fabiani et al., 2007; Polich 2007) and these locations also tend to show large early visual ERP activity (P1 and N1). Suppressed-eye probes were also split into quartiles (within-subjects) based on reversal latency. Grand average waveforms were computed for each subject and quartile. T-tests for linear trend across quartiles were conducted for the mean voltages in each component window separately for probes presented in the suppressed and dominant eye.
Table 1.
Upper and lower boundaries for the measurement windows of each ERP component.
| Component | Lower Bound | Upper Bound |
|---|---|---|
| P1 | 104 | 144 |
| N1 | 144 | 184 |
| P3b | 508 | 908 |
| CPP | −278 | 222 |
Probe-locked ERP analysis (sorted by reversal latency)
Observed differences in P3b amplitude could be the result of peak latency jitter (Fabiani et al., 2007; Luck, 2014). In this analysis only, to account for slow drifts, the EEG was filtered offline using a 0.3-15 Hz band-pass filter. Data were segmented into 3200-ms epochs time-locked to the onset of the probe (−200 to 3000 ms). Trial activity was baseline-corrected using the average amplitude from −200 to 0 ms. Artifact detection, correction, and rejection were carried out in a manner identical to the procedure used in the short epoch analysis described above. Trials were sorted within subjects as a function of reversal latency. A Gaussian low pass filter was created using the Matlab function ‘fspecial’ with sigma of 3.0 and filter size of 2*ceil(2*sigma)+1. The filter was applied within subjects for each subject’s suppressed-eye probe trials using ‘imfilter’. A lagged cross-correlation technique was used to identify the peak of “P3b” activity for each trial. The seed signal was the grand-averaged 500-ms window of activity centered on the visually inspected peak of P3b activity for fastest-switching suppressed-eye probes. Single-trial P3b peak latency was determined by selecting the timestamp corresponding to the peak of the seed signal at the lag where the cross correlation was largest. Single-trial P3b peak latencies were then correlated with reversal latency. Correlation coefficients (Pearson’s r) were calculated for each subject individually. Since Pearson’s r correlation coefficients are not normally distributed (Fisher, 1915), they were transformed using a Fisher’s Z-transformation procedure before being tested for significance using a two-tailed t-test. Transformed coefficients were also averaged together and then transformed by using the inverse of Fisher’s Z-transformation back to correlation coefficients to obtain group-level descriptive statistics.
Response-locked ERP recording and analysis
Data for ERPs time-locked to the button release (i.e., end of the current percept) were collected in a manner similar to that described for probe-locked ERPs, but with a few exceptions. Data were segmented into 2000-ms epochs time-locked to the button release (−1500 to 500 ms). Trial activity was baseline-corrected using the average amplitude from −1500 to −1000 ms. Artifact detection, correction, and rejection were carried out in a manner similar to the procedure described above with the exception that trials were rejected if eye blinks occurred within 1000 ms prior to the button release.
Grand-average ERP waveforms were calculated in a manner consistent with that described for probe-locked ERPs with the exception that paired-sample t-tests (two-tailed) were used to compare mean voltage differences between the two conditions within only the time window of a central parietal positivity (which we identify as a P3b-like activity). The time window for this activity (henceforth referred to as P3b) was 500 ms and chosen to be centered on visually inspected peaks from the grand average of all trials (i.e., collapsed over dominant- and suppressed-eye probes). Data were quartile split within subjects as a function of both reversal latency and piecemeal duration. T-tests for linear trend were conducted for the mean voltages in each component window in a manner consistent with the suppressed vs. dominant ERP analysis.
Results
Behavior
Within-subject median reversal latencies were calculated separately for dominant and suppressed-eye probes. Reversal latencies following probes presented to the suppressed eye occurred much faster (M = 1162 ms, SD = 272 ms, range = 840-1708 ms) compared to those following dominant-eye probes (M = 2474 ms, SD = 324 ms, range = 1704-3089 ms). Furthermore, this pattern was observed in all 15 subjects (Table 2), indicating that probes presented to the suppressed eye accelerate the reversal process (Mdiff = 1312 ms; t(14) = 14.28, p < 0.0001). Median reversal latencies split into quartiles were calculated for suppressed-eye probes (Figure 2a). Figure 2b displays a histogram based on binned reversal latencies for suppressed-eye probes for all subjects.
Table 2.
Within-subject median percept duration (msec). Median percept durations were calculated individually for each subject and separately for dominant and suppressed-eye probe conditions. All subjects show the group-level effect (i.e. reversals occur earlier for suppressed- than for dominant-eye probes.
| Subject | Dominant | Suppressed | Diff (Dom > Sup) |
|---|---|---|---|
| 1 | 2578 | 1387 | 1191 |
| 2 | 2795 | 1355 | 1440 |
| 3 | 2546 | 970 | 1576 |
| 4 | 2097 | 1319 | 778 |
| 5 | 2634 | 894 | 1740 |
| 6 | 3089 | 1704 | 1385 |
| 7 | 2623 | 842 | 1781 |
| 8 | 1896 | 840 | 1056 |
| 9 | 2678 | 1270 | 1408 |
| 10 | 2426 | 1304 | 1122 |
| 11 | 2148 | 900 | 1248 |
| 12 | 2692 | 896 | 1796 |
| 13 | 1948 | 1042 | 906 |
| 14 | 2678 | 1104 | 1574 |
| 15 | 2288 | 1605 | 683 |
| Average | 2474 | 1162 | 1312 |
Figure 2.


Behavioral results. (a) Average reversal latencies for suppressed-eye probes reported as a function of reversal latency, and corresponding standard errors of the means. (b) Reversal latency (ms) for all suppressed-eye probe trials for all subjects. Reversal latencies were grouped into 100-ms wide bins (plotted along x-axis). Bin count plotted along the y-axis. Colored regions and dashed lines that separate them represent average quartile boundaries.
ERPs: sensory components
Topographic plots are displayed for the P1 and N1 components (Figure 3a). Figure 3b shows the grand-averaged waveforms for suppressed- (red) and dominant-eye (blue) probes for electrode locations P3 and P4. ERPs elicited by suppressed-eye probes differed in amplitude from dominant-eye probes in two early time windows, whose timing and topographic distributions are consistent with an N1 (inversion when comparing posterior vs. anterior locations; delayed timing of posterior N1 relative to anterior N1). In particular the N1 (P3: t (14) = 2.78, p < 0.05; P4: t (14) = 2.49, p < 0.05) amplitudes were larger for suppressed-eye than for dominant-eye probes. Suppressed and dominant-eye probes were statistically indistinguishable within the P1 component window (P3: p = 0.26; P4: p = 0.58).
Figure 3.


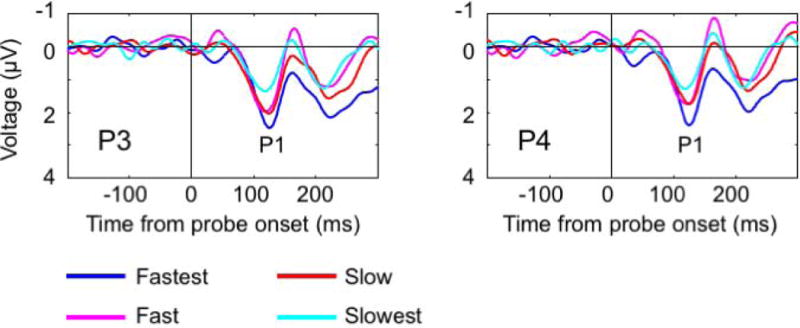
Early sensory ERPs time-locked to probe onset. (a) Topographic distribution of voltage (μV) plotted separately for P1 and N1 ERP component windows for suppressed-eye probes, dominant-eye probes, and the difference between them. Stars show the location of electrode activity plotted in Figures 3b and 3c. (b) Suppressed-eye vs. dominant-eye probe ERP activity. Time (ms) from probe onset plotted on X axis. Voltage (μV) plotted along Y axis (negative up). Vertical line at time 0 corresponds to probe onset. Suppressed-eye probes (red) evoke enhanced N1 activity (P3 & P4). (c) Suppressed-eye probe ERPs time-locked to probe onset split into quartiles based on reversal latency. Time (ms) from probe onset plotted on X axis. Voltage (μV) plotted along Y axis (negative up). Vertical line at time 0 corresponds to probe onset. P1 (P3 & P4) amplitude varies as a function of reversal latency.
In short, we found that N1 amplitudes varied as a function of whether the probe appeared in the suppressed or dominant eye. If the processes related to these components play a causal role in the perceptual reversal, then their amplitude should be associated with reversal latency. This hypothesis was tested by splitting the ERP data from the suppressed-eye probes into quartiles based on the speed with which a reversal followed the probe and comparing the ERP amplitudes in each condition (Figure 2a: fastest-switching, fast-switching, slow-switching and slowest-switching probes). Analyses were carried out separately for the P1 and N1 component windows.
Mean quartile ranges are displayed in Figure 2b and quartile ERPs for suppressed-eye probes are plotted in Figure 3c. P1 amplitude varied significantly as a function of quartile (P3: t (14) = 3.23, p < 0.01; P4: t (14) = 2.98, p < 0.05 for linear trend), such that the fastest switches were accompanied with larger amplitudes. The linear trend for N1 amplitude as a function of reversal latency was in the expected direction but did not reach significance (P3: t (14) = 2.02, p = 0.06; P4; t (14) = 2.08, p = 0.06). We note that reversal latency was not associated with probe delay from the previous reversal (mean r = −0.001, t(14) = 0.07, p = 0.94) indicating that jittering the probe onset did not cause the observed relationship between reversal latency and the amplitude of the P1. Instead, the fact that larger P1 amplitude was associated with faster reversals suggests that the extent to which the probes are processed determines how likely they are to elicit a reversal.
ERPs: P3b analyses
Prior research has shown that suppressed-eye probes elicit a larger P3b than dominant-eye probes (Valle-Inclan et al., 1999), consistent with them attracting greater attention (for reviews of P3b and attention see Fabiani et al., 2007; Polich 2007, 2012). We replicated this finding (see Figures 4a for maps and 4b for waveforms at P3: t (14) = 7.55, p < 0.0001; and P4: t (14) = 7.38, p < 0.0001). Importantly, P3b amplitude varied monotonically as a function of reversal latency quartile (P3: t (14) = 7.70, p < 0.0001; P4: t (14) = 8.47, p < 0.0001 for linear trend), such that it was largest for the fastest switches (Figure 4c). However, before interpreting this relationship with P3b amplitude we need to consider a latency explanation of this amplitude difference. For example, it is possible that the greatly reduced P3b activity in the slow- and slowest-switching quartiles may be due to highly variable P3b latencies within those two quartiles (corresponding to the variability in reversal latency for these quartiles evident in Figure 2).
Figure 4.

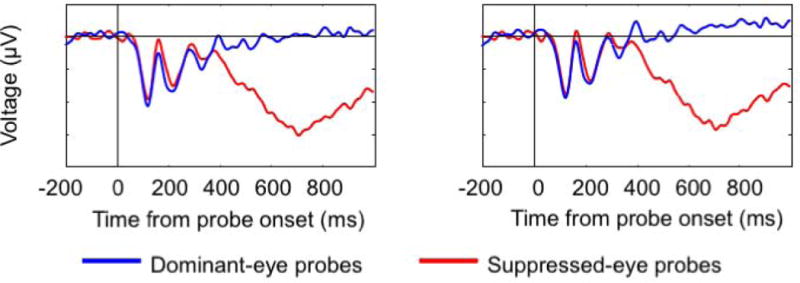

P3b ERPs time-locked to probe onset. (a) Topographic distribution of voltage (μV) plotted for P3b ERP component window for suppressed-eye probes, dominant-eye probes, and the difference between them. Stars show the location of electrode activity plotted in Figures 3b and 3c. (b) Suppressed-eye vs. dominant-eye probe ERP activity. Time (ms) from probe onset plotted on X axis. Voltage (μV) plotted along Y axis (negative up). Vertical line at time 0 corresponds to probe onset. Suppressed-eye probes (red) elicit enhanced P3b activity (P3 & P4) relative to dominant-eye probes (blue). (c) Suppressed-eye ERPs sorted as a function of reversal latency time-locked to probe onset. Time (ms) from probe onset plotted on X axis. Voltage (μV) plotted along Y axis (negative up). Vertical line at time 0 corresponds to button release. P3b amplitude varies as a function of reversal latency (electrode locations P3 and P4).
To address this possibility, we extended the epoch of the probe-locked ERP analyses to include activity 3000 ms after probe onset and sorted trials, for each subject, based on reversal latency. Figure 5 plots single-trial ERP amplitudes averaged over electrodes P3 and P4 for each subject sorted by reversal latency. There is a clear relationship between the positive deflection in the P3b time window (and beyond) and reversal latency (black dots in the plots), suggesting that the amplitude differences between quartiles are indeed due to latency jitter of the P3b. More importantly, for most subjects the moment of maximum positivity coincides with the timing of the button release, indicating awareness of the reversal. In other words, it would seem that the observed differences in the P3b window do not reflect probe-related activity, but instead reflect the reversal itself, as the P3b varies in latency tracking the time of reversal instead of peaking at a fixed time following probe onset. To support this claim, we computed correlations between the peak of the P3b (estimated using the lagged-cross correlation technique described in the method section) and reversal latency, separately for each subject. This analysis revealed consistently high positive correlations (mean r = 0.53, t(14) = 8.01, p < 0.0001) again suggesting that P3b activity indexes reversal-related activity.
Figure 5.

Suppressed-eye ERPs sorted as a function of reversal latency time locked to probe onset. Each plot represents data for a single subject. Time (ms) from probe onset plotted on X axis. Vertical line at time 0 corresponds to probe onset. Horizontal lines within each plot correspond to within-subject quartile boundaries. Black dots represent the timestamp of the button release (i.e. end of current percept). Warm and cold colors represent positive and negative amplitudes respectively. “P3b-like” activity appears to track the button release. Q4 = fastest; Q3 = fast, Q2 = slow, Q1 = slowest.
To further support this view, we also time-locked the waveform to the button release (indicating the end of the current percept; see Figure 6). In this figure, the ERP waveforms are sorted as a function of reversal latency quartile and of whether the probe had previously appeared in the suppressed (top row), or dominant eye (bottom row). In these response-related waveforms there is a clear and consistent positive deflection around the time of the button-release (0 time in the figure). Finally, response-locked P3b amplitudes did not vary as a function of eye (i.e., suppressed vs. dominant eye; P3: t (14) = 0.54, p = 0.59; P4: t (14) = 0.71, p = 0.49), or as a function of reversal latency either for the suppressed eye (P3: t (14) = 0.03, p = 0.98; P4: t (14) = 0.45, p = 0.66) or the dominant-eye (P3: t (14) = 0.51, p = 0.62; P4: t (14) = 0.14, p = 0.89). In other words, similar P3b activity is evoked regardless of when or from which eye a reversal occurs, consistent with it tracking reversal-related processes associated with changes in awareness.
Figure 6.

ERPs sorted as a function of reversal latency time-locked to button release. Time (ms) from probe onset plotted on X axis. Voltage (μV) plotted along Y axis (negative up). Vertical line at time 0 corresponds to button release. “P3b-like” activity apparent at parietal electrodes and does not vary as a function of reversal latency for either suppressed-eye (top row) or dominant-eye probes (bottom row).
An analysis of P3b and piecemeal duration (i.e., the period in which the two percepts are vying for dominance) further implicates the P3b in the actual perceptual switch. Figure 7 shows ERP activity time-locked to the button release as a function of piecemeal duration quartiles, again separately for reversals following suppressed (top row) and dominant eye probes (bottom row). P3b amplitude monotonically varied as a function of piecemeal duration such that amplitudes were largest for both suppressed- and dominant-eye probes when piecemeal durations were shortest (suppressed linear trend: P3: t (14) = 3.06, p < 0.01; P4: t (14) = 3.21, p < 0.01; dominant linear trend: P3: t (14) = 3.09, p < 0.01; P4: t (14) = 3.78, p < 0.005. Moreover, it does not appear that the smaller P3b amplitudes for longer piecemeal durations reflect greater latency jitter, as there is no evidence that these P3b are more extended in time than those accompanying shorter piecemeal durations. Instead, these data suggest that the larger P3b’s reflect a greater commitment to the reversal.
Figure 7.

ERPs plotted as a function of piecemeal time-locked to button release. Time (ms) from probe onset plotted on X axis. Voltage (μV) plotted along Y axis (negative up). Vertical line at time 0 corresponds to button release. “P3b-like” activity apparent at parietal electrodes and varies as a function of piecemeal duration for suppressed-eye probes (top row) and dominant-eye probes (bottom row).
Discussion
The results of this study replicate and extend those of previous work investigating binocular rivalry using a probe paradigm. Specifically, we replicated behavioral data suggesting that probes presented to the suppressed eye can accelerate a switch to the suppressed-eye image (Walker & Powell, 1978; Fox, 1991; Valle-Inclan et al., 1999), as well as ERP data showing that suppressed-eye probes elicit larger P3b activity than dominant-eye probes. Interestingly, however, we found that probes also elicited early sensory activity (i.e., N1) that differed depending on whether the probe appeared in the suppressed or dominant eye: N1 amplitudes were greater for suppressed-eye probes. This finding is consistent with the idea that probes are processed differentially as a function of whether the probe appears in a dominant or suppressed channel. Intuitively, larger N1 amplitudes suggest that probes are more effective (i.e., better processed) when presented to the suppressed eye. Yet this finding is not consistent with the wealth of literature showing higher detection thresholds and reduced detection performance for probes presented to the suppressed-eye relative to probes presented to the dominant-eye, or to monocular probes (Wales & Fox, 1970; Fox & Check, 1972; Norman, Norman, & Bilotta, 2000; Alais, Cass, O’Shea, & Blake, 2010; Baker & Cass, 2013). There are a couple of possibilities for why the N1 may nonetheless be larger. Given that N1 amplitude is known to vary as a function of attention, it is possible that suppressed-eye probes, by virtue of being processed in an unattended channel, produce a larger redirection of attention than dominant-eye or monocular probes. Alternatively, it could be that the texture or face in the dominant eye competed with the probe and thus reduced its amplitude (Miller et al., 2015); the “competing” stimulus in the suppressed-eye, however, was itself suppressed and thus may have produced little competition for the probe. Future work is needed in order to explain this seemingly paradoxical finding.
Crucially, when average ERPs were computed time-locked to the suppressed-eye probes, it appeared that both P1 (Figure 4) and P3b (Figure 5) varied in amplitude as a function of reversal latency, suggesting that both play a critical role in probe-induced reversals. However, when analyses were conducted on a trial-by-trial basis (Figure 6), they clearly showed that a positive deflection occurred right before the time of reversal. When reversal time was very short, this positivity corresponded tightly (in terms of polarity, latency, and scalp distribution) with the probe-related P3b for the same type of trial. Therefore, it is logical to conclude that this positivity has the same significance on all trials –those for which the latency of reversals is short and those for which the latency of reversal is long. According to this logic, we should label this positivity “P3b” independently of its latency from the probe, and we should conclude that the P3b heralds the end of one percept and the upcoming decision to release the button as a result of the perception change on all trials, independently of the latency at which this behavior occurs. In this sense, it is P3b latency, and not amplitude, that varies as a function of reversal latency. In fact, when averages were computed time-locked to the button release (Figure 7), the amplitude differences across quartiles of reversal latency disappeared. Instead, P3b amplitude was found to vary as a function of piecemeal duration regardless of whether the probe previously appeared in the dominant or suppressed eye (Figure 8). Together these P3b results indicate that this component reflects the change in percept rather than a response to the probe. In the remainder of this discussion we will consider these findings in light of current views of binocular rivalry as a means of probing access to consciousness.
Early sensory components
Suppressed-eye probes accelerate reversals, but why? Though the neural mechanisms remain elusive, current models of binocular rivalry posit that perception settles as a result of a winner-take-all competition resulting from the high degree of binocular disparity existing between the two retinal images (i.e., reciprocal inhibition; see Kang & Blake 2011). One possible explanation for probe-induced reversal acceleration is that suppressed-eye probes boost activity in the eye-specific monocular channels in primary visual cortex (i.e. V1). If sufficient, a disruption, or change in the perceptual weights of items made accessible to awareness could lead to a change in perception during binocular rivalry. Larger disruptions would then be associated with faster switches.
Our data are consistent with the idea that the degree to which the probe is processed in early visual cortex predicts whether it will result in a switch. In particular, the fact that P1 amplitude varies as a function of reversal latency suggests that heightened processing of the probe (as indexed by P1 amplitude) increases the likelihood that perception will switch to the suppressed-eye. Both P1 and N1 amplitudes have been associated with perceptual salience, such that better processed stimuli will elicit larger P1 and N1 amplitudes (Luck et al., 2000). Miller et al. (2015) have recently argued that P1 activity indexes extrastriate processing, while N1 activity reflects the feedback of extrastriate processes back onto V1. The N1 does not show this same relationship with reversal latency. However, because the N1 follows the P1 closely in time it is possible that the increasingly positive deflection of the P1, as a function of reversal latency, is obscuring a similar relationship between reversal latency and N1 amplitude due to component overlap.
P3b
Since its discovery (Sutton, Braren, Zubin, & John, 1965) the P3b has been associated with several cognitive processes, including context updating (Donchin 1981, Donchin & Coles 1988), access to consciousness (Dehaene et al., 2003; Sergent, Baillet, & Dehaene, 2005; Del Cul, Baillet, & Dehaene, 2007), perception/action “closure” processes (Verleger et al., 2005), and representational maintenance (Polich, 2007, 2012), all resulting from attention processes (for a review see Fabiani et al., 2007). A critical aspect of the P3b is that it is considered to be an endogenous component, that is, a component that can be generated even in the absence of an external stimulus (see Fabiani et al., 2007). Although typical P3b paradigms ask participants to detect the presence or absence of a target often presented at some detection threshold, in some studies it has been shown that omitted stimuli can also generate a P3b (e.g., Sutton, Tueting, Zubin & John, 1967). In general, P3b should be considered as the manifestation of an internal process, which may or may not be related to the presentation of an external stimulus – depending on the subject’s task.
Our paradigm differs from most of those used in previous research in that, rather than having subjects detect a target, we ask them instead to respond to changes in conscious awareness that may (or may not) be accelerated by presenting probes to the suppressed eye. In our own data, we find that P3b activity tracks reversal-related processes such that P3b peak latency coincides with switches in perception. This suggests that P3b activity elicited by suppressed-eye probes occurs not as a result of the appearance of a probe per se, but instead as a result of a change in conscious awareness, which is facilitated by the appearance of a probe in the suppressed eye. The P3b data also suggest dramatic differences between trials that lead to rapid perceptual switches and trials that do not, as demonstrated by the finding that P3b amplitude varies as a function of piecemeal duration, but not as a function of reversal latency. One possible interpretation of these findings is that the P3b may reflect activation of the fronto-parietal attention network (FPN), and that this activation may result in the reprogramming of the perceptual network such that the suppressed-eye representations are up-regulated and the dominant-eye representations are down-regulated. We suggest that P3b amplitude reflects the strength of the commitment to reprogram the perceptual network, whereby a greater commitment, and hence increased involvement of FPN, leads to a more rapid and/or robust upregulation of the suppressed-eye representation. However, prior research has shown that P3b amplitude to a primary task varies as a function of workload, such that higher secondary task workload is associated with reduced primary task P3b amplitude (Kramer, Wickens, & Donchin 1985). Thus it remains possible that the relationship between P3b amplitude and piecemeal duration could merely reflect differences in workload, where longer piecemeal durations, requiring greater workload, would be associated with reduced P3b amplitudes. We note, however, that this account is compatible with our upregulation account.
The data of the current study suggests that changes in perception during binocular rivalry are accompanied by a particular brain process, which is manifested at the scalp by a P3b. Although it is not clear whether this brain process is in itself a cause or an effect (or even just a correlate) of the perceptual change, we believe that the latency and amplitude of the P3b can be taken as indices of the timing and extent to which stimulus representations within the brain are modified, and perception changes. If this is true, then the data would suggest that: (a) there is a discrete moment at which representations are modified, which is identified by the timing of the P3b; and (b) there is a gradation in the extent to which representations are modified, as indicated by the fact that longer piecemeal durations are associated with a smaller P3b and vice versa.
The association of P3b with changes in working memory or consciousness-related representations has been proposed by several other investigators (e.g., Donchin, 1981; Donchin & Coles, 1988; Dehaene, Sergent & Changeux, 2003). Specifically, Dehaene and colleagues have elaborated a network-based model in which P3b activity indexes a global and coordinated large-amplitude activation of distributed brain areas (Dehaene, Sergent, & Changeux, 2003). Dehaene describes this process as “cortical ignition,” whereby information being processed in relatively local and specialized processors are made globally available to other distant processors (Dehaene & Changeux, 2011; see also Dehaene & Changeux, 2005). In their proposal it is this access to a global neuronal workspace that distinguishes conscious from unconscious content.
It should be noted, however, that Dehaene and Changeux (2005) seem to favor the idea that the process of global ignition is a discrete, all-or-none phenomenon associated with a cascading, positive-feedback process that once begun needs to run its complete course (a full re-programming of the network) so that a new percept is formed. According to this idea, some stimuli, and not others, lead to global ignition, and this is related to the extent to which the positive-feedback process is triggered. This view appears at first glance contradictory to our observation that the network re-programming may be graded, as indicated by the relationship between smaller P3b and piecemeal duration. It may similarly appear contradictory with a large series of studies in which P3b amplitude appears to be graded as a function of various manipulations, such as stimulus probability (e.g., Duncan-Johnson & Donchin, 1977), stimulus sequence (e.g., Squires, Wickens, Squires, & Donchin, 1976), and task priority (e.g., Sirevaag, Kramer, Coles, & Donchin, 1989). A possible explanation for this apparent contradiction might be that in several of these studies (but see Squires et al., 1976), P3b amplitude was quantified on averages, rather than single trials, and that the apparent graded effects may be the results of mixture of distributions of trials in which P3b was, or was not elicited, with the probability of elicitation varying across conditions.
It is not clear, however, how this interpretation would fit with our observation that P3b amplitude is associated with the duration of the piecemeal process. Our data indicate that the re-programming leading to the new percept is not always the same, as the amplitude of P3b is correlated with the subsequent duration of the piecemeal operation. There are two ways of interpreting this finding. The first is that the reprogramming occurring during binocular rivalry includes two stages: (a) a stage in which both percepts occur at the same time, and (b) a stage in which the new percept wins the tug-of-war with the old percept. Perhaps two separate P3b’s are then elicited during this process, one for each stage. On some trials, the two stages occur in rapid succession, generating an apparently larger P3b. A problem with this hypothesis is that the data presented in Figure 8 do not provide any evidence of a double peak, or even of a prolongation of the duration of the P3b as a function of increase in piecemeal period duration. The second account is that the reversal (i.e., re-programming) process may vary in intensity across trials: on some trials the re-programming of the network is very intense, leading to a rapid reversal in which the piecemeal period is short, whereas on other trials the process is less intense, leading to a slow reversal, in which the piecemeal process is relatively long. Note that, according to this second hypothesis, P3b only indexes the beginning of the reversal process, but not its end: in this view, P3b would appear to be more logically considered an antecedent (or a correlate of an antecedent) rather than a consequence of the reversal itself.
In summary, our data provide compelling evidence that probe-mediated binocular rivalry reversals are accompanied by two distinct ERP components: an early component whose amplitude indexes probe-related activity (i.e., P1), and a later component whose latency and amplitude index reversal-related activity (i.e., P3b). For the first time, we have shown that P1 amplitude (time-locked to probe onset) is inversely related to reversal latency, indexing the degree to which the probe was processed in early visual areas, and by extension, the degree to which the probe was likely to accelerate reversals. The relationship between P1 amplitude and reversal latency suggests that the P1 may be a prerequisite to the NCC, such that sufficient sensory processing may be required in order for any update to consciousness to occur. We have also shown that P3b amplitude varies as a function of piecemeal duration, which we believe indexes the commitment of the brain to reprogram the perceptual network accompanying changes in conscious perception. Taken together, our data provide further evidence that the P3b is a marker for the NCC. Although it is often difficult to distinguish between the NCC proper and consequences of the NCC (Aru et al., 2012), the fact that the P3b indexes the start of the reversal process rather than its end implies the P3b may index the NCC proper.
Acknowledgments
Funding provided by NIH R01EY022605-01 to DB, KM, GG & MF
Footnotes
Conflict of interest: The authors declare no competing financial interests
References
- Alais D, Cass J, O’Shea R, Blake R. Visual sensitivity underlying changes in visual consciousness. Current Biology. 2010;20:1362–1367. doi: 10.1016/j.cub.2010.06.015. [DOI] [PMC free article] [PubMed] [Google Scholar]
- Aru J, Bachmann T, Singer W, Melloni L. Distilling the neural correlates of consciousness. Neuroscience & Biobehavioral Reviews. 2012;36:737–746. doi: 10.1016/j.neubiorev.2011.12.003. [DOI] [PubMed] [Google Scholar]
- Attneave F. Multistability in perception. Scientific American. 1971;225:63–171. [PubMed] [Google Scholar]
- Baars B. A cognitive theory of consciousness. Cambridge University Press; 1988. [Google Scholar]
- Baker D, Cass J. A dissociation of performance and awareness during binocular rivalry. Psychological Science. 2013;24:2563–2568. doi: 10.1177/0956797613496824. [DOI] [PubMed] [Google Scholar]
- Brumback C, Low K, Gratton G, Fabiani M. Sensory ERPs predict differences in working memory span and fluid intelligence. Neuroreport. 2004;15:373–376. doi: 10.1097/00001756-200402090-00032. [DOI] [PubMed] [Google Scholar]
- Clark V, Fan S, Hillyard S. Identification of early visually evoked potential generators by retinotopic and topographic analysis. Human Brain Mapping. 1995;2:170–187. [Google Scholar]
- Crick F, Koch C. Are we aware of neural activity in primary visual cortex? Nature. 1995;375:121–123. doi: 10.1038/375121a0. [DOI] [PubMed] [Google Scholar]
- Di Russo F, Martínez A, Sereno M, Pitzalis S, Hillyard S. Cortical sources of the early components of the visual evoked potential. Human brain mapping. 2002;15:95–111. doi: 10.1002/hbm.10010. [DOI] [PMC free article] [PubMed] [Google Scholar]
- Dehaene S, Changeux J. Ongoing spontaneous activity controls access to consciousness: A neuronal model for inattentional blindness. PLoS Biology. 2005;3:e141. doi: 10.1371/journal.pbio.0030141. [DOI] [PMC free article] [PubMed] [Google Scholar]
- Dehaene S, Changeux J. Experimental and theoretical approaches to conscious processing. Neuron. 2011;70:200–227. doi: 10.1016/j.neuron.2011.03.018. [DOI] [PubMed] [Google Scholar]
- Dehaene S, Charles L, King J, Marti S. Toward a computational theory of conscious processing. Current Opinion in Neurobiology. 2014;25:76–84. doi: 10.1016/j.conb.2013.12.005. [DOI] [PMC free article] [PubMed] [Google Scholar]
- Dehaene S, Sergent C, Changeux J. A Neuronal network model linking subjective reports and objective physiological data during conscious perception. Proceedings of the National Academy of Sciences of the United States of America. 2003;100:8520–8525. doi: 10.1073/pnas.1332574100. [DOI] [PMC free article] [PubMed] [Google Scholar]
- Del Cul A, Baillet S, Dehaene S. Brain dynamics underlying the nonlinear threshold for access to consciousness. Plos Biology. 2007;5:2408–2423. doi: 10.1371/journal.pbio.0050260. [DOI] [PMC free article] [PubMed] [Google Scholar]
- Delorme A, Makeig S. EEGLAB: An open source toolbox for analysis of single-trial EEG dynamics. Journal of Neuroscience Methods. 2004;134:9–21. doi: 10.1016/j.jneumeth.2003.10.009. [DOI] [PubMed] [Google Scholar]
- Desimone R, Duncan J. Neural mechanisms of selective visual attention. Annual Reviews of Neuroscience. 1995;18:193–222. doi: 10.1146/annurev.ne.18.030195.001205. [DOI] [PubMed] [Google Scholar]
- Donchin E. Surprise!… surprise? Psychophysiology. 1981;18:493–513. doi: 10.1111/j.1469-8986.1981.tb01815.x. [DOI] [PubMed] [Google Scholar]
- Donchin E, Coles M. Is the P300 Component a manifestation of context updating. Behavioral and Brain Sciences. 1988;11:357–374. [Google Scholar]
- Duncan-Johnson C, Donchin E. On quantifying surprise: The variation in event-related potentials with subjective probability. Psychophysiology. 1977;14:456–467. doi: 10.1111/j.1469-8986.1977.tb01312.x. [DOI] [PubMed] [Google Scholar]
- Fabiani M, Gratton G, Federmeier K. Event-related brain potentials: Methods, theory, and applications. In: Cacioppo J, Tassinary L, Berntson GG, editors. Handbook of Psychophysiology. New York: Cambridge University Press; 2007. pp. 85–119. [Google Scholar]
- Fisher R. Frequency distribution of the values of correlation coefficients in samples of an indefinitely large population. Biometrika. 1915;10:507–521. [Google Scholar]
- Fox R. Binocular rivalry. In: Regan D, editor. Binocular Vision. New York: MacMillan; 1991. pp. 93–110. [Google Scholar]
- Fox R. Independence between binocular rivalry suppression duration and magnitude of suppression. Journal of Experimental Psychology. 1972;93:283–289. doi: 10.1037/h0032455. [DOI] [PubMed] [Google Scholar]
- Gratton G, Coles M, Donchin E. A new method for off-line removal of ocular artifact. Electroencephalography and Clinical Neurophysiology. 1983;55:468–484. doi: 10.1016/0013-4694(83)90135-9. [DOI] [PubMed] [Google Scholar]
- Gratton G, Kramer AF, Coles MGH, Donchin E. Simulation studies of latency measures of components of the event related brain potential. Psychophysiology. 1989;26:233–248. doi: 10.1111/j.1469-8986.1989.tb03161.x. [DOI] [PubMed] [Google Scholar]
- Hillyard S, Vogel E, Luck S. Sensory gain control (amplification) as a mechanism of selective attention: Electrophysiological and neuroimaging evidence. Philosophical Transactions of the Royal Society of London Series B-Biological Sciences. 1998;353:1257–1270. doi: 10.1098/rstb.1998.0281. [DOI] [PMC free article] [PubMed] [Google Scholar]
- Jasper H. Report of the committee on methods of clinical examination in electroencephalography: 1957. Electroencephalography and Clinical Neurophysiology. 1958;10:370–375. [Google Scholar]
- Jeffreys D, Axford J. Source locations of pattern-specific component of human visual evoked potentials. I. Component of striate origin. Experimental Brain Research. 1972;16:1–21. doi: 10.1007/BF00233371. [DOI] [PubMed] [Google Scholar]
- Kang M, Blake R. An integrated framework of spatiotemporal dynamics of binocular rivalry. Frontiers in Human Neuroscience. 2011;5:88. doi: 10.3389/fnhum.2011.00088. [DOI] [PMC free article] [PubMed] [Google Scholar]
- Keil A, Debener S, Gratton G, Junghöfer M, Kappenman ES, Luck SJ, Luu P, Miller GA, Yee CM. Committee report: Publication guidelines and recommendations for studies using electroencephalography and magnetoencephalography. Psychophysiology. 2014;51(1):1–21. doi: 10.1111/psyp.12147. [DOI] [PubMed] [Google Scholar]
- Koivisto M, Revonsuo A. Event-related brain potential correlates of visual awareness. Neuroscience & Behavioral Reviews. 2010;34:922–934. doi: 10.1016/j.neubiorev.2009.12.002. [DOI] [PubMed] [Google Scholar]
- Kutas M, McCarthy G, Donchin E. Augmenting mental chronometry: the P300 as a measure of stimulus evaluation time. Science. 1977;197:792–795. doi: 10.1126/science.887923. [DOI] [PubMed] [Google Scholar]
- Luck S. An introduction to the event-related potential technique. MIT press; 2014. [Google Scholar]
- Luck S, Woodman G, Vogel E. Event-related potential studies of attention. Trends in Cognitive Sciences. 2000;4:432–440. doi: 10.1016/s1364-6613(00)01545-x. [DOI] [PubMed] [Google Scholar]
- Luck S, Hillyard S, Mouloua M, Woldorff M, Clark V, Hawkins H. Effects of spatial cueing on luminance detectability – psychophysical and electrophysiological evidence for early selection. Journal of Experimental Psychology-Human Perception and Performance. 1994;20:887–904. doi: 10.1037//0096-1523.20.4.887. [DOI] [PubMed] [Google Scholar]
- Mangun G. Neural mechanisms of visual selective attention. Psychophysiology. 1995;32:4–18. doi: 10.1111/j.1469-8986.1995.tb03400.x. [DOI] [PubMed] [Google Scholar]
- Mathewson K, Gratton G, Fabiani M, Beck D, Ro T. To see or not to see: prestimulus alpha phase predicts visual awareness. The Journal of Neuroscience. 2009;29:2725–2732. doi: 10.1523/JNEUROSCI.3963-08.2009. [DOI] [PMC free article] [PubMed] [Google Scholar]
- Melloni L, Molina C, Pena M, Torres D, Singer W, Rodriguez E. Synchronization of neural activity across cortical areas correlates with conscious perception. The Journal of Neuroscience. 2007;27:2858–2865. doi: 10.1523/JNEUROSCI.4623-06.2007. [DOI] [PMC free article] [PubMed] [Google Scholar]
- Meng M, Tong F. Can attention selectively bias bistable perception? Differences between binocular rivalry and ambiguous figures. Journal of Vision. 2004;4(7):539–551. doi: 10.1167/4.7.2. [DOI] [PMC free article] [PubMed] [Google Scholar]
- Miller C, Shapiro K, Luck S. Electrophysiological measurement of the effect of interstimulus competition on early cortical stages of human vision. NeuroImage. 2015;105:229–237. doi: 10.1016/j.neuroimage.2014.10.033. [DOI] [PMC free article] [PubMed] [Google Scholar]
- Norman H, Norman J, Billota J. The temporal course of suppression during binocular rivalry. Perception. 2000;29:831–841. doi: 10.1068/p3085. [DOI] [PubMed] [Google Scholar]
- Polich J. Updating P300: An integrative theory of P3a and P3b. Clinical Neurophysiology. 2007;118:2128–2148. doi: 10.1016/j.clinph.2007.04.019. [DOI] [PMC free article] [PubMed] [Google Scholar]
- Polich J. Neuropsychology of P 300. The Oxford Handbook of Event-Related Potential Components. 2012:159–188. [Google Scholar]
- Rees G. Neural correlates of consciousness. Annals of the New York Academy of Sciences. 2013;1296:4–10. doi: 10.1111/nyas.12257. [DOI] [PMC free article] [PubMed] [Google Scholar]
- Rees G, Kreiman G, Koch C. Neural correlates of consciousness in humans. Nature Reviews Neuroscience. 2002;3:261–270. doi: 10.1038/nrn783. [DOI] [PubMed] [Google Scholar]
- Sergent C, Baillet S, Dehaene S. Timing of the brain events underlying access to consciousness during the attentional blink. Nature Neuroscience. 2005;8:1391–1400. doi: 10.1038/nn1549. [DOI] [PubMed] [Google Scholar]
- Seth A, Izhikevich E, Reeke G, Edelman G. Theories and measures of consciousness: an extended framework. Proceedings of the National Academy of Sciences. 2006;103:10799–10804. doi: 10.1073/pnas.0604347103. [DOI] [PMC free article] [PubMed] [Google Scholar]
- Silverstein BH, Snodgrass M, Shevrin H, Kushwaha R. P3b, consciousness, and complex unconscious processing. Cortex. 2015;73:216–227. doi: 10.1016/j.cortex.2015.09.004. [DOI] [PubMed] [Google Scholar]
- Sirevaag E, Kramer A, Coles M, Donchin E. Resource reciprocity: An event-related brain potentials analysis. Acta Psychologica. 1989;70:77–97. doi: 10.1016/0001-6918(89)90061-9. [DOI] [PubMed] [Google Scholar]
- Squires K, Wickens C, Squires N, Donchin E. The effect of stimulus sequence on the waveform of the cortical event-related potential. Science. 1976;193:1142–1146. doi: 10.1126/science.959831. [DOI] [PubMed] [Google Scholar]
- Sutton S, Braren M, Zubin J, John ER. Evoked-potential correlates of stimulus uncertainty. Science. 1965;150:1187. doi: 10.1126/science.150.3700.1187. [DOI] [PubMed] [Google Scholar]
- Sutton S, Tueting P, Zubin J, John ER. Information delivery and the sensory evoked potential. Science. 1967;155:1436–1439. doi: 10.1126/science.155.3768.1436. [DOI] [PubMed] [Google Scholar]
- Tong F, Engel S. Interocular rivalry revealed in the human cortical blind-spot representation. Nature. 2001;411:195–199. doi: 10.1038/35075583. [DOI] [PubMed] [Google Scholar]
- Tononi G. Consciousness as integrated information: a provisional manifesto. Biological Bulletin. 2008;215:216–242. doi: 10.2307/25470707. [DOI] [PubMed] [Google Scholar]
- Tononi G, Koch C. The Neural Correlates of Consciousness. Annals of the New York Academy of Sciences. 2008;1124:239–261. doi: 10.1196/annals.1440.004. [DOI] [PubMed] [Google Scholar]
- Valle-Inclan F, Hackley S, de Labra C, Alvarez A. Early visual processing during binocular rivalry studied with visual evoked potentials. Neuroreport. 1999;10:21–25. doi: 10.1097/00001756-199901180-00004. [DOI] [PubMed] [Google Scholar]
- Verleger R, Jaskowski P, Wascher E. Evidence for an integrative role of P3b in linking reaction to perception. Journal of Psychophysiology. 2005;19:165–181. [Google Scholar]
- Vogel E, Luck S. The visual N1 component as an index of a discrimination process. Psychophysiology. 2000;37:190–203. [PubMed] [Google Scholar]
- Vogel E, Luck S, Shapiro K. Electrophysiological evidence for a postperceptual locus of suppression during the attentional blink. Journal of experimental psychology: Human perception and performance. 1998;24:1656–1674. doi: 10.1037//0096-1523.24.6.1656. [DOI] [PubMed] [Google Scholar]
- Walker P, Powell D. Sensitivity of binocular rivalry to changes in the nondominant stimulus. Vision Research. 1979;19:247–249. doi: 10.1016/0042-6989(79)90169-x. [DOI] [PubMed] [Google Scholar]
- Wales R, Fox R. Increment detection thresholds during binocular rivalry suppression. Perception & Psychophysics. 1970;8:90–94. [Google Scholar]