Abstract
Public resources need to be appropriately annotated with metadata in order to make them discoverable, reproducible and traceable, further enabling them to be interoperable or integrated with other datasets. While data-sharing policies exist to promote the annotation process by data owners, these guidelines are still largely ignored. In this manuscript, we analyse automatic measures of metadata quality, and suggest their application as a mean to encourage data owners to increase the metadata quality of their resources and submissions, thereby contributing to higher quality data, improved data sharing, and the overall accountability of scientific publications. We analyse these metadata quality measures in the context of a real-world repository of metabolomics data (i.e. MetaboLights), including a manual validation of the measures, and an analysis of their evolution over time. Our findings suggest that the proposed measures can be used to mimic a manual assessment of metadata quality.
Keywords: metadata quality, data sharing, ontologies, specificity, coverage
1. Introduction
Scientific discovery is increasingly becoming dependent on larger volumes of data, potentially from multiple and heterogeneous sources, in a variety of languages, produced by different methods, with high variance in quality and in the confidence others attribute to the data [1]. For example, two datasets on the same disease outbreak could provide details with distinct granularity (e.g. one reporting the country where the disease started, the other reporting the city; one reporting the month, the other the day and hour of patient zero detection; one reporting the population percentage with symptoms, the other discriminating between sub-populations based on gender, job, income etc.). This disparity hinders proper integration of the various data sources and thus reduces the speed at which research can be translated into innovation and actual consumer-ready products.
In this manuscript, we focus on the need for having appropriate public annotated metadata resources, and propose automatic mechanisms to measure the quality of metadata. This work is an extension of the previously published article [2], which is focused on the tool that implements the measures. This extension provides a wider discussion on metadata use in scientific research (Section 2) and an additional discussion on data-sharing policies (Section 3). We also include a broader evaluation of our metadata quality measures by including a manual validation of the measures and an additional analysis to the evolution of the measurements over time (Sections 4 and 5).
2. Metadata and Their Use in Science
Public data sharing, ideally via a uniform access interface, is one of the mechanisms through which teams have access to the results of external research. However, this can only be successfully achieved when data is categorised and organised in such ways as to allow efficient discovery and retrieval of information. Even access to previous results within the same research team benefits from proper categorization, as sometimes scientists cannot recover the data associated with their own publications [3].
Furthermore, given the need for reproducibility in science as a means of validating the results, it is paramount that scientific discoveries can be accurately reproduced and independently verified. However, there is an increasing concern regarding the robustness, rigour and validity of research data: there is a serious “reproducibility crisis” in contemporary science [4], [5], [6], [7], [8], which stems from failure to adhere to good scientific practice and the increasing incentives or merit to publish in quantity rather than in quality [9].
To mitigate and eventually solve this problem, it is important that published scientific data is properly described with accompanying metadata. For example, metadata can describe the content of a resource and, in some cases, stands on behalf of the resource itself. The classical example that has been used to explain the nature of metadata and its purpose is the story of Galileo Galilei’s observations of Jupiter’s moons: each night, Galilei drew schematic diagrams of Jupiter’s moons, annotating each observation with the data, weather, telescope properties, methods, analysis and conclusions [3]. Understanding these metadata is essential to understand the observations and to accurately draw the conclusion that the moons actually orbit Jupiter.
A more recent example of how quality of metadata is essential is the work of Choi and Kim which introduces ComPath, a data processing tool that finds biological pathways in genomes [10]. Since pathways in different organisms are not identical, identifying a specific pathway requires information systems for reconstructing, annotating, and analyzing biological pathways. ComPath uses the metadata associated with pathways to detect similarities and thus determine the presence/absence of a pathway in a genome.
Another example is the work of Talcott, which provides a language for representing the signaling state of a cell and its components [11]. This language provides querying facilities over statements about signal propagation, and uses metadata to find, for example, the events in which a given protein might participate.
The above examples show the benefits of annotating observations with appropriate metadata. In modern times, categorising and organising data is even more important, as the metadata can be used to retrieve data from public repositories. For example, a meta-analysis on a certain subject (a disease, a methodology etc.) can only be accurate if the authors of the analysis can be confident that they found all the studies on that subject, and that can only happen if search engines (like PubMed or Google Scholar) can find these studies. While text-based search can provide most of the necessary publications, shortcomings of this method do exist (the existence of synonyms reduces the recall of a search, while homonyms reduce the precision); therefore, methods that are more content- and meaning-aware must be used. Other examples include the retrieval of studies of a certain metabolic pathway carried out on a specific species, or the retrieval of data associated with a certain disease (symptoms, treatments etc.).
Metadata can also be used to describe the processes by which the data was found: where the data was collected from, how it was collected, by whom and when, how it was processed (which procedures, software and methodologies were used), where it was stored etc. This gives data users the ability to trace the data back to its origins, and to evaluate whether the data has been correctly processed to be used according to their own needs.
Finally, metadata allows automatic or semi-automatic integration of data from different sources, as the data can be properly reasoned about. This also improves the availability of data for meta-analyses, as mentioned above, as it allows data consumers to use a large dataset collected from multiple sources. To further allow this goal, it is important to store metadata in a machine-readable format, while keeping its semantics. For example, a resource about diplopia is related to a resource about double vision (the two are synonyms), but automatic methods can only detect this if they are instructed about this synonymy. Also, they are both related to resources about vision symptoms, a generic concept that subsumes the other two categories.
In the area of biomedical research, it is increasingly frequent to leverage on ontologies as source of semantic. The term ontology originated in philosophy, where it means the study of the things that exist and the ways they relate to one another. From an information science point of view, one of the first uses of the term ontology was proposed by McCarthy [12] in the Artificial Intelligence literature. In this point of view, an ontology is a particular organization of the knowledge about a specific domain (e.g. diseases, symptoms, anatomy etc.), which includes both a set of the concepts relevant for that domain and the relationships that exist between those concepts. Being computational artefacts, ontologies provide a machine-readable meaning to the concepts of a domain of knowledge.
The fact that ontologies are often used to provide an objective meaning to digital resources concerning specific research domains lead to some biomedical ontologies being considered the standard representation of knowledge for those domains within the scientific community [13]. Common knowledge encoded in an ontology includes: synonymy, subsumption and even other relationships, such as the fact that diplopia is a symptom related to the eyes. Ontologies, therefore, offer several benefits: e.g. automatic methods can leverage on the meaning behind metadata to detect related resources and even compile lists of resources on a given subject, organise them in meaningful groups and categories, and ultimately deal with integrating resources from disparate sources and even using different languages [14]. Another example is Google’s knowledge graph [15], [16], which enriches a search result by providing disambiguation, topic summary, and links to related resources.
3. Data-Sharing Policies
To ensure good quality metadata, we need data-sharing policies, compliance and enforcement activities that reward data owners when they annotate their data with appropriate metadata. To this effect, there has been a recent effort from publishers, funders and scientists to implement standards that manage metadata. Several publications propose the creation of standards regarding the publication of scientific work, especially when they draw conclusions based on large volumes of data. For example, a paper from 2004 advocates the use of standards for “omics” science [17]: among others, it quotes MIAME, the Minimal Information About a Microarray Experiment [18], as a successful example of a standard for data publication in genetics, which is at its core a set of metadata items regarded by the community as the minimal information needed to interpret the results of microarray experiments and to reproduce them.
The work of the metabolomics standards initiative (MSI) [19], created by the community in 2004–2006, resulted in the publication of yet another set of recommendations on minimal reporting standards, such as the minimum reporting standards for chemical analysis [20], the minimum reporting standards for data analysis in metabolomics [21] etc., summarized in [22]. Since 2007, several other initiatives have been set up to address standardisation in metabolomics, such as the COSMOS project (COordination Of Standards In MetabOlomicS, http://www.cosmos-fp7.eu) aimed to coordinated data standards efforts amongst database providers, ontologists, software engineers and instrument vendors towards open access data standardization [23].
Other standards have been brought into existence by various data societies in the biomedical panorama: the Harmonized guidelines for single-laboratory validation of methods of analysis [24], the minimal information about a spinal cord injury experiment [25], among many others. All these works and proposals show that the idea of settings standards for how to report findings and data in general is not new, and is both needed and wanted by the community.
Nevertheless, scientific publications often fail to adhere to these standards. A news article published in Nature in 2011 [26], mentions that (i) “adherence to data-sharing policies is as inconsistent as the policies themselves”; (ii) “looking at […] 351 papers covered by some data-sharing policy, only 143 fully adhered to that policy”; (iii) “sharing data is time-consuming to do properly”; and (iv) “the reward systems aren’t there”. Indeed, “more often than scientists would like to admit, they cannot even recover the data associated with their own published works” [3].
There is a lack of reward mechanisms to enforce (or at least help enforce) these standards. For instance, prominent journals should only accept papers supported by data that is stored in a public repository and which is annotated with high-quality metadata. The repositories themselves could reward data owners by sorting the studies and resources by some metadata quality measure and showing the high-quality ones first in their search functionalities. There are even proposals to reward data and data quality with tangible and transferable goods, such as Knowledge Coins [1] or money [27].
The actual reward mechanisms to implement are outside the scope of this paper. However, they would benefit greatly from objective measures of metadata quality [28].
4. Methodology
Given the current scope just exposed, the intent of this work is the proposal of objective measures of metadata quality and their application in a real world scenario. We will base our measurements in the metadata annotations that use ontology concepts. The main goal of such measures is to facilitate the work of manual dataset curators by providing an extra step in the curation pipeline. Furthermore, by automatically evaluating the quality of metadata, we can quickly let data owners know whether their metadata can be improved during the submission process, which will hopefully compel the data owners to improve the quality of their submission by, e.g. choosing ontology concepts instead of textual terms, or choosing more informative concepts than the ones being used initially.
Our approach has already been described previously [2], and we recommend interested readers to refer to that publication for further details. Here we focus only on the measurements of metadata quality, and not on the tool that implements them.
4.1. Term Coverage
Usually, a metadata file contains both ontology concepts and natural language terms. Since data sharing relies on the ability to find and retrieve information with automatic tools, ensuring metadata is expressed with ontology concepts improves its potential for being found in the future. As explained above, this also enables automatic reasoning, which can, e.g. improve the results of automatic retrieval techniques by leveraging on the meaning of the annotation rather than its syntactical form.
The first measure of metadata quality, therefore, is term coverage. It is the ratio between the number of annotations that refer to ontology concepts and the total number of annotations in the metadata file.
4.2. Semantic Specificity
Ontology concepts are not all equally specific. For example, the concept vision symptom mentioned earlier is less specific than double vision. More specific concepts have a higher information content and thus contribute with more knowledge to the metadata. As such, we use semantic specificity, a measure that reflects the average specificity of the concepts in the metadata file. Concepts with low specificity are weak descriptors of the contents of the resource: a more specific descendant concept would be a better descriptor, since it would provide a more specific semantics to the resource and thus increase its potential for future integration.
5. Real-World Use Case
To validate our measures, we applied them to the entire MetaboLights dataset, a database of metabolomics experiments and derived information [29], [30] at two different time points. Metabolomics is the study of the chemical processes that occur in life-related contexts, usually within a cell or in its surroundings. This data often refers to a large number of scientific domains, as it can be cross-species and cross-technique, while covering metabolite structures, biological roles, locations and concentrations, as well as experimental factors.
MetaboLights stores metadata associated with the experimental data describing the information in each resource. For example, the metadata of the resource called “LCMS analysis of seven apple varieties with a leaking chromatographic column” claims that the data was collected through “liquid chromatography” and “mass spectroscopy”, and that the study factors include “Sample type”, “Apple number” etc. (see www.ebi.ac.uk/metabolights/MTBLS99). Such metadata are collected by the data owner, and subsequently modified and/or added by a curator, using the ISACreator software from the ISA-tools suite [31], which has the built-in ability to refer to ontology concepts and link them with the metadata.
We conducted our validation in two different moments: at April 2016, when the repository had 161 resources (public datasets), and at July 2017, when it had 264 resources (public datasets). The main purpose of this two-phase validation is to assess whether the measures can detect the expected increase in the quality of metadata.
5.1. General Statistics
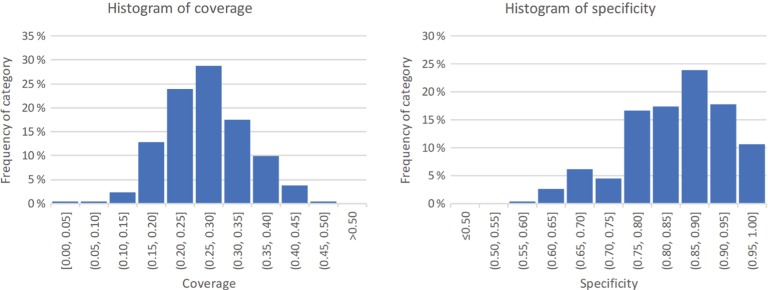
All the 264 resources included in the MetaboLights dataset were annotated with concepts from one or more ontologies. The coverage values of the annotated resources ranged from 0.03 to 0.46, with an average of 0.27 and standard deviation of 0.070. The specificity values ranged from 0.59 to 1.00, with an average of 0.84 and standard deviation of 0.089. The distribution of values is shown in Figure 1.
Figure 1:
The histograms for the distribution of the two measures of metadata quality in MetaboLights. On the left, the distribution for term coverage; on the right, the distribution for semantic specificity. Data calculated based on the 2017 dataset.
From the 604 distinct ontology concepts found in the metadata files, we were able to determine semantic specificity value of 210, about 35 %. Although this may seem a small amount, and can potentially be regarded as a limitation of our measure, these concepts correspond to 68 % of all the annotations. Furthermore, the low value may result from the use of non-standard ontology identifiers in the resources (for example, although OBI identifiers are left-padded with 0’s, ChEBI identifiers are not, and if the submitter does not ensure that the identifiers are correct, they will be incorrectly identified). Additionally, for technical reasons, our tool uses a subset of all the ontologies used to annotate the metadata files [2].
5.2. Dependency between the Two Measures
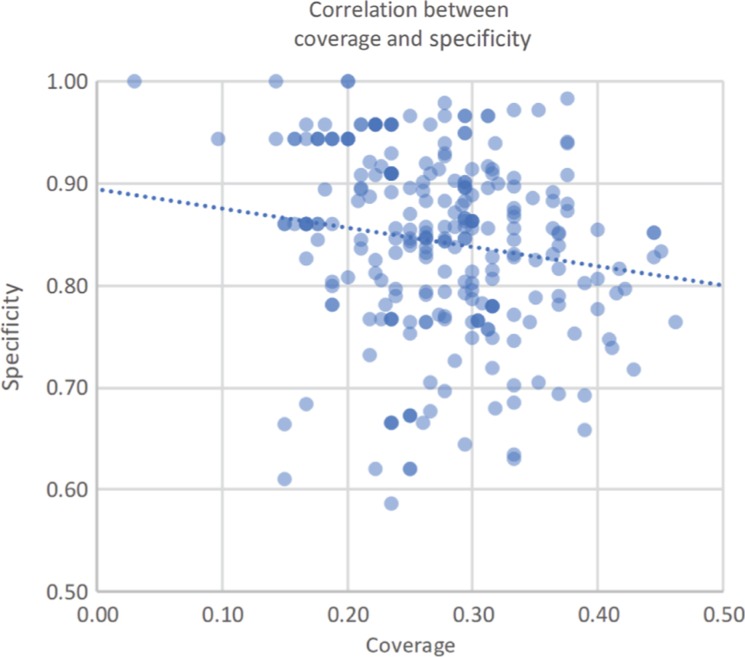
There is a small negative correlation between the two measurements (see Figure 2). While we could calculate Pearson’s correlation coefficient, it would only be significant if the two measurements are normally distributed, statistically speaking. While the coverage measure seems to follow a normal distribution, specificity does not (tested with the Shapiro-Wilk test, which gives p-value of 0.14 for coverage and 6.3 × 10⁻⁶ for specificity). Therefore, we calculated the significance of the correlation between the two measurements using Spearman’s non-parametric correlation coefficient. There was a statistically significant negative correlation between coverage and specificity (Spearman’s coefficient = −0.25, p-value = 1.4 × 10⁻⁵). This trend is only slightly negative, at best, even if statistically significant. Nonetheless, we argue that this may be related to the fact that the tasks of (i) looking for the most specific concept to use in the annotation and (ii) finding all the locations in the metadata file where an ontology concept can be used take time and thus cannot both be performed perfectly due to time constraints.
Figure 2:
The correlation between the coverage and specificity measures in all the MetaboLights resources. The dotted line shows the slight negative trend between the two measures.
5.3. Differences between the Two Snapshots
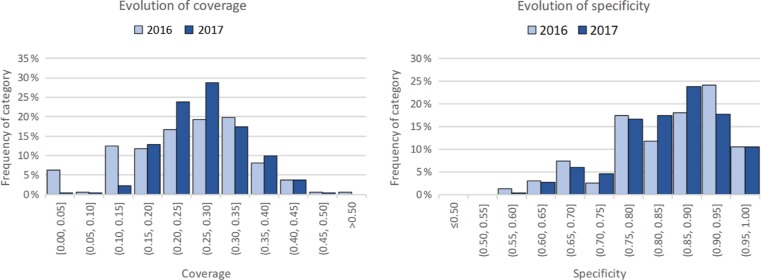
The results in the previous section report the statistics from the current state of the dataset. Given our two-phase approach in measuring quality, we can now report on the differences between the two time points. Table 1 shows the statistics calculated for the two snapshots, and Figure 3 shows the evolution in the distribution of these values.
Table 1:
The statistics for the two measurements of metadata quality in MetaboLights.
| Coverage |
Specificity |
|||
|---|---|---|---|---|
| 2016 | 2017 | 2016 | 2017 | |
| Minimum | 0.00 | 0.03 | 0.00 | 0.59 |
| Maximum | 0.67 | 0.46 | 1.00 | 1.00 |
| Average | 0.25 | 0.27 | 0.81 | 0.84 |
| SD | 0.11 | 0.07 | 0.19 | 0.09 |
| Median | 0.26 | 0.28 | 0.86 | 0.86 |
Figure 3:
The evolution in the distribution of the two measurements of metadata quality in MetaboLights. On the left, the distributions for term coverage; on the right, the distribution for semantic specificity. The light blue represents data from the 2016 dataset and the dark blue from the 2017 dataset.
The table shows that, in general, the computed values for the measures did not change significantly between the two moments, apart from the following:
an increase in the minimum specificity value,
a decrease in the maximum coverage value,
a general decrease in the standard deviation of both measures, and
a slight increase in the average values for both measures.
Despite these changes, we argue that the general metadata quality did not change significantly from the first moment to the second, as the increase in average and median values is small.
While these values compare the general statistics for the two datasets (the 2016 dataset with 161 resources and the 2017 dataset with 264 resources), it is relevant to study the evolution of the resources that exist in both versions of the datasets. The relevant numbers to report are the average of coverage, which was 0.29 on the 2017 dataset, and the average specificity, which was 0.83 on the 2017 dataset. These both correspond to a slight increase compared to the values for the 2016 dataset. Using a paired two-sample t-test to measure the significance of the changes in coverage and specificity, we learn that the increase in coverage was significant (p-value = 2.6 × 10⁻⁶) but that the difference in specificity was not (p-value = 0.09). Furthermore, while the average specificity has increased, the median decreased slightly (from 0.86 to 0.85), with a p-value = 0.04 (as measured with a Wilcoxon Signed-Rank Test for paired samples). This finding is in line with the slight negative correlation between the two measurements.
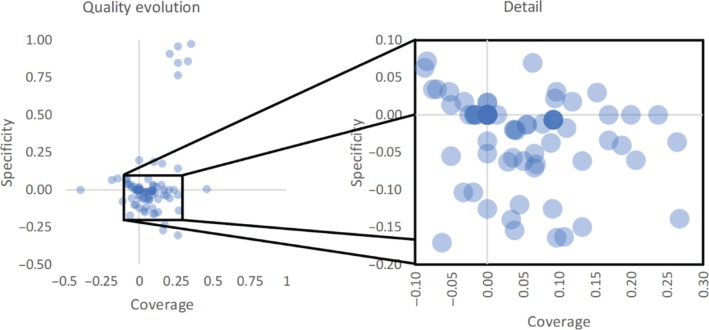
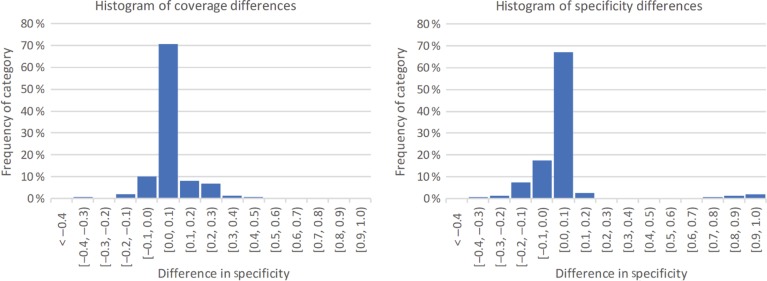
Figure 4 plots the changes in coverage and specificity for each of the resources across both datasets. Overall, the changes have a small absolute value (Figure 5 shows the distribution of these changes). However, in general the plot does show the tendency to an increase in coverage. In fact, in 34 % of the resources, coverage values increased, while only 17 % of the resources experienced and increase in specificity. Furthermore, in 64 % of the resources none of the measures decreased. The zoomed detail allows us to see more clearly the tendency for an increase in coverage associated with a decrease in specificity. This finding is also in line with the slight negative correlation between the two measurements.
Figure 4:
Plot showing the differences between coverage and specificity values for the resources in both versions of the dataset. On the left, we see the overall evolution of the two measures, and on the right a detail of the same plot showing a magnified region. The detail shows 143 of the 161 resources, or about 88 %.
Figure 5:
Histograms showing the distribution in coverage (on the left) and specificity (on the right) changes in the resources that are in both versions of the datasets.
Overall, we can state that there was a slight but significant increase in the quality of the metadata, as measured by our two measures, which is in accordance to the fact that there are curators in the MetaboLights team responsible for improving the metadata of the resources over time.
5.4. The Annotation Effort
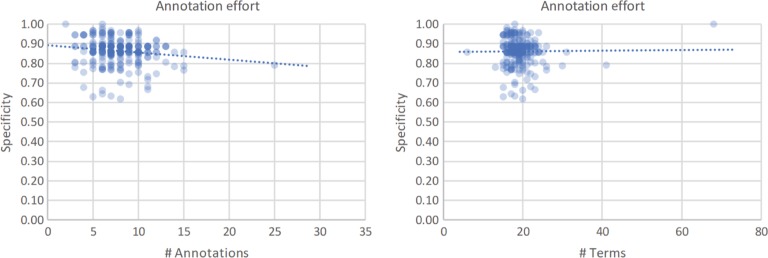
Given that annotating a resource is a time-intensive task, and still not properly rewarded by the community, it is not surprising to see that the effort dedicated to the annotation process is in some way correlated with the number of annotations put into the metadata. We have previously seen (Figure 2) that researchers, data owners and curators must divide their time between providing good annotations (by choosing specific concepts) balanced against providing a larger number of annotations (by converting more text terms into actual ontology concepts). It is also interesting to notice that for larger numbers of annotations, the average specificity of those annotations decreases, as illustrated in Figure 6. One way to measure the effort dedicated into the annotation of MetaboLights is the correlation between the absolute number of annotations and their specificity. Figure 6 shows a negative trend (Spearman’s coefficient = −0.14, p-value = 0.014), which is in line with the trend between coverage and specificity.
Figure 6:
The correlation between specificity of a resource and the number of annotations using ontology concepts (left) or the total number of text terms (right) in that resource.
Interestingly, the correlation between number of terms and specificity is weaker than the correlation presented earlier (Spearman’s coefficient = −0.10, p-value = 0.048). This means that, despite larger studies requiring more metadata to be fully descriptive, the specificity of the ontology concepts chosen by the annotator (data owner or curator) does not significantly decrease when the annotation effort increases.
5.5. Correlation with Manual Quality Assessment
A final experiment that we carried out with our quality measures was the study of how well they can mirror a manual assessment of resource quality. We created three sets of quality-based rankings of MetaboLights resources. The first set contained 23 studies performed on the Homo sapiens species; the second one contained 11 studies on Arabidopsis thaliana; and the third contained 14 studies from the Mus musculus species. These sets were ordered from highest to lowest metadata quality by manual curation assessment, based on compliance with metabolomics minimal reporting information metadata [19].
To understand the relationship between the human evaluation of quality and our two objective automatic measures, we used a quality score calculated as the weighted average of both measures (coverage and specificity):
| (1) |
With this unique value we can create automatic rankings and then compare them. There are several possible measures to compare the correlation between two rankings. We choose to report Spearman’s and Kendall’s coefficients to report this correlation. Both take into account ties in the rankings. While Spearman’s correlation coefficient is more sensitive to big changes in the ranks (for example, if one study is the first in the manual ranking and the last in the automatic one, there will be a larger difference in Spearman’s coefficient than in Kendall’s coefficient compared to the situation where the first item only swaps with the second one). Both coefficients can take values from 1.0 (when the rankings fully agree) to −1.0 (when the rankings are exactly the opposite of one another). A value of 0.0 means that there is no similarity between the two rankings.
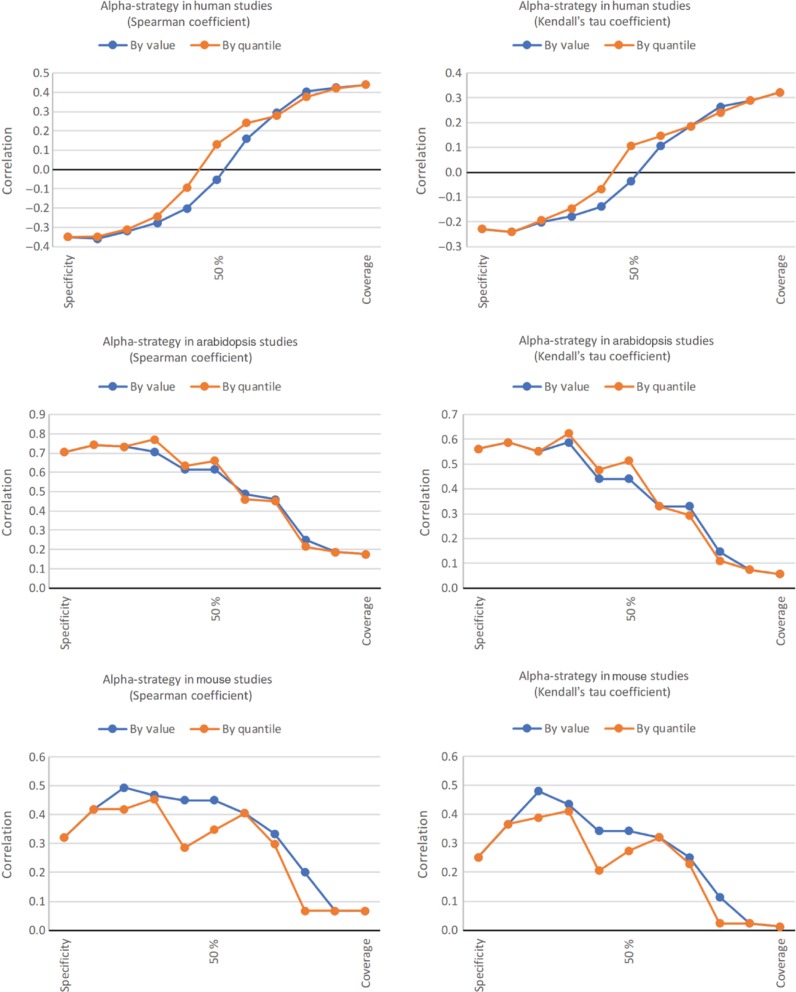
We vary α from 0.0 to 1.0 in steps of 0.1, thus producing automatic rankings that take into consideration varying amounts of the two measures. Because the two measures display different statistical properties (coverage is centred around the mean value 0.28 and specificity around 0.84, with different distributions, see Figure 1), we also performed this analysis by using not the absolute values of the measures but instead their quantiles (which by definition have a uniform distribution from 0.0 to 1.0 centred around the mean 0.5). The results are illustrated in Figure 7.
Figure 7:
Correlation between the manual rankings and the automatic ones. This figure includes the results for the Homo sapiens rankings (top), the Arabidopsis thaliana rankings (middle), and the Mus musculus rankings (bottom). On the left, we illustrate the Spearman’s ρ correlation coefficient; on the right the Kendall’s τ coefficient. On each graph, the α value runs from 0.0 to 1.0 in steps of 0.1, where 0.0 corresponds to a ranking based solely on the Specificity measure, and 1.0 corresponds to a ranking based solely on the Coverage measure. The midpoint is labelled 50 %.
The first observation extracted from these results is that the general behaviour is independent of the actual correlation coefficient used (Spearman’s or Kendall’s), and also independent of whether we use absolute values or quantiles.
We observe three distinct behaviours: for the first ranking (Homo sapiens), the manual ranking is closer to the automatic ranking calculated based solely on coverage. In fact, by using specificity alone we obtain a negative correlation coefficient. We believe that this happens because in the subgroup of human studies, the correlation between the two measures is stronger (the p-value associated with the Spearman’s correlation coefficient is 3.1 × 10⁻⁷, lower than the 1.4 × 10⁻⁵ for the whole dataset), thus becoming more difficult to use a mixture of coverage and specificity as a measure of quality. It is also the subgroup presenting the lowest maximum correlation between manual and automatic rankings.
The Arabidopsis thaliana subgroup exhibits the opposite behaviour: the automatic rankings using specificity alone have a higher correlation with the manual rankings than the ones using a mixture of both measures. This may be related to the fact that the Arabidopsis studies have an overall good metadata quality. For example, they have a higher coverage and specificity than average (0.30 and 0.87 respectively, higher than the 0.27 and 0.84 for the whole dataset). They also have a lower standard deviation for coverage (0.067), which makes it more difficult to use this measure to assess quality. It is interesting to notice that in this subgroup, the correlation between the two quality measures is not significant (p-value = 0.17).
Finally, in the Mus musculus studies, the best correlation between manual and automatic rankings is achieved when using a mixture of the two measures, namely 80 % specificity and 20 % coverage. As in the previous subgroup, the correlation between the two measures is not highly significant (p-value = 0.03, below the usual significance value of 0.05 but still higher than the same statistic for the whole dataset). It is not obvious from our perspective why there is a “dent” in the graph showing the correlation for the ranking using quantiles, but we suspect it may be related to the fact that its size is relatively small (14 resources).
Overall, we conclude that our measures approximate, to an extent, what human curators define as quality. In some subgroups this approximation is better than in others, as expected. In all cases, there is an α value for which the Spearman’s correlation coefficient is higher than 0.44. It is interesting to notice that the contributions of the two automatic measures are not always the same when deriving a single quality score, and the weights attributed to each depend on the profiles of the subgroup where it is applied. How to calculate in advance the best α for a given subgroup is still a work in progress, and in the future we may formulate this as an optimization problem that can be solved by current techniques using a larger amount data.
6. Future Work
In order to fully support the use of metadata quality indicators as part of data-sharing reward mechanisms, it is necessary that the work presented here is extended in at least two different ways:
We intend to apply this methodology to other areas of research. First, to areas where data-sharing policies already exist, which can serve as a baseline that allows us to further ensure the suitability of the metadata quality measures in those areas; and then to the other areas, e.g. the semantic web in general. For example, it would be interesting to be able to automatically identify Wikipedia articles whose infoboxes can be improved.
The second extension is the implementation of more quality measures, either by improving the existing ones or proposing new ones. For example, we envisage the creation of measures that align with the existing minimal information standards (see Section 3), or the introduction of weights in the term coverage measure to increase the influence of mandatory metadata fields over optional ones. Eventually, the idea is to make an automatic quality score that totally reflects a manual notion of metadata quality as assessed by curators.
We propose here two suggestions to improve the measurements of metadata quality. The first is to leverage on the resource’s status and/or its history: a manually curated resource can be regarded as having higher quality than the one without a manual curation step; additionally, a resource whose metadata changes too frequently can be assigned low confidence by the community. The second proposal is determining whether an ontology concept is appropriate to annotate a given metadata field. For example, if over the entire dataset, one metadata field is exclusively annotated with concepts from one ontology, then an annotation in that field with a concept from another ontology can be regarded as having low quality.
We also suggest as future work studying the relative contribution of each automatic measure when deriving a unique quality score. Our current understanding is that the contribution of a measure should be tied to the standard deviation of that measure in the relevant subgroup, but further research needs to be done in this front.
7. Discussion
Given the current practices in scientific discovery and dissemination, and especially the large volumes of data being produced and consumed by the researchers and organisations in the Life Sciences and the Health field, the need for proper data annotation and metadata publication is increasing [32].
The work we present here is based on a previously published tool, the Metadata Analyser [2] that proposes the use of two measures of metadata quality to analyse public data. We applied the Metadata Analyser to the MetaboLights dataset using two time snapshots: one from 2016 and another from 2017.
The main conclusion of our work is that the automatic measures effectively assess the quality of the semantic annotation of digital resources. This includes the annotation of a resource’s metadata with explicit references to concepts from ontologies accepted by the community as machine-readable, standard representations of a domain of knowledge.
The lack of proper annotation in scientific data is many times more about social issues than technical ones [1]: metadata files are usually compiled by the authors of the data, who (i) may not know the ontologies that contain the concepts they need, (ii) do not fully know the structure of the ontologies in order to perform annotation with the appropriate specific terms, (iii) lack the proper skills to carry on the annotation process because of the technical difficulties associated with this task, (iv) do not consider data sharing to be relevant, or (v) consider that the cost of ensuring proper semantic integration outweighs the benefits. Here we show a lack of effort from data providers to use ontology concepts throughout the whole extension of a metadata file, even if there is a tendency to use specific concepts, in the few cases where ontology concepts are used. This suggests that the perceived benefits associated with semantic annotation may still not significantly counterbalance its cost. While the short-term solution is to leverage on curators to help increase metadata quality, in a long-term scenario we wish to empower data creators with a means to measure the quality of their metadata, who would use this feedback to improve metadata quality and thus enhance the integration potential of their data for future use.
Acknowledgement
This work was supported by FCT through funding of the LaSIGE Research Unit, ref. UID/CEC/00408/2013 and MRC UK MEDical BIOinformatics partnership, grant number MR/L01632X/1
Conflict of interest statement:
Authors state no conflict of interest. All authors have read the journal’s publication ethics and publication malpractice statement available at the journal’s website and hereby confirm that they comply with all its parts applicable to the present scientific work.
References
- [1].Couto FM. Rating, recognizing and rewarding metadata integration and sharing on the semantic web. Proceedings of the 10th international conference on uncertainty reasoning for the Semantic. 2014;Web-Volume 1259:67–72. [Google Scholar]
- [2].Inácio B, Ferreira JD, Couto FM. In: 11th International Conference on Practical Applications of Computational Biology & Bioinformatics. Fdez-Riverola F, Mohamad MS MS, Rocha M M, De Paz JF, et al., editors. Cham: Springer International Publishing; 2017. Metadata analyser: measuring metadata quality; pp. 197–204. Available from: [DOI] [Google Scholar]
- [3].Goodman A, Pepe A, Blocker AW, Borgman CL, Cranmer K, Crosas M. et al. Ten simple rules for the care and feeding of scientific data. PLoS Comput Biol. 2014;10:e1003542. doi: 10.1371/journal.pcbi.1003542. [DOI] [PMC free article] [PubMed] [Google Scholar]
- [4].Ioannidis JP. Why most published research findings are false. PLoS Med. 2005;2:e124. doi: 10.1371/journal.pmed.0020124. [DOI] [PMC free article] [PubMed] [Google Scholar]
- [5].Steckler T. Preclinical data reproducibility for R&D-the challenge for neuroscience. SpringerPlus. 2015;4:1. doi: 10.1186/2193-1801-4-1. [DOI] [PMC free article] [PubMed] [Google Scholar]
- [6].Prinz F, Schlange T, Asadullah K. Believe it or not: how much can we rely on published data on potential drug targets? Nat Rev Drug Discov. 2011;10:712. doi: 10.1038/nrd3439-c1. [DOI] [PubMed] [Google Scholar]
- [7].Begley CG, Ellis LM. Drug development: raise standards for preclinical cancer research. Nature. 2012;483:531–3. doi: 10.1038/483531a. [DOI] [PubMed] [Google Scholar]
- [8].Peng R. The reproducibility crisis in science: a statistical counterattack. Significance. 2015;12:30–2. [Google Scholar]
- [9].Begley CG, Ioannidis JP. Reproducibility in science. Circ Res. 2015;116:116–26. doi: 10.1161/CIRCRESAHA.114.303819. [DOI] [PubMed] [Google Scholar]
- [10].Choi K, Kim S. ComPath: comparative enzyme analysis and annotation in pathway/subsystem contexts. BMC Bioinf. 2008;9:145. doi: 10.1186/1471-2105-9-145. [DOI] [PMC free article] [PubMed] [Google Scholar]
- [11].Talcott C. Bioinformatics and biomedicine (BIBM), 2016 IEEE international conference on. IEEE. 2016. The Pathway Logic formal modeling system: diverse views of a formal representation of signal transduction; pp. 1468–1476. [Google Scholar]
- [12].McCarthy J. Circumscription a form of non-monotonic reasoning. Artif Intell. 1980;13:27–39. [Google Scholar]
- [13].Noy NF, McGuinness DL. Ontology development 101: a guide to creating your first ontology. Stanford knowledge systems laboratory technical report KSL-01-05 and Stanford medical informatics technical report SMI-2001-0880. Stanford, CA: 2001. [Google Scholar]
- [14].Campos L, Pedro V, Couto F. Impact of translation on named-entity recognition in radiology texts. Database. 2017;2017:bax064. doi: 10.1093/database/bax064. [DOI] [PMC free article] [PubMed] [Google Scholar]
- [15].Singhal A. Introducing the knowledge graph: things, not strings. [1 July 2017];Official Google Blog. 2012 [Google Scholar]
- [16].Knowledge Graph. Knowledge Graph — Wikipedia, The Free Encyclopedia. 2017. [Online; accessed 2017, July 20]. Available from: https://en.wikipedia.org/wiki/Knowledge_Graph.
- [17].Quackenbush J. Data standards for’omic’science. Nat Biotechnol. 2004;22:613–4. doi: 10.1038/nbt0504-613. [DOI] [PubMed] [Google Scholar]
- [18].Brazma A, Hingamp P, Quackenbush J, Sherlock G, Spellman P, Stoeckert C. et al. Minimum information about a microarray experiment (MIAME) – toward standards for microarray data. Nat Genet. 2001;29:365–71. doi: 10.1038/ng1201-365. [DOI] [PubMed] [Google Scholar]
- [19].Fiehn O, Robertson D, Griffin J, van der Werf M, Nikolau B, Morrison N. et al. The metabolomics standards initiative (MSI) Metabolomics. 2007;3:175–8. [Google Scholar]
- [20].Sumner LW, Amberg A, Barrett D, Beale MH, Beger R, Daykin CA. et al. Proposed minimum reporting standards for chemical analysis. Metabolomics. 2007;3:211–21. doi: 10.1007/s11306-007-0082-2. [DOI] [PMC free article] [PubMed] [Google Scholar]
- [21].Goodacre R, Broadhurst D, Smilde AK, Kristal BS, Baker JD, Beger R. et al. Proposed minimum reporting standards for data analysis in metabolomics. Metabolomics. 2007;3:231–41. [Google Scholar]
- [22].Goodacre R. Water, water, every where, but rarely any drop to drink. Metabolomics. 2014;10:5–7. [Google Scholar]
- [23].Salek RM, Neumann S, Schober D, Hummel J, Billiau K, Kopka J. et al. COordination of Standards in MetabOlomicS (COSMOS): facilitating integrated metabolomics data access. Metabolomics. 2015;11:1587–97. doi: 10.1007/s11306-015-0810-y. [DOI] [PMC free article] [PubMed] [Google Scholar]
- [24].Thompson M, Ellison SL, Wood R. Harmonized guidelines for single-laboratory validation of methods of analysis (IUPAC Technical Report) Pure Appl Chem. 2002;74:835–55. [Google Scholar]
- [25].Lemmon VP, Abeyruwan S, Visser U, Bixby JL. Facilitating transparency in spinal cord injury studies using data standards and ontologies. Neural Regen Res. 2014;9:6. doi: 10.4103/1673-5374.125322. [DOI] [PMC free article] [PubMed] [Google Scholar]
- [26].Corbyn Zoë. Researchers failing to make raw data public. Nature. 2011 doi: 10.1038/news.2011.536. [DOI] [Google Scholar]
- [27].Knuteson B. The solution to science’s replication crisis. 2016 arXiv preprint arXiv:160903223. [Google Scholar]
- [28].Rocca-Serra P, Salek RM, Arita M, Correa E, Dayalan S, Gonzalez-Beltran A. et al. Data standards can boost metabolomics research, and if there is a will, there is a way. Metabolomics. 2016;12:14. doi: 10.1007/s11306-015-0879-3. [DOI] [PMC free article] [PubMed] [Google Scholar]
- [29].Haug K, Salek RM, Conesa P, Hastings J, de Matos P, Rijnbeek M. et al. MetaboLights – an open-access general-purpose repository for metabolomics studies and associated meta-data. Nucleic Acids Res. 2013;41:781–6. doi: 10.1093/nar/gks1004. [DOI] [PMC free article] [PubMed] [Google Scholar]
- [30].Salek RM, Haug K, Conesa P, Hastings J, Williams M, Mahendraker T. et al. The MetaboLights repository: curation challenges in metabolomics. Database. 2013;2013 doi: 10.1093/database/bat029. Available from: [DOI] [PMC free article] [PubMed] [Google Scholar]
- [31].Rocca-Serra P, Brandizi M, Maguire E, Sklyar N, Taylor C, Begley K. et al. ISA software suite: supporting standards-compliant experimental annotation and enabling curation at the community level. Bioinformatics. 2010;26:2354–6. doi: 10.1093/bioinformatics/btq415. [DOI] [PMC free article] [PubMed] [Google Scholar]
- [32].Barros M, Couto FM. Knowledge representation and management: a linked data perspective. IMIA Yearb. 2016:178–83. doi: 10.15265/IY-2016-022. [DOI] [PMC free article] [PubMed] [Google Scholar]


