Abstract
MicroRNAs (miRNAs) are involved in the post-transcriptional regulation of protein abundance and thus have a great impact on the resulting phenotype. It is, therefore, no wonder that they have been implicated in many diseases ranging from virus infections to cancer. This impact on the phenotype leads to a great interest in establishing the miRNAs of an organism. Experimental methods are complicated which led to the development of computational methods for pre-miRNA detection. Such methods generally employ machine learning to establish models for the discrimination between miRNAs and other sequences. Positive training data for model establishment, for the most part, stems from miRBase, the miRNA registry. The quality of the entries in miRBase has been questioned, though. This unknown quality led to the development of filtering strategies in attempts to produce high quality positive datasets which can lead to a scarcity of positive data. To analyze the quality of filtered data we developed a machine learning model and found it is well able to establish data quality based on intrinsic measures. Additionally, we analyzed which features describing pre-miRNAs could discriminate between low and high quality data. Both models are applicable to data from miRBase and can be used for establishing high quality positive data. This will facilitate the development of better miRNA detection tools which will make the prediction of miRNAs in disease states more accurate. Finally, we applied both models to all miRBase data and provide the list of high quality hairpins.
Keywords: microRNA, machine learning, confidence, high quality, positive data, miRBase, MirGeneDB
1. Introduction
Disease phenotypes largely depend on the expression of genes and on their translation into proteins. MicroRNAs (miRNAs) are short endogenous RNA sequences which are involved in the post-transcriptional modulation of protein abundance [1]. Thereby they have been implicated in many diseases ranging from virus-based ones to cancer [2]. Many miRNAs have been established experimentally since their first detection [3]. Such miRNAs are stored in databases like miRTarBase [4] and miRBase [5]. Experimental detection of miRNAs is convoluted [6] and establishing an effect on the protein level makes the process even more complicated. Therefore, computational methods which detect miRNAs directly from genomic or transcriptomic sequences have been widely applied [7]. Most of the methods for pre-miRNA detection are based in machine learning [7] and thereby need suitable examples for training an effective model. It is known that true negative data is not available [8] and that the confidence in machine learning models based on two-class classification, therefore, is limited [7], [8].
On the other hand, the quality of positive data which usually stems from miRBase has also been questioned [9], [10]. For example, Bartel and colleagues rejected one third of all mammalian miRNAs in miRBase and suggested 20 % new ones [9]. Wang and Liu developed a computational pipeline to filter miRBase entries based on RNA-seq data [10]. They reported a number of inconsistencies in respect to the 3′ and 5′ ends of the mature miRNA and the occurrence of miRNA* in Drosophila melanogaster (61 % accurate, 9.5 % miRNA*, 25 % 3′ variants, and 4.5 % 5′ variants) and Caenorhabditis elegans (86.2 % accurate, 4.8 % miRNA*, 7.8 % 3′ variants, and 1.2 % 5′ variants). Chen and colleagues proposed to use structure and expression to scrutinize miRBase entries. In respect to structure they analyzed the location of the mature miRNAs within its pre-miRNA. Overall, they rejected large percentages of the plant miRNAs in miRBase [11]. Tarver et al. [12] found, using strict criteria (based on Okamura et al. [13], Axtell et al. [13], Kozomara and Griffiths-Jones [14], and Tsutsumi et al. [15], that none of the protist miRNAs similar to plant miRNAs were acceptable under their constraints. Donoghue and colleagues also investigated plant miRNAs [16]. They applied modified criteria by Ambros et al. [17] for the evaluation of about 7000 miRBase entries and found 30 % to be questionable. Peterson and colleagues reported that only 30 % of human entries in miRBase are well supported by using strict criteria [18]. They also point out that the aim of miRBase is not to scrutinize miRNAs, but to register them; which led them to create MirGeneDB which houses filtered (robust) entries from miRBase. Jones-Rhodes cautions that many entries in miRBase could be siRNAs instead of miRNAs [19], which helps explain why they appear in miRBase since their function is similar.
These studies and our previous work [20] used a number of criteria to decide whether a miRBase entry is robust. The complementarity between the two mature sequences (animals first 16 of 22, plants ≤ 4 mismatches) is often used as a criterion but the number of required matches varies. Evidence of expression for both mature sequences is generally required with a lower expected abundance of the miRNA*. The reads that are mappable to the pre-miRNA should further show low heterogeneity and display precise alignment on the 5′ side (precise cleavage). On the 3′ side some studies require a 2 nucleotide overhang between the two mature miRNAs. These rules entail already that both mature miRNAs are within a pre-miRNA and located on the stem. A few studies have additionally required the miRNAs not to match to other non-coding RNAs and/or not to have multiple matches throughout the genome. The latter two criteria are questionable since a miRNA may exist in multiple copies in a genome [21] and because miRNAs can come from any transcription unit [22].
Here we analyzed data from miRBase and MirGeneDB [18] and established how they can be scrutinized to achieve a high confidence filtered positive dataset. To this end, we created a machine learning model using 1000-fold Monte Carlo cross validation with human data from miRBase as positive examples and pseudo hairpins for negative examples. We then applied the model to analyze all pre-miRNAs from MirGeneDB and miRBase. The interesting feature of our model is that with increasing quality of the data the positive prediction rate increases. Therefore, the model appears to be independent of possible false-positive data used in its establishment. We assessed different features to filter positive data from miRBase and used our model to assess how well the data was filtered. This leads to a list of features which are useful to separate the wheat from the chaff. Additionally, the trained model can be used directly to remove such examples that are not named miRNA from the positive data given a threshold (we successfully used the lower quartile from the MirGeneDB distribution as a threshold). Using either method of filtering positive data will lead to more accurate pre-miRNA detection models. Finally, we provide the list of filtered pre-miRNAs to avoid the need to recalculate the data.
2. Methods
2.1. Datasets
All 28,645 hairpins listed in miRBase release 21 were used for calculating features needed for performing predictions using izMiR (http://www.nature.com/protocolexchange/protocols/4919). Except for atr-MIR8591 (http://www.mirbase.org/cgi-bin/mirna_entry.pl?acc=MI0027479) which could not be analyzed using our system, all other hairpins were processed. Regarding atr-MIR8591 it needs to be mentioned that this particular entry in miRBase has a hairpin length of 2354 nt, thereby, being the entry with the largest amount of nucleotides (average for miRBase: 83.59 nt). This is by no means a typical miRNA and, therefore, we do not believe that our approach is at fault. Since this is an extreme example (the only one of almost 30,000 and considering that the other two large hairpins with more than 1000 nucleotides (sly-MIR9475 (1451 nt) and atr-MIR8598 (1411 nt); 27 hairpins > 500 nt in miRBase) were analyzed with no problems, atr-MIR8591 can be safely ignored in our opinion. More information about the features and how to calculate them is available on our web site: http://jlab.iyte.edu.tr/software/mirna. The same procedure was applied to all 1434 hairpins from the four species available in MirGeneDB v1.1 (http://mirgenedb.org). The pseudo [23] dataset (8492 entries) was used to simulate negative data although there is no quality guarantee for such data [8].
2.2. Pre-miRNA Detection
miRBase and MirGeneDB datasets with calculated features were further processed using izMiR which was developed using the data analytics platform KNIME [24]. Our platform izMiR provides several models and for this study we chose AverageDT (average of decision tree prediction scores based on an ensemble of 13 individual models) which was successful for most scenarios (http://www.nature.com/protocolexchange/protocols/4919). Most notably, the accuracy of the AverageDT model, while trained using human data from miRBase and pseudo as negative data, mostly depends on the quality of test data [8]. Therefore, it can be used to analyze different filtering strategies.
2.3. Quality Assessment of pre-miRNAs
In order to identify high confidence pre-miRNAs, we employed a number of strategies based only on data available in miRBase and features that can be directly derived from that information.
miRBase entries were divided into two groups; one with RPM (reads per million) values less than or equal to 100 and the other one with RPM values greater than 100 (more explanation provided in Section Section 3.1).
Simple k-means clustering (k = 3, WEKA 3.7 in KNIME) was used to create a model based on the human dataset in miRBase using about 900 features which was then applied to cluster all miRBase entries. k was selected as 3, since we suspected that there should be at least 3 groups in miRBase in respect to quality. The first group should represents true miRNAs with strong experimental support, the second group likely consists of entries that might be true miRNAs but have some questionable properties, and the last group will be entries that have very small chance of being a real miRNAs.
Simple k-means clustering (k = 3, WEKA 3.7 in KNIME) was used to create a model based on the MirGeneDB dataset and the obtained model was applied to cluster all entries in MirGeneDB.
Identical hairpin sequences between miRBase and MirGeneDB were extracted and these miRBase hairpins were compared with the rest of its entries. This essentially is applying the same strategy as MirGeneDB [18].
A species specific comparison was performed by using mouse data in miRBase by analyzing high confidence mmu entries versus the remaining mmu hairpins.
Extending 5), miRBase high confidence (405 hairpins), miRBase low confidence (788 hairpins), and MirGeneDB (395 hairpins) mouse miRNAs were compared.
Performance of miRBase and MirGeneDB entries were analyzed in a species specific manner.
Similarity between miRBase and MirGeneDB hairpin sequences were investigated by using normalized Levenshtein distance (normalized to the length of the longer sequence).
2.4. Filtering miRBase
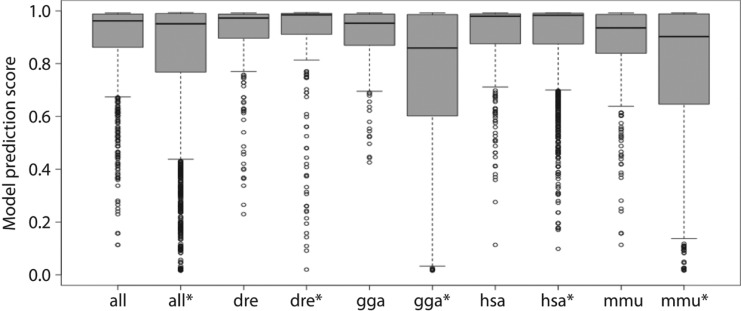
The AverageDT izMiR model was employed to analyze all miRBase entries and hairpins with a model score above 0.862 (lower quartile of MirGeneDB, Figure 1). Hairpins with a score above the threshold were accepted as confident pre-miRNAs.
Figure 1:
The model score distributions of all species in MirGeneDB individually and combined and their miRBase counterparts (miRBase indicated with *). From left to right, the number of pre-mirNAs supporting the distributions are: 1434, 4160, 229, 740, 395, 1193, 523, 1881, 287, and 346.
A machine learning model was established with high confident hairpins from miRBase as positive data and low confident ones as negative data based on selected structural and thermodynamic features (Table 1). The model was applied to all miRBase entries and all hairpins passing the prediction threshold (0.5) were accepted as high confident pre-miRNAs.
Table 1:
Features and their corresponding information gain scores enabling the separation between high confident and low confident miRBase entries.
| Feature | IG | Feature | IG | Feature | IG |
|---|---|---|---|---|---|
| mirbase_hpl | 0.130 | sl | 0.106 | %A++%G/sl | 0.101 |
| mwmF/hpl | 0.116 | clsp | 0.105 | %G++%A/sl | 0.101 |
| hpl | 0.116 | clep | 0.105 | %C++%U/hpl | 0.101 |
| %G++%U/hpl | 0.109 | #A++#C | 0.104 | %U++%C/hpl | 0.101 |
| %U++%G/hpl | 0.109 | #C++#A | 0.104 | ns/hpl | 0.100 |
| mwmF/sl | 0.109 | Tm/sl | 0.103 | saln | 0.099 |
| %G++%U/sl | 0.107 | %A++%G/hpl | 0.102 | nl/hpl | 0.098 |
| %U++%G/sl | 0.107 | %G++%A/hpl | 0.102 | #A++#G | 0.098 |
| Tm/hpl | 0.106 | #C++#U | 0.102 | #G++#A | 0.098 |
| #mdn | 0.106 | #U++#C | 0.102 | %C++%U/sl | 0.098 |
For more information about the features please refer to Supplementary Table 2 and http://jlab.iyte.edu.tr/software/mirna/featureList. Bolded features are based on structure and thermodynamics while the rest is sequence-based. IG, Information gain.
A list with all entries from miRBase and the rating of the two models was created and is available as Supplementary Table 1.
3. Results
3.1. Individual Analyses in Respect to miRBase and MirGeneDB
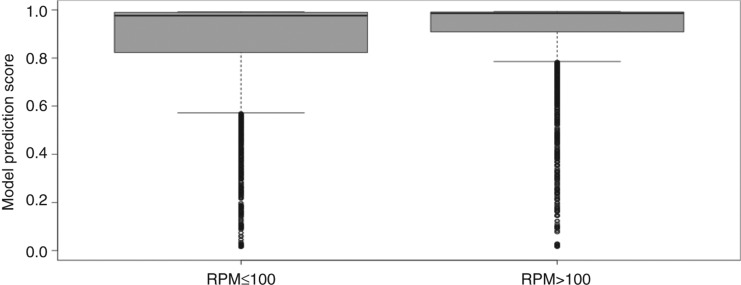
Although there are many alternative databases claiming to provide better and higher quality miRNA data like MirGeneDB [8] and miRTarBase [5] most of such repositories suffer from the limited number of organisms included in their datasets and overall less amount of pre-miRNAs. Therefore, miRBase remains the standard source for positive data since it offers miRNA information for 223 species and contains almost 30,000 pre-miRNAs. However, for machine learning, it is essential to have high confident positive data. Considering these issues it is essential to scrutinize the data obtained from miRBase to arrive at a high quality positive dataset. It is furthermore convenient to use an intrinsic parameter to save computational efforts like aligning large amounts of reads to pre-miRNAs. For example, RPM (reads per million) is a value provided for some of the entries in miRBase. Applying this simple RPM measure, separating the datasets into lower (≤ 100) and higher RPM (>100) support, leads to different distributions of the model prediction score distribution (Figure 2).
Figure 2:
Left box whisker plot shows the model prediction score distribution for 5449 miRBase hairpins randomly sampled from 23,195 with a maximum RPM value of 100 (Minimum: 0.014, Lower whisker: 0.572, Lower quartile: 0.823, Median: 0.976, Upper quartile: 0.990, Upper Whisker: 0.992, Maximum: 0.992). The right part shows the distribution of the model prediction scores for 5449 hairpins with RPM values greater than 100 (Minimum: 0.015, Lower whisker: 0.785, Lower quartile: 0.909, Median: 0.986, Upper quartile: 0.991, Upper Whisker: 0.993, Maximum: 0.993).
Especially, the lower whisker and the lower quartile are affected by filtering using 100 RPMs also leading to a lower interquartile range with 0.17 for low and 0.08 for high RPM support (Figure 2). For all other measures of the distribution the one with higher RPM support has higher values. A highly similar distribution to the one with lower RPM support was observed when using all entries instead of the random sample (not shown).
MirGeneDB was created to have a high confidence of hairpins filtered from miRBase. Cluster analysis is a popular approach to group datasets based on the similarity of its elements [25]. Here we performed k-means clustering (k = 3) for all miRBase entries and identified the MirGeneDB entries in the clusters, as well. Applying clustering led to three clusters with clearly different quality measures. This approach thereby allowed the enrichment of confident positive data in one of the clusters (Figure 3).
Figure 3:
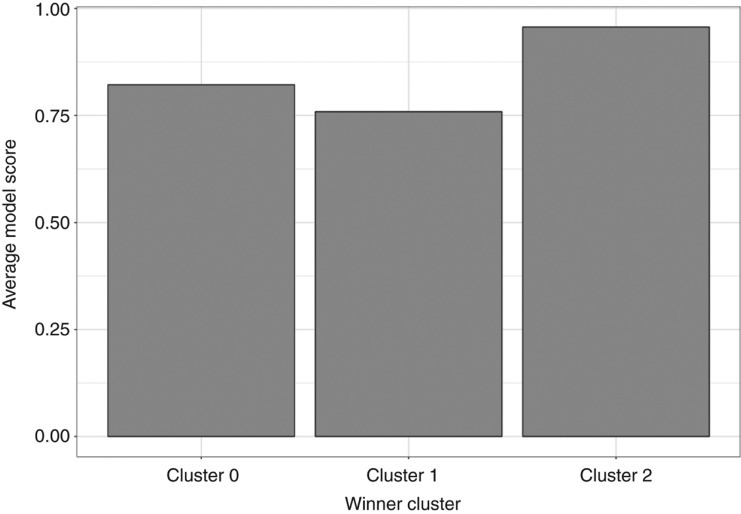
Clustering of miRBase hairpins. Out of 259 hairpins identical to MirGeneDB 145 of them located in Cluster 2, 24 of them are found in Cluster 1 and 90 are placed in Cluster 0. Overall Cluster 0 has 16,652 hairpins, Cluster 1 has 2801 hairpins, Cluster 2 has 9191 hairpins.
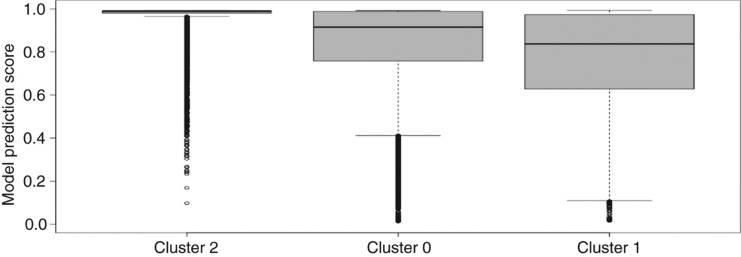
The average model prediction score for miRBase entries in cluster 2 is 0.957 and thereby is 0.198 and 0.135 points larger than for clusters 1 and 0, respectively. The distribution of model scores (Figure 4) leads to very high scores in a narrow interquartile range (0.01) for cluster 2 (median: 0.989), followed by cluster 0 with a similar maximum, but much larger inter quartile range (0.23) and lower median (0.915) (Figure 4). As the scores indicate, median of prediction values for Cluster 2 is higher than upper quartiles of clusters 1 and 0.
Figure 4:
Model score distribution for clusters 0–2 from Figure 3. Cluster 0: Minimum 0.012, Lower whisker 0.412, Lower quartile 0.758, Median 0.915, Upper quartile 0.988, Upper Whisker 0.992, Maximum 0.992; Cluster 1: Minimum 0.015, Lower whisker 0.110, Lower quartile 0.628, Median 0.837, Upper quartile 0.973, Upper Whisker 0.993, Maximum 0.993; Cluster 2: Minimum 0.098, Lower whisker 0.965, Lower quartile 0.980, Median 0.989, Upper quartile 0.991, Upper Whisker 0.992, Maximum 0.992.
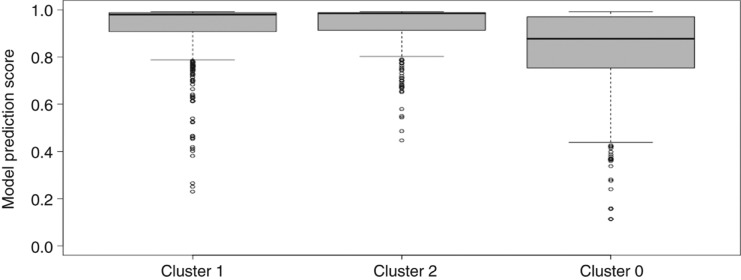
Performing a similar clustering analysis for MirGeneDB entries also leads to clusters with different model score distribution. Cluster 0 has a larger inter quartile range (0.218) compared to clusters 1 and 2 (0.080 and 0.075, respectively). The model score distributions are very similar for clusters 1 and 2 while cluster 0 shows lower values for all measures.
3.2. Collective Analyses Involving miRBase and MirGeneDB
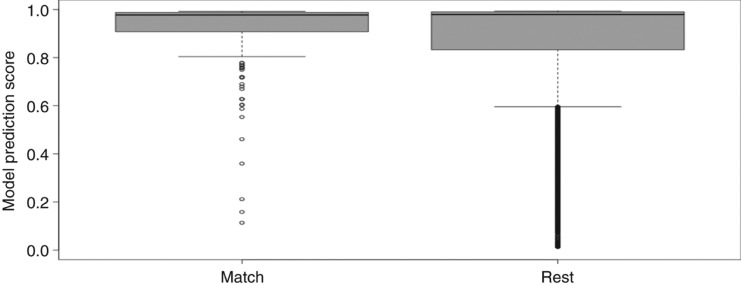
MirGeneDB only contains a fraction of the entries in miRBase (1434; 5 %), but they were extracted with the intend to have a high confidence positive dataset [18]. We performed string matching between the MirGeneDB entries and the miRBase entries and selected all matching ones in order to also account for duplicates in species not represented in MirGeneDB. The model score distribution of the matches was then compared to the remainder of miRBase (Figure 5). Overall, 259 miRBase hairpins (234 unique sequences) have identical sequences to 278 MirGeneDB hairpins (312 exact matches in total). The quality of these 259 hairpins was compared to the remaining 28,385 hairpins listed in miRBase (Figure 5).
Figure 5:
Performance of 259 mirbase hairpins exactly matching MirGeneDB entries (left): Minimum: 0.113, Lower whisker: 0.804, Lower quartile: 0.907, Median: 0.977, Upper quartile: 0.988, Upper whisker: 0.992, Maximum: 0.993; and rest of miRBase (right): Minimum: 0.012, Lower whisker: 0.596, Lower quartile: 0.833, Median: 0.979, Upper quartile: 0.990, Upper whisker: 0.993, Maximum: 0.993.
The model score distribution is higher for the matching sequences when compared to the remainder of miRBase (Figure 5). Matches between MirGeneDB and miRBase have a lower upper quartile (0.988 vs. 0.990) and a lower median (0.977 vs. 0.979). However, they have a much higher lower whisker, lower quartile, and most notably a narrower interquartile range (0.081 vs. 0.157).
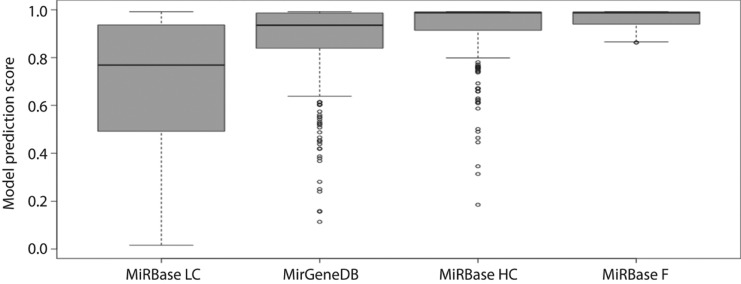
Following frequent reports of low quality data in miRBase, the platform reacted and now provides a high confidence miRNA dataset in its latest release [26]. Similarly to above, we analyzed the high confidence mouse dataset (miRBase HC) and compared it to the remaining low confidence mouse data in miRBase (miRBase LC), and the MirGeneDB entries specific to mouse (Figure 6).
Figure 6:
Performance of mouse miRNAs in MiRBase High Confidence (MiRBase HC; 405 hairpins), MiRBase Low Confidence (MiRBase LC; 788 hairpins), MirGeneDB (395 hairpins) and MiRBase Filtered (MiRBase F; 635 hairpins) filtered using the AverageDT model (izMiR) with a model score threshold of 0.862.
The high confidence miRBase mouse dataset has a similar upper quartile to the MirGeneDB mouse dataset (0.991 vs. 0.986), but a higher median (0.988 vs. 0.935), a higher lower quartile (0.914 vs. 0.839), and a smaller interquartile range (0.077 vs. 0.147). The unfiltered mouse data in miRBase has much lower values for all measures of the distribution. The miRBase data filtered with our model according to a threshold of 0.862 according to the lower quartile model score for MirGeneDB (Figure 1) naturally has a distribution with a minimum of 0.862. All other distribution measures are also better than for MiRBase HC.
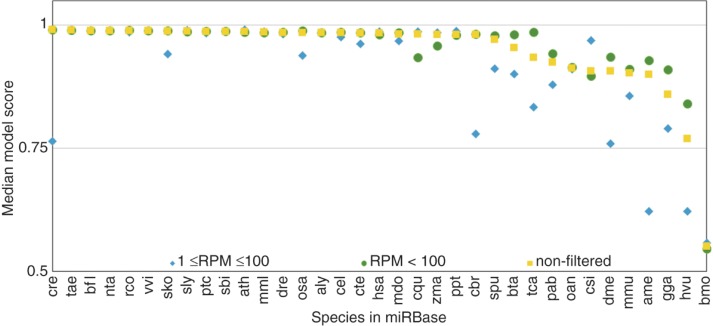
MicroRNAs have been described for many species and miRBase hosts data for more than 200 of them. We applied the izMiR AverageDT model to all pre-miRNAs in miRBase and recorded the model score distribution on a per species basis for all data in miRBase and for data filtered by RPM. In Figure 7 we report the median score for these two cases and the unfiltered variant for species which have suitable RPM support for their hairpins. While many species have very high median model scores for unfiltered data, the ones which have low medians, are improved after filtering. For some species with high medians before filtering the median is further improved after filtering. Conversely, data which is filtered out leads to lower median model scores. This is reversed for csi (Citrus sinensis).
Figure 7:
The performance of all species listed in miRBase which have at least 1 hairpin with ≥ 1 RPM. Median values for hairpins having RPM values less than or equal to 100 (RPM ≤ 100; blue), hairpins having RPM values larger than 100 (RPM > 100; blue) and all hairpins (nonfiltered; yellow) are compared.
Figure 7 is sorted by the median score after filtering, but there is no natural sorting of species following from that. For example, aly is a plant species (Arabidopsis lyrata) and hsa stands for Homo sapiens and both are almost adjacent to each other with very similar median model scores (0.985 and 0.980, respectively).
MirGeneDB has much less species recorded in its database and we performed the same analysis as above. Model score distributions are quite similar for most species in MirGeneDB (Figure 1).
For reference, the model score distribution of the same species in miRBase is also provided in Figure 1. The number of hairpins supporting the distributions from miRBase are always higher compared to MirGeneDB generally containing about one third of the entries in miRBase. For the individual species and the overall data, the miRBase distribution has lower values for lower whisker and lower quartile as well as a larger interquartile ranges. Except for human (hsa) and Danio rerio (dre) where the model score distributions are very similar between MirGeneDB and miRBase. For example, dre interquartile range is 0.095 and 0.079 for MirGeneDB and miRBase, respectively. The largest interquartile range was found for chicken (gga) for miRBase data (0.384) while the interquartile range for MirGeneDB was 0.119.
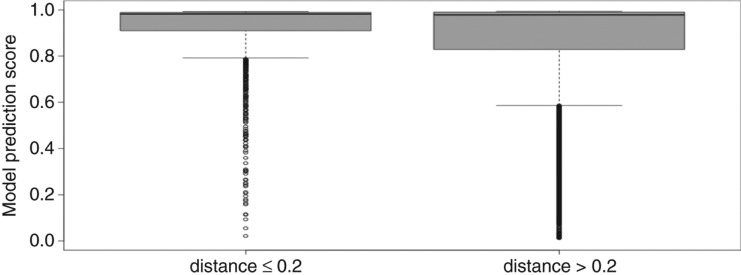
In order to extract high confident entries from miRBase, all entries resembling MirGeneDB entries with less than 0.2 distance score (normalized Levenshtein distance). The model score distribution shows that high confident entries were extracted (Figure 8).
Figure 8:
Model score distribution for 2139 miRBase hairpins with maximum 0.2 distance score to entries in MirGeneDB (left). Right part shows the model score distribution for 26,505 hairpins with distance values greater than 0.2 to MirGeneDB entries.
Hundreds of features have been proposed to describe a pre-miRNA [27]. In an attempt to employ these features to identify high confident miRNA entries in miRBase, putatively high confident entries in miRBase were selected as positive data (2139) and possibly low quality ones (26,505) were selected as negative data (see Figure 8). Information gain was calculated to assign an importance to the features describing a pre-miRNA in respect to differentiating between high and low confidence (Table 1). The features with higher information gain are better able to separate between positive and negative data and hence between high confidence and low confidence entries in miRBase.
Among the features that are able to separate between high and low confidence entries in miRBase are sequence-based ones (e.g.: %G++#%U/hpl). Other features have a structural component like mwmF/hpl or a thermodynamic one such as Tm/hpl.
3.3. Model Prediction
In order to determine whether the pre-miRNA detection model employed in this study can be used for assigning confidence to miRBase hairpins, different thresholds were applied to analyze miRBase data (not shown). A suitable threshold could be provided by the lower quartile of the MirGeneDB score distribution (Figure 1; 0.862). Applying the model using that threshold to all miRBase data leads to the overall rejection of 8400 hairpins (∼28 %). Conversely, 43 (0.5 %) hairpins from the pseudo dataset pass the threshold.
3.4. Feature Model
In order to identify high confidence entries in miRBase, we used all non-sequence-based features from Table 1 (12, bold). With these features we established a machine learning model using the high quality sequences as positive data and the low quality ones as negative data (see Figure 8). For establishing the model we used a randomly sampled 70–30 training/testing scheme with 1000 fold MCCV and equal amount of positive (0.91 threshold; 1601 hairpins; Figure 8) vs. negative data (below 0.91; p804 hairpins; Figure 8). Applying the model using the default threshold (0.5) to all miRBase data leads to the overall rejection of 20,586 hairpins (72 %).
4. Discussion
Many microRNAs have been detected and many more are expected to be found [28]. However, finding miRNAs even using NGS data is complicated and most current miRNAs have no evidence on the protein level. Additionally, it is futile to aim to determine all miRNA-mRNA interactions experimentally. Therefore, computational models are necessary and these models depend on training data [8]. While negative training data is of unknown quality, positive training data should be of high confidence. Unfortunately, much of the data in miRBase, the de facto source for all positive data used in machine learning to determine miRNAs is riddled with false positive entries (perhaps related sequences like siRNAs, snoRNAs, etc.). Therefore, we analyzed the data on miRBase and investigated different filtering strategies to distil a high confidence dataset.
By performing filtering based on reads per million (Filtering Strategy 1), an increase in the prediction performance is possible (Figure 2). This is further confirmed through analysis of the median model score on a per species basis in miRBase (Figure 7). However, it also becomes clear that sufficient evidence on the transcript level is only available for few species in miRBase and that RPM abundance, while effective, cannot completely differentiate between high confident and low confident samples (Figure 7). This observation is inline with other studies which have used the location of the mature sequence, additional read alignment and other parameters to further investigate hairpin confidence.
It is our aim to establish confidence in miRBase entries without the use of additional transcriptomic data or the reliance on different levels in the miRNA genesis pathway like the location of the mature miRNA. Hundreds of features have been proposed for pre-miRNA detection and it is likely that some of those features, or a combination of them, are able to discriminate between high and low confidence hairpins in miRBase. A first attempt was clustering based on the feature vectors of all pre-miRNAs in miRBase. Three clusters were generated using k-means clustering and it was possible to enrich a cluster in confident miRBase entries (Figure 3). In the future, this could be improved iteratively to arrive at different quality datasets. Cluster 1 has the lowest distribution and is therefore likely enriched with pre-miRNAs from miRBase that could be false positives (Figure 4). The same analysis was done for MirGeneDB where cluster 0 likely contains non miRNAs and clusters 1 and 2 probably are enriched in true miRNAs (Figure 9). Our previous analysis of mouse data from MirGeneDB confirms that there are still non-miRNAs in the MirGeneDB dataset [8]. The low quality data from miRBase has a very unfavourable distribution of model scores when compared to the other datasets (Figure 6). Conversely, and expanding on our previous results, here we show that mouse data from miRBase can be filtered effectively while still retaining more hairpins than other approaches (Figure 6).
Figure 9:
Performance of clusters in MirGeneDB data. Overall Cluster 0 has 402 hairpins, Cluster 1 has 563 hairpins and Cluster 2 has 469 hairpins. Cluster 0: Minimum 0.113, Lower whisker 0.438, Lower quartile 0.753, Median 0.877, Upper quartile 0.971, Upper Whisker 0.992, Maximum: 0.992; Cluster 1: Minimum 0.230, Lower whisker 0.788, Lower quartile 0.908, Median 0.980, Upper quartile 0.988, Upper Whisker 0.992, Maximum:0.992; Cluster 2: Minimum 0.447, Lower whisker 0.802, Lower quartile 0.913, Median 0.985, Upper quartile 0.988, Upper Whisker 0.992, Maximum:0.992.
While there are relatively few entries in MirGeneDB, they are of high confidence as can be seen from Figure 5 where the score distribution for the MirGeneDB subset and the remainder of miRBase was analyzed. The model score distribution is better for the subset when compared to the remainder of miRBase (Figure 5). This means that MirGeneDB succeeded in extracting high confidence miRNAs from miRBase. However, the distribution for miRBase is also quite well which means that a large portion of the entries in miRBase are also of high confidence.
Additionally, while having a similar number of hairpins, the model score distribution is better for the miRBase high quality dataset when compared to the MirGeneDB dataset (Figure 6).
Since there may be species specific characteristics of miRNAs it may be beneficial to use positive data from the organism of interest for machine learning. Therefore, we applied our izMiR model to all species in miRBase which have at least one hairpin with more than 0 and less than 100 read support and at least one hairpin with more than 100 read support. Only 35 (∼16 %) species fulfilled these criteria (Figure 7). Of these species, most have high quality data while the ones with lower quality data were pinpointed by lower model score median for hairpins with less than 100 read support and conversely, the subset with more than 100 read support generally showed increased model score medians (Figure 7). This supports our previous work where we showed that the izMiR model (trained on human) is applicable to all species and speculated that the decrease in positive prediction rate for some species was due to false positive examples (Saçar Demirci et al. [29] [accepted for publication]; http://www.nature.com/protocolexchange/protocols/4919).
Since MirGeneDB entries were of high confidence and since the izMiR model is widely applicable we used the izMiR model with the lower quartile of the MirGeneDB entries as a threshold to analyze all entries in miRBase. Twenty eight percent of the entries in miRBase were rejected in that manner, which is in line with previous reports of 30 % entries in miRBase being questionable (Taylor et al. [30], Chiang et al. [9]). Since the izMiR model was established using miRBase data, we wondered whether a different approach would lead to similar result. Therefore, we used high confidence miRBase entries as positive data and low confidence ones as negative data, established a machine learning model, and extracted the features that separate between the datasets. Application of the model to all miRBase data led to the rejection of about 70 % of entries in miRBase. While this is similar to what Peterson and colleagues found for human (Fromm et al. [18]), it seems very restrictive; and others have not found such a large percentage of questionable hairpins [11], [12], [13], [14], [15], [16], [17]. Both models we created were applied to all data in miRBase and all entries were scored and rated providing a comprehensive positive dataset. Out of the 28,644 entries in miRBase 72 % pass the AverageDT, 28 % the feature model, and 24 % both models (Supplementary Table 1). We suggest to use the AverageDT decision as a filter mechanism but if more stringency is needed, the miRBase entries passing both models could be useful.
5. Conclusion
Computational detection of pre-miRNAs directly from the genome and in RNA-seq data is important since experimental methods are convoluted. This is usually achieved by machine learning which depends on training data. Unfortunately, true negative data is unavailable. Therefore, the analysis of the positive data is needed to increase the overall confidence in established machine learning models. Here we analyzed miRBase and MirGeneDB data and found that miRBase contains about 28 % low confident entries while MirGeneDB also seems to contain a number of questionable entries (Figure 9). The AverageDT model of our izMiR platform allows the successful filtering of miRBase entries while retaining more entries for mouse than MirGeneDB or the high confidence data provided by miRBase. We applied our model and an alternative one we established in this study to all entries in miRBase and distilled a high confidence dataset in this manner. For all entries we indicate the decision of AverageDT and our feature model which can furthermore be combined into an ensemble decision for highest confidence. This high confidence dataset will enable the establishment of more successful machine learning models and increase the confidence in findings in the area of hairpin detection which is also important for the analysis of dysregulation in diseases like cancer.
Supporting Information
Acknowledgements
The work was supported by the Scientific and Technological Research Council of Turkey [grant numbers 113E326 and 114Z177] and by a research grant by Amazon Web Services to JA.
Supplemental Material
The online version of this article offers supplementary material (DOI: jib-2017-0032).
Conflict of interest statement:
Authors state no conflict of interest. All authors have read the journal’s Publication ethics and publication malpractice statement available at the journal’s website and hereby confirm that they comply with all its parts applicable to the present scientific work.
References
- [1].Filipowicz W, Bhattacharyya SN, Sonenberg N. Mechanisms of post-transcriptional regulation by microRNAs: are the answers in sight? Nat Rev Genet. 2008;9:102–14. doi: 10.1038/nrg2290. [DOI] [PubMed] [Google Scholar]
- [2].Li Y, Qiu C, Tu J, Geng B, Yang J, Jiang T. et al. HMDD v2.0: A database for experimentally supported human microRNA and disease associations. Nucleic Acids Res. 2014;42:D1070–4. doi: 10.1093/nar/gkt1023. [DOI] [PMC free article] [PubMed] [Google Scholar]
- [3].Lee RC, Feinbaum RL, Ambros V. The C. elegans heterochronic gene lin-4 encodes small RNAs with antisense complementarity to lin-14. Cell. 1993;75:843–54. doi: 10.1016/0092-8674(93)90529-y. [DOI] [PubMed] [Google Scholar]
- [4].Hsu S-D, Tseng Y-T, Shrestha S, Lin Y-L, Khaleel A, Chou C-H. et al. miRTarBase update 2014: an information resource for experimentally validated miRNA-target interactions. Nucleic Acids Res. 2014;42:D78–85. doi: 10.1093/nar/gkt1266. [DOI] [PMC free article] [PubMed] [Google Scholar]
- [5].Griffiths-Jones S, Saini HK, van Dongen S, Enright AJ. miRBase: tools for microRNA genomics. Nucleic Acids Res. 2008;36:D154–8. doi: 10.1093/nar/gkm952. [DOI] [PMC free article] [PubMed] [Google Scholar]
- [6].Berezikov E, Cuppen E, Plasterk RH. Approaches to microRNA discovery. Nat Genet. 2006;38:2–7. doi: 10.1038/ng1794. [DOI] [PubMed] [Google Scholar]
- [7].Saçar M, Allmer J. In: MiRNomics: microRNA biology and computational analysis SE – 10. Yousef M, Allmer J, editors. New York, USA: Humana Press; 2014. Machine learning methods for MicroRNA gene prediction; pp. 177–87. (Methods in Molecular Biology; vol. 1107) [DOI] [PubMed] [Google Scholar]
- [8].Saçar Demirci MD, Allmer J. Delineating the impact of machine learning elements in pre-microRNA detection. PeerJ. 2017;5:e3131. doi: 10.7717/peerj.3131. 10.7717/peerj.3131. [DOI] [PMC free article] [PubMed] [Google Scholar]
- [9].Chiang HR, Schoenfeld LW, Ruby JG, Auyeung VC, Spies N, Baek D. et al. Mammalian microRNAs: experimental evaluation of novel and previously annotated genes. Genes Dev. 2010;24:992–1009. doi: 10.1101/gad.1884710. [DOI] [PMC free article] [PubMed] [Google Scholar]
- [10].Wang X, Liu XS. Systematic curation of miRBase annotation using integrated small RNA high-throughput sequencing data for C. elegans and Drosophila. Front Genet. 2011;2:25. doi: 10.3389/fgene.2011.00025. [DOI] [PMC free article] [PubMed] [Google Scholar]
- [11].Meng Y, Shao C, Wang H, Jin Y. Target mimics: an embedded layer of microRNA-involved gene regulatory networks in plants. BMC Genomics. 2012;13:197. doi: 10.1186/1471-2164-13-197. [DOI] [PMC free article] [PubMed] [Google Scholar]
- [12].Tarver JE, Donoghue PCJ, Peterson KJ. Do miRNAs have a deep evolutionary history? BioEssays. 2012;34:857–66. doi: 10.1002/bies.201200055. [DOI] [PubMed] [Google Scholar]
- [13].Axtell MJ, Westholm JO, Lai EC. Vive la différence: biogenesis and evolution of microRNAs in plants and animals. Genome Biol. 2011;12:221. doi: 10.1186/gb-2011-12-4-221. [DOI] [PMC free article] [PubMed] [Google Scholar]
- [14].Kozomara A, Griffiths-Jones S. miRBase: integrating microRNA annotation and deep-sequencing data. Nucleic Acids Res. 2011;39:D152–7. doi: 10.1093/nar/gkq1027. [DOI] [PMC free article] [PubMed] [Google Scholar]
- [15].Tsutsumi A, Kawamata T, Izumi N, Seitz H, Tomari Y. Recognition of the pre-miRNA structure by Drosophila Dicer-1. Nat Struct Mol Biol. 2011;18:1153–8. doi: 10.1038/nsmb.2125. [DOI] [PubMed] [Google Scholar]
- [16].Taylor RS, Tarver JE, Hiscock SJ, Donoghue PCJ. Evolutionary history of plant microRNAs. Trends Plant Sci. 2014;19:175–82. doi: 10.1016/j.tplants.2013.11.008. [DOI] [PubMed] [Google Scholar]
- [17].Ambros V, Bartel B, Bartel DP, Burge CB, Carrington JC, Chen X. et al. A uniform system for microRNA annotation. RNA. 2003;9:277–9. doi: 10.1261/rna.2183803. [DOI] [PMC free article] [PubMed] [Google Scholar]
- [18].Fromm B, Billipp T, Peck LE, Johansen M, Tarver JE, King BL. et al. A uniform system for the annotation of vertebrate microRNA genes and the evolution of the human microRNAome. Annu Rev Genet. 2015;49:213–42. doi: 10.1146/annurev-genet-120213-092023. [DOI] [PMC free article] [PubMed] [Google Scholar]
- [19].Jones-rhoades MW. Conservation and divergence in plant microRNAs. 2012;80:3–16. doi: 10.1007/s11103-011-9829-2. [DOI] [PubMed] [Google Scholar]
- [20].Saçar MD, Hamzeiy H, Allmer J. Can MiRBase provide positive data for machine learning for the detection of MiRNA hairpins? J Integr Bioinform. 2013;10:215. doi: 10.2390/biecoll-jib-2013-215. [DOI] [PubMed] [Google Scholar]
- [21].Marcinkowska M, Szymanski M, Krzyzosiak WJ, Kozlowski P. Copy number variation of microRNA genes in the human genome. BMC Genomics. 2011;12:183. doi: 10.1186/1471-2164-12-183. [DOI] [PMC free article] [PubMed] [Google Scholar]
- [22].Kim VN, Han J, Siomi MC. Biogenesis of small RNAs in animals. Nat Rev Mol Cell Biol. 2009;10:126–39. doi: 10.1038/nrm2632. [DOI] [PubMed] [Google Scholar]
- [23].Ng KLS, Mishra SK. De novo SVM classification of precursor microRNAs from genomic pseudo hairpins using global and intrinsic folding measures. Bioinformatics. 2007;23:1321–30. doi: 10.1093/bioinformatics/btm026. [DOI] [PubMed] [Google Scholar]
- [24].Berthold MR, Cebron N, Dill F, Gabriel TR, Kötter T, Meinl T, In: Data analysis, machine learning and applications. Preisach C, Burkhardt H, Schmidt-Thime L, Decker R, editors. Berlin, Heidelberg: Springer; 2008. KNIME: The Konstanz information miner; pp. 319–26. [Google Scholar]
- [25].Wiwie C, Baumbach J, Röttger R. Comparing the performance of biomedical clustering methods. Nat Methods. 2015;12:1033–8. doi: 10.1038/nmeth.3583. [DOI] [PubMed] [Google Scholar]
- [26].Kozomara A, Griffiths-Jones S. miRBase: annotating high confidence microRNAs using deep sequencing data. Nucleic Acids Res. 2014;42:D68–73. doi: 10.1093/nar/gkt1181. [DOI] [PMC free article] [PubMed] [Google Scholar]
- [27].Sacar MD, Allmer J. Data mining for microrna gene prediction: On the impact of class imbalance and feature number for microrna gene prediction; 2013 8th International Symposium on Health Informatics and Bioinformatics [Internet]; IEEE; 2013. [cited 2015 Jan 5]. pp. 1–6. Available from: https://www.researchgate.net/publication/259230528_Data_mining_for_microrna_gene_prediction_On_the_impact_of_class_imbalance_and_feature_number_for_microrna_gene_prediction. [Google Scholar]
- [28].Londin E, Loher P, Telonis AG, Quann K, Clark P, Jing Y. et al. Analysis of 13 cell types reveals evidence for the expression of numerous novel primate- and tissue-specific microRNAs. Proc Natl Acad Sci. 2015;112:E1106–15. doi: 10.1073/pnas.1420955112. [DOI] [PMC free article] [PubMed] [Google Scholar]
- [29].Saçar Demirci MD, Baumbach J, Allmer J. On the performance of pre-microRNA detection algorithms. Nature Communications. doi: 10.1038/s41467-017-00403-z. (accepted for publication) [DOI] [PMC free article] [PubMed] [Google Scholar]
- [30].Taylor RS, Tarver JE, Hiscock SJ, Donoghue PC. Evolutionary history of plant microRNAs. Trends Plant Sci. 2014;19:175–182. doi: 10.1016/j.tplants.2013.11.008. [DOI] [PubMed] [Google Scholar]
Associated Data
This section collects any data citations, data availability statements, or supplementary materials included in this article.


