Abstract
This research focused on the cell wall structure and its mechanical properties of down-regulated Coumaroyl shikimate 3-hydroxylase (C3H) transgenic poplar and down-regulated hydroxycinnamoyl CoA: shikimate hydroxycinnamoyl transferase (HCT) transgenic poplar (Populus alba × P. glandulosa cv ‘84 k’). The wood samples with respect to microstructure, the longitudinal elastic modulus (MOE) and hardness of wood fiber secondary cell wall were investigated. The results show that the lignin contents in the two transgenic poplar woods were lower than non-modified wood. The C3H transgenic poplar and HCT transgenic poplar have more than 18.5% and 16.1% cellulose crystalline regions than non-modified poplar respectively. The diameter of the fiber cell and the vessel element of transgenic poplars are smaller. Double radial vessel cell wall thicknesses of both transgenic poplars were smaller than non-modified poplar. Cell wall ratios for the transgenic poplar were higher than non-modified poplar and cell wall density was significantly lower in both C3H and HCT transgenic poplar. The cell wall MOEs of C3H and HCT transgenic poplar was 5.8% and 7.0% higher than non-modified poplar. HCT can be more effective than C3H to modify the trees by considerably increasing mechanical properties of the cell wall.
Introduction
The research of forest transgenic technology started in the early 1980s. In 1986, the transgenic tree Populus alba × grandidentata1 was tried. With the genetic engineering, it is possible to improve wood qualities of the plantation forest. Because of fast growing and vigorous asexual reproduction, poplar is a preferred modified species2–4.
The genetic engineering improvement can effectively improve the quality of wood fiber, and thus improve the quality of the pulp5–11. The genetic engineering improvement can affect wood Microfibril Angle (MFA)12,13. The changes of wood cell morphology and microfibril angle would cause the changes of wood mechanical properties. The wood properties changes with the genetic engineering improvement and many genes have been found to influence the density, shrinkage, swelling and strength of wood.
The genetic engineering technology was used to regulate the biosynthesis process of lignin in trees. This technology can reduce the lignin content or change its structure and composition14. There are varieties of enzymes involved in lignin biosynthesis. These enzymes play an important role in lignin synthesis, and the activity of these enzymes is closely related to lignin content4,15–19. C4H, 4CL, C3H, CAD, CCR, COMT, CCoAOMT and other genes can reduce significantly lignin content, especially C3H, C4H and 4CL5–11. Moreover, lignin is an aromatic compound that is mainly composed of three basic phenylpropane units, guaiacyl unit (G), syringyl unit (S) and p-hydroxyphenyl unit (H). The ratio of S and G (S/G) is an important parameter in paper industry20, it can be influenced by C3H, COMT, CCoAOMT and F5H21. Down-regulation of C3H gene and CCoAOMT gene can increase S/G, which will contribute to delignification8–11,22.
Cell morphology of transgenic wood has been studied by the methods of optical microscopy and transmission electron microscopy (TEM)23. It has been found that the down-regulated CCR gene can increase the ratio of fiber length to width of transgenic poplar (Populus × euramericana)24. Horvath25 studied the effects of lignin content and S/G on the anatomical properties of genetically engineered aspen trees (Populus tremuloides Michx.) and found the genetic group with increased S/G ratio had lower diameter growth, lower vessel lumen element diameter, but more numerous vessels. The ratio of cell wall area in cross-section of 4CL transgenic poplar would be slightly different from that of non-modified poplar26. Down-regulated CCoAOMT gene can increase fiber width, ratio of cell wall to lumen, cell wall thickness and long fiber (greater than 0.61 mm) distribution frequency and reduce cell lumen diameter22. PAD4 gene silencing transgenic poplar had higher cell division rate, it decreased the average cell size but increased the number of cells, decreased the number and diameter of vessel element and increased cell wall thickness27.
Since wood properties are largely determined by cell wall structure, and formation of cell wall can be regulated genetically, but research in this area is far from enough. Thus, the objective of this study is to study the cell wall structure and properties of transgenic poplar that can provide some reference for directional cultivation of transgenic poplar. In this study, the effect of transgenic down-regulation Coumaroyl shikimate 3-hydroxylase (C3H) or hydroxycinnamoyl CoA: shikimate hydroxycinnamoyl transferase (HCT) on the wood ultrastructure and mechanical behaviors were studied with the advanced technologies of Glycosyl Linkage Assay, Acetyl Bromide Assay, Fourier transform infrared spectroscopy (FTIR), X-ray diffraction (XRD) and Olympus BX51 optical microscope. Nano indentation (NI) tests were performed to measure the longitudinal elastic modulus and the hardness of wood fiber secondary cell walls.
Results and Discussion
Stem Height, Stem Diameter and Internode Number
Table 1 lists the stem height and stem diameter of non-modified poplar and C3H and HCT transgenic poplar. The stem height was measured from the bottom of the stem to the shoot tip and the stem diameter was measured 20 cm above the soil23. From the table, there are no difference between heights of non-modified and transgenic species. The stem diameters of transgenic poplars were smaller. The internode numbers of transgenic poplar were less than the non-modified sapling, but there was no significant difference. The down-regulated C3H and HCT genes slowed down the growth of trees in diameter, which is consistent with previous studies7.
Table 1.
Stem height, stem diameter and internode number of non-modified poplar and transgenic poplar.
| Sample | Height (cm) | Diameter (mm) | Internode number |
|---|---|---|---|
| Non-modified poplar | 141.7 ± 6.7 A | 6.05 ± 0.15 A | 51 ± 1 A |
| C3H transgenic poplar | 142.7 ± 2.8 A | 5.47 ± 0.09 B | 49 ± 2 A |
| HCT transgenic poplar | 134.8 ± 6.6 A | 5.55 ± 0.33 B | 49 ± 3 A |
| P-value | 0.178 | 0.040 | 0.493 |
Values after “±” are standard deviations and different letters after values in the same column indicates that there is a significant difference between samples at p < 0.05 (Student Newman Keuls test), same in the following tables.
Cell Morphology
Figure 1 depicts the cross sections of poplar wood with solitary vessel pores and a few of multiple pores. Figure 2 shows the cell morphological changes of C3H and HCT transgenic poplar. Fiber cell diameter and fiber cell lumen diameter of two transgenic poplars are significantly smaller. For the vessels, their cell diameter and cell lumen diameter of both transgenic poplars decreased significantly. Vessel cell wall thickness of HCT transgenic poplar was 18.5% smaller than that of non-modified sapling, and that of C3H transgenic poplar was 3.1% smaller than non-modified.
Figure 1.
Optical micrograph of non-modified poplar and transgenic poplar.
Figure 2.
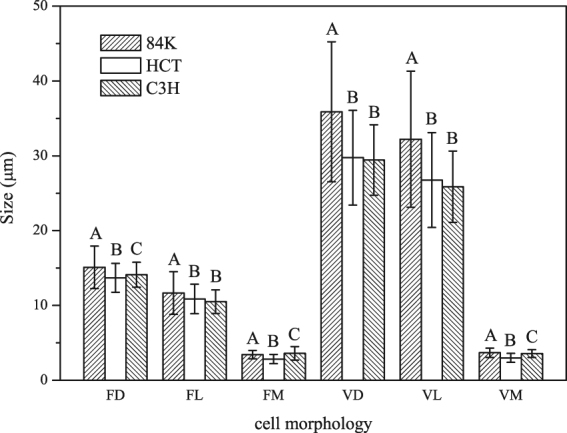
Cell morphology of C3H and HCT RNAi transgenic poplar. FD: Fiber cell diameter, FL: fiber cell lumen diameter, FM: Fiber cell wall thickness, VD: vessel cell diameter, VL: vessel cell lumen diameter, VM: vessel cell wall thickness. The error bars represent standard deviations, and different letters above the columns indicates that there is a significant difference between samples at p < 0.05 (Student Newman Keuls test), same in the following figures.
Glycosyl Linkage Assay
Table 2 shows the three main cell walls chemical compositional analysis of cell wall from C3H and HCT transgenic poplars. The hemicellulose polymers from C3H samples were 6.6% lower than the control, while that from HCT sample was 8.1% greater than the control. Moreover, the cellulose content of C3H transgenic poplar increased significantly while there was no difference between that of HCT and non-modified poplar. The lignin content of C3H samples and HCT samples were 3.3% and 9.4% lower than non-modified samples respectively. The above results indicate that the reduction of lignin lead to the increase of cellulose in C3H transgenic poplar and the increase of hemicellulose in HCT transgenic poplar.
Table 2.
Three main cell walls chemical composition analysis of non-modified poplar and transgenic poplar.
| Sample | Hemicellulose content (%) | Cellulose content (%) | Lignin content (%) |
|---|---|---|---|
| Non-modified poplar | 31.2 | 43.1 | 11.1 |
| C3H transgenic poplar | 29.2* | 47.7* | 10.7* |
| HCT transgenic poplar | 33.8* | 43.1 | 10.0* |
AIRs sequential extractions were performed as described in Methods. The variance was not shown, but was less than 12%. *Significant difference between the non-modified poplar and transgenic poplar (t-test at p < 0.05).
FTIR spectroscopy
Table 3 is the assignment of bands in the FTIR spectrum of cell wall polymers. From Table 4, the characteristic bands ratio I1507/I1425, I1507/I1382 and I1507/I895 of the transgenic poplar show differences from the non-modified poplar. They indicate that the aromatic skeleton of transgenic poplar is significantly lower. This result also confirmed that the lignin content of transgenic poplar is lower after the genetic modification. The increasing bands ratio I1507/I1425 of transformed poplar revealed that the ratio of aromatic skeleton and C-H in aromatic skeleton rose. The C-H in aromatic skeleton of transgenic poplar fell more sharply than the aromatic skeleton.
Table 3.
FTIR absorption peak location and assignment.
| Wavenumber (cm−1) | Absorption Peak Location and Assignment |
|---|---|
| 2900 | C-H and CH2 stretching |
| 1745 | C=O stretching in unconjugated ketone, carbonyl, and aliphatic groups |
| 1596 | Aromatic skeletal stretching and C=O stretching (Lignin) |
| 1507 | Aromatic skeletal stretching (Lignin) |
| 1462 | C-H deformation (Lignin and carbohydrates) |
| 1425 | Aromatic skeletal combined with C-H in-plane deforming and stretching (Lignin) |
| 1382 | Aliphatic C-H in plane deforming and stretching (Cellulose and hemicellulose) |
| 1332 | C-H vibration and C-O vibration in syringyl derivatives |
| 1243 | Syringyl ring and C-O stretching (Lignin and xylan) |
| 1158 | C-O-C stretching (Cellulose and hemicellulose) |
| 1106 | OH association absorption band (cellulose and hemicellulose) |
| 1050 | C-O stretching (Cellulose, hemicellulose and lignin) |
| 895 | Out of phase ring stretching (Cellulose) |
Table 4.
FTIR relative peak intensity ratio.
| Sample | Relative peak intensity ratio | ||||
|---|---|---|---|---|---|
| I1507/I1425 | I1507/I1382 | I1507/I895 | I1507/I1158 | I1507/I1745 | |
| Non-modified poplar | 1.152 ± 0.038 A |
1.077 ± 0.056 A | 2.770 ± 0.228 A | 0.835 ± 0.042 AB | 0.373 ± 0.015 A |
| C3H transgenic poplar | 1.399 ± 0.153 B |
1.016 ± 0.047 B | 2.147 ± 0.147 B | 0.809 ± 0.104 A | 0.383 ± 0.024 A |
| HCT transgenic poplar | 1.418 ± 0.010 B |
1.011 ± 0.065 B | 2.154 ± 0.173 B | 0.907 ± 0.115 B | 0.366 ± 0.038 A |
| P-value | 1.44 × 10⁻⁶ | 0.024 | 3.41 × 10⁻¹¹ | 0.007 | 0.332 |
Measuring relative degree of crystallinity
XRD analysis was used to characterize the crystalline regions of generic modified wood. The crystallinity of non-transformed poplar and transgenic poplar from XRD analysis is shown in Table 5 and Fig. 3. The results show that the cellulose crystallinity of both transgenic poplars were significantly higher than that of non-transformed poplar. The C3H transgenic poplar and HCT transgenic poplar have 18.5% and 16.1% more than non-modified poplar respectively. Li28 found that the lower lignin content could increase the cellulose crystallinity. The reduction of lignin may weaken such constraints between hydrogen bonds and surrounding disordered cellulose and lignin and promote tighter packing of crystalline cellulose leading to a greater cellulose crystallinity region29.
Table 5.
Cellulose crystallinity of non-modified poplar and transgenic poplar.
| Sample | CrI (%) |
|---|---|
| Non-modified poplar | 34.32 ± 1.74 A |
| C3H transgenic poplar | 40.67 ± 0.27 B |
| HCT transgenic poplar | 39.85 ± 1.05 B |
| P-value | 1.77 × 10⁻⁴ |
Figure 3.
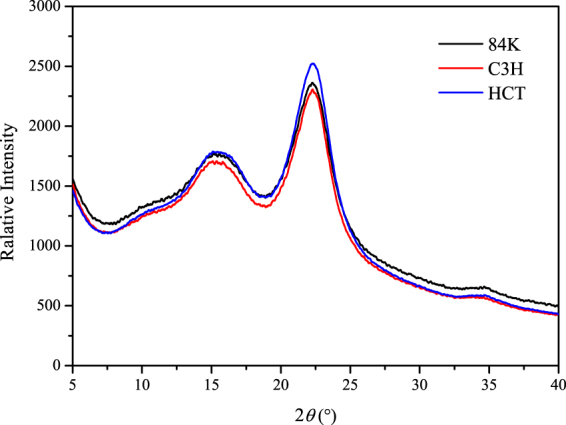
Cellulose crystallinity of non-modified poplar and transgenic poplar.
Acetyl Bromide Assay
Linear regression was performed on the data of lignin content and UV absorbance at 280 nm, and regression equations were obtained from standard curve of alkali lignin, which was y = 81.939 × −3.5557 and R2 = 0.9638 (Fig. 4). The lignin content can be obtained by the formula combined with the UV absorbance of the samples as shown in Table 6 and Fig. 5.
Figure 4.
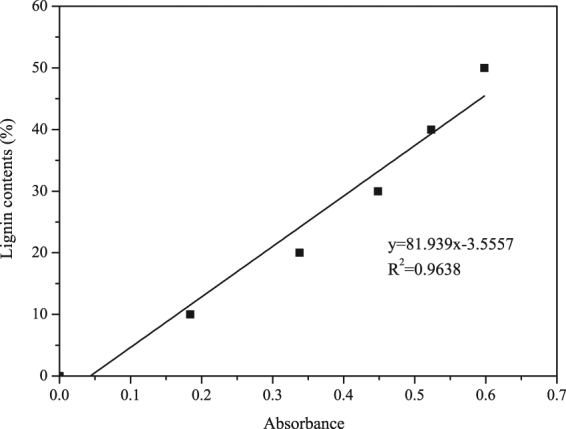
Regression equations obtained from standard curve of alkali lignin content and UV absorbance.
Table 6.
Lignin content of non-modified poplar and transgenic poplar.
| Sample | Lignin content (%) |
|---|---|
| Non-modified poplar | 21.11 ± 1.08 A |
| C3H transgenic poplar | 14.80 ± 1.77 B |
| HCT transgenic poplar | 16.82 ± 1.93 C |
| P-value | 3.00 × 10−77 |
Figure 5.
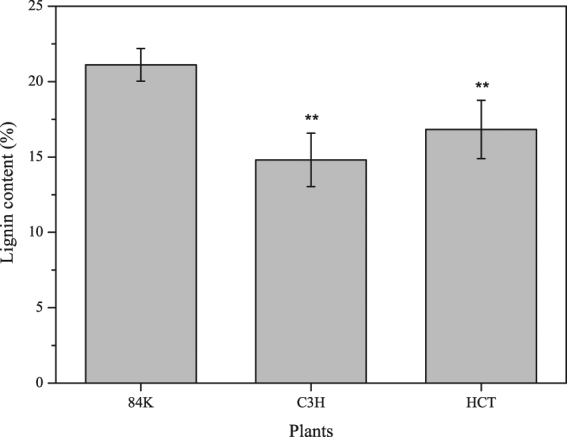
Lignin content of non-modified poplar and transgenic poplar. “**” Represents that there is a significant difference between the non-modified poplar and transgenic poplar at p < 0.01 (One-way ANOVA), same in Fig. 6.
The results showed that the lignin content of both transgenic poplars lowered markedly, the lignin content of C3H transgenic poplar and HCT gene was decreased by 29.9% and 20.3% respectively. Both Glycosyl Linkage Assay and Acetyl Bromide Assay show that down-regulated C3H and HCT reduced the lignin content of poplar, which is consistent with previous studies6–10. Lignin restricts the development of pulp and paper industry result from environmental pollution and the process of bioenergy production from wood30. The decrease of lignin content in trees can not only improve economic and environmental benefits in pulp and paper industry, but also contribute to lignocellulose decomposition and improving sugar conversion efficiency14. Thus, the down-regulated C3H and HCT transgenic poplars can be better materials in pulp and paper industry and bioenergy production.
Cell Wall Ratio (CWR) and Basic Density (BD)
The cell wall ratio is the ratio of cell wall area in wood cross-section, It was significantly higher in both C3H and HCT transgenic poplar because of the lower cell lumen diameter. The basic density of C3H gene and HCT gene down-regulated poplar differed significantly (Table 7 and Fig. 6). The change in C3H transgenic poplar and HCT transgenic poplar basic density was 5.1% and 2.5% less than the non-modified sapling.
Table 7.
Cell wall ratio and basic density of non-modified poplar and transgenic poplar.
| Sample | BD (g/cm3) | CWR (%) | Cell wall BD |
|---|---|---|---|
| Non-modified poplar | 0.277 ± 0.022 A | 40.27 ± 0.54 A | 0.688 ± 0.544 A |
| C3H transgenic poplar | 0.263 ± 0.020 B | 45.10 ± 1.72 B | 0.579 ± 0.496 B |
| HCT transgenic poplar | 0.284 ± 0.012 C | 43.71 ± 0.40 B | 0.650 ± 0.354 C |
| P-value | 3.97 × 10⁻¹¹ | 2.23 × 10⁻⁵ | 1.62 × 10⁻³ |
Figure 6.
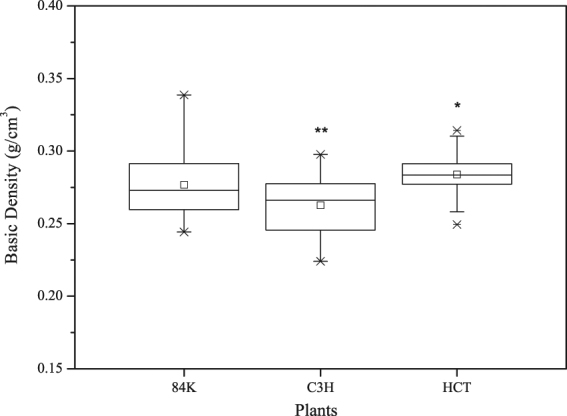
Basic density of non-modified poplar and transgenic poplar. “□” Represents the average value. The line in the box represents the median. The upper and lower edges of the box represent the upper quartile and the lower quartile, respectively. The error bars represent maximum and minimum values, “*”represent that there is a significant difference between the non-modified poplar and transgenic poplar at p < 0.05 (One-way ANOVA).
Basic density divided by cell wall ratio is cell wall basic density. It decreased significantly in both C3H and HCT transgenic poplar. It indicates that cell wall becomes looser resulting from the decreased lignin content of poplar.
Wood fiber was the major factor to change cell wall ratio. Figure 2 shows that the fiber cell lumen diameter of C3H transgenic poplar decreased, but its fiber cell wall thickness increased, it indicated that there is more substance in C3H transgenic poplar fiber, which can lead to an increase of its cell wall ratio. To the HCT transgenic poplar, both the fiber cell lumen diameter and fiber cell wall thickness decreased, so the reason why its cell wall ratio increased needs further research.
Cell Wall Mechanical Property
Figure 7 shows the smooth tested surface of sample, only the indentations clearly within the secondary cell wall of a cell are valid while the invalid indentations are much closer to the compound middle lamella shared with an adjacent cell or at the edge of the cell lumen. Figure 8 shows a typical NI load-displacement curves of cell walls. MOEs and Hardnesses of samples were obtained from the valid indentations and presented in Fig. 8 and Table 8. Interestingly, MOEs of C3H and HCT transgenic poplar was 5.8% and 7.0% higher than non-modified poplar, however, the cell wall of non-modified poplar has the highest hardness values. The hardness of C3H transgenic poplar cell wall was significant lower by 10.2%. Less lignin content contributes to the lower hardness31. Cell wall MOEs were related to holocellulose content and cellulose crystallinity, that indicated that the increase of MOEs of both transgenic poplar might be attribute to the rise of holocellulose content and cellulose crystallinity.
Figure 7.
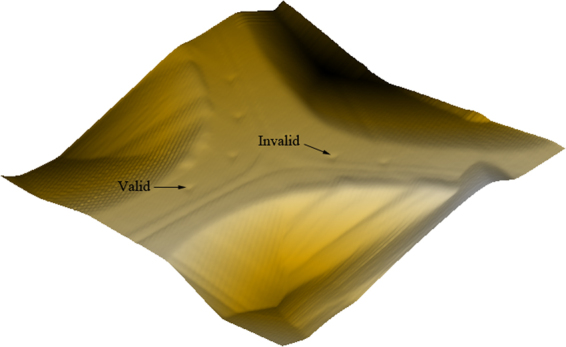
3D image of NI test on poplar cells.
Figure 8.
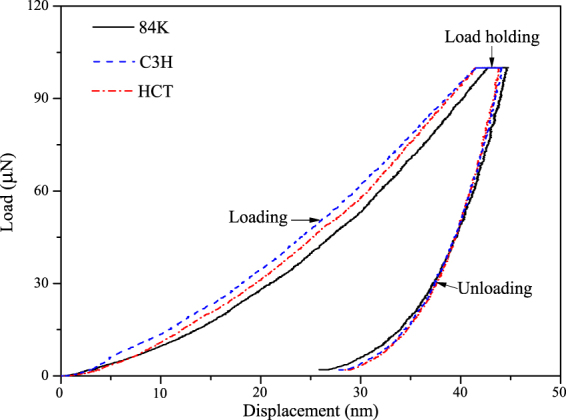
Typical NI load-displacement curves of poplar fiber cell walls.
Table 8.
MOE and Hardness of non-modified poplar and transgenic poplar.
| Samples | MOE (GPa) | Hardness (GPa) |
|---|---|---|
| Non-modified poplar | 16.86 ± 0.88 A | 0.528 ± 0.046 A |
| C3H transgenic poplar | 17.84 ± 1.45 B | 0.474 ± 0.036 B |
| HCT transgenic poplar | 18.04 ± 1.20 B | 0.527 ± 0.026 A |
| P-value | 7.45 × 10⁻³ | 3.44 × 10⁻⁴ |
Conclusion
The lignin contents in both C3H and HCT transgenic poplar wood were significantly lower than lignin conents of non-modified wood. The cellulose content were increased by 10.7% for C3H transgenic poplar compared with non-modified poplar. The hemicellulose content increased by 8.3% in HCT transgenic poplar compared with non-modified poplar. The C3H transgenic poplar and HCT transgenic poplar saplings have 18.5% and 16.1% more cellulose crystalline regions than non-modified poplar respectively.
The diameter of the fiber cells and the vessels of transgenic poplar are smaller. Double radial vessel cell wall thickness of HCT transgenic poplar is 18.5% smaller than non-modified poplar, while C3H transgenic poplar is only 3.1% smaller than non-modified poplar.
The cell wall density was significantly lower in both C3H and HCT transgenic poplar. The cell wall MOEs of C3H and HCT transgenic poplar were 5.8% and 7.0% higher than non-modified poplar respectively. The hardness of C3H transgenic poplar was 10.2% less than non-modified poplar.
HCT can be more effective than C3H to modify the trees by considerably increasing mechanical properties of the cell wall of genetic modification.
Materials and Methods
Plant Materials and Growth Conditions
The transgenic poplar (Populus alba × P. glandulosa cv ‘84 k’) was collected as the experimental tissue and the seedlings were cultured for 1.5 months. The temperature was 22 °C with light/darkness for 16/8 hours a day. The trees were then planted in the greenhouse and watered daily. They were cultivated naturally for 6 months (Fig. 9). The expressions of C3H gene and HCT gene were 54% and 37% of non-modified plants respectively. Trees grew to an average height of 1.3 m and diameter of about 5.5 mm after 6 months. Three plants were for control. The transgenic poplar saplings were cut. And samplings were taken with the ninth internode from the tip, which was fully lignified. Internodes were taken for FTIR analysis and other measurements including NI testing, Glycosyl Linkage Assay, Anatomical explorations, Acetyl Bromide Assay, Measuring relative degree of crystallinity and Basic Density.
Figure 9.
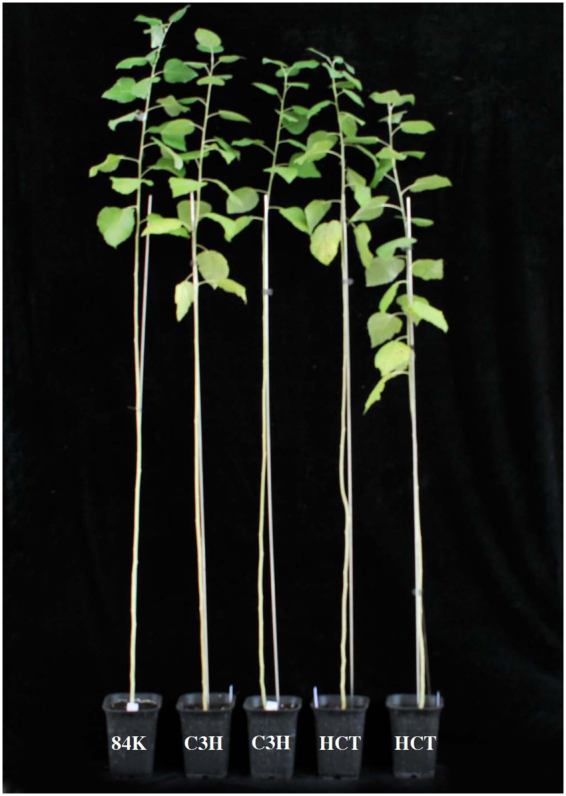
Photograph of one-year-old non-modified poplar (84 K) and HCT and C3H transgenic poplar saplings.
Anatomical structure of generic modified poplar wood
To measure cell wall thickness and cell lumen diameter, samples were sectioned to the 15 µm thickness using a sliding microtome. The sections were dehydrated through alcohol series (30%, 5 min; 50%, 5 min; 80%, 5 min; 95%, 5 min; 100%, 10 min) and stained with safranine for 2 minutes. The cell structure was observed and studied with Leica DMLB light microscope and an image analysis system (Japan, Q570). The function of arbitrary line in the system was used to measure tangential cell lumen diameter and double radial cell wall thickness at more than 100× magnification. Three categories were chosen within annual ring from pith to bark, and 100 fibers and 100 vessel elements for each plant were measured. Cell wall ratio was measured by Image J software, and 10 categories were chosen in every sample32.
Glycosyl Linkage Assay
The chemical compositions were determined with glycosyl linkage assay, 0.5 mg of 1 N KOH and 4 N KOH fractionated alcohol insoluble residues (AIRs) were methylated by incubating the residues in dimethyl sulfoxide that contains iodomethane and NaOH for 16 h33,34. The samples were then hydrolyzed in 2 M TFA and reduced with sodium borodeuteride in 1 M ammonium hydroxide. The partially methylated alditol acetate was analyzed by GC–MS.
Acetyl Bromide Assay
An acetyl bromide assay was used to determine lignin content with the principle of the lignin content related to the the UV absorbance33. 5 mg wood flour for each sample and 5 mg alkali lignin were prepared in comparison tubes, 5 mL of freshly prepared acetyl bromide reagent, which is 30% (v/v) acetyl bromide in glacial acetic acid was added, 200 µL of perchloric acid was added to aid in the total dissolution of the wall material35,36, and then the tubes were capped immediately and heated in an electric-heated thermostatic water bath set at 70 °C. After heating 1 h, the samples were quantitatively transferred, with the aid of acetic acid, to 50 mL volumetric flasks that contained 10 mL of 2 M NaOH and 10 mL of acetic acid, and samples were diluted to 50 mL with acetic acid. The absorption at 280 nm for each sample was determined. All experiments were run in triplicate with duplicates for each treatment. The above alkali lignin solution was used to prepare the standard solution with concentrations of 0.01 g/L, 0.02 g/L, 0.03 g/L, 0.04 g/L and 0.05 g/L, and then draw the standard curve of alkali lignin content and UV absorbance.
Fourier transform infrared spectroscopy (FTIR)
In FTIR testing, the epidermis, phloem and pith of saplings were removed. And then the samples were dried to air-dry and ground to wood flour. KBr flour and wood flour were mixed and oven-dried for 24 hours under the conditions of 103 ± 2 °C. Then the mixture was cooled down in a desiccator. The flour was compressed into small pellets (the diameter was 13 mm). The prepared samples were placed in an infrared light (Nicolet Impact 410, USA) to acquire the spectroscopy data, five repeats for each sample, and three samples for each transgenic poplar were analyzed. The heights of characteristic peak were obtained by OMNIC software. The ratio of characteristic peaks height of corresponding chemical composition was used to compare the content of chemical components37–39.
Measuring relative degree of crystallinity (CrI%)
Three samples for each transgenic poplar sapling were measured. The flour with particle size from 0.175 to 0.246 mm was prepared by grinding the samples taken from the stems. The relative degree of crystallinity was measured with XRD. The XRD pattern was recorded within 2θ angles ranging from 5° to 40° and the scanning rate of 0.05° s−1. The relative degree of crystallinity (CrI%) was calculated according to equation 1 40:
| 1 |
where I002 represents both crystalline and amorphous parts, Iam represents only the amorphous part of the diffactogram.
Basic Density
Thirty samples for each transgenic poplar sapling were used to determine their basic density, the length of them were 15 mm. The epidermis, phloem and pith were removed, sample volume was measured by the drainage method and the density was calculated.
Nano indentation testing
Three strips in the size of 1 mm (R) × 1 mm (T) × 30 mm (L) for NI testing were prepared from the latewood. The epoxy resin was molded and they were placed in an oven at 60 °C for 36 h. The wood strips were then mounted into the embedding mold parallel to the l-axis of the cell wall using a new sample preparation method for small wood blocks without resin penetration41. The top surface was smoothed with a diamond knife in an ultramicrotome. The specimens were conditioned at 20 °C and a relative humidity of 65% for at least 24 h before NI test. The conditioned samples then were placed on the sample table of the nanoindenter (Triboindenter, Hysitron, USA). The diamond Berkovich indenter was used with the radius of indenter tip less than 100 nm and the taper angle of 142.35°. Quasi-static constant speed loading and unloading mode was set with the maximum load of 100 μN, the loading rate of 20 μN/s, and the loading time of 2 s. MOEs and hardnesses of samples were obtained from the valid indentations, three samplings were measured, and more than 30 valid indentations were found in every sample.
Statistical analysis
A one-way analysis of variance (ANOVA) was used for comparative analyses. A statistical analysis of the differences among all the plants was made using a t-test.
Data availability
The datasets generated during and/or analysed during the current study are available from the corresponding author on reasonable request.
Acknowledgements
The authors thank the National Key Research and Development Program of China (2017YFD0600202) and National Natural Science Foundation (31370562) for financial support.
Author Contributions
X.W.Z. performed the major experiments, analyzed the data, and prepared the manuscript. S.H.R. helped with the analysis of samples and data. M.Z.L. and S.T.Z. helped to prepare experimental materials and design the project. Z.J.C. helped with the manuscript preparation. R.J.Z. and J.X.L. designed the project, supervised the experiments, and finalized the manuscript. All authors read and approved the final manuscript.
Competing Interests
The authors declare no competing interests.
Footnotes
Publisher's note: Springer Nature remains neutral with regard to jurisdictional claims in published maps and institutional affiliations.
Contributor Information
Rongjun Zhao, Email: rongjun@caf.ac.cn.
Jianxiong Lv, Email: jianxiong@caf.ac.cn.
References
- 1.Fillatti JAJ, Sellmer J, Mccown B, Haissig B, Comai L. Agrobacterium mediated transformation and regeneration of populus. Mol. Gen. Genet. 1987;206:192–199. doi: 10.1007/BF00333574. [DOI] [Google Scholar]
- 2.Wei JH, Song YR. Recent advances in study of lignin biosynthesis and manipulation. Acta Bot. Sin. 2001;43:771–779. [Google Scholar]
- 3.Lin ZB, Ma QH, Xu Y. Lignin biosynthesis and its molecular regulation. Prog. Nat. Sci. 2003;13:321–328. [Google Scholar]
- 4.Zhao HY, Wei JH, Song YR. Advances in research on lignin biosynthesis and its genetic engineering. Acta physiol. Sin. 2004;30:361–370. [PubMed] [Google Scholar]
- 5.Bjurhager I, et al. Ultrastructure and mechanical properties of populus wood with reduced lignin content caused by transgenic down-regulation of cinnamate 4-hydroxylase. Biomacromolecules. 2010;11:2359–2365. doi: 10.1021/bm100487e. [DOI] [PubMed] [Google Scholar]
- 6.Hoffmann L, Maury S, Martz F, Geoffroy P, Legrand M. Purification, cloning, and properties of an acyltransferase controlling shikimate and quinate ester intermediates in phenylpropanoid metabolism. J Biol. Chem. 2003;278:95–103. doi: 10.1074/jbc.M209362200. [DOI] [PubMed] [Google Scholar]
- 7.Peng XP, Sun SL, Wen JL, Yin WL, Sun RC. Structural characterization of lignins from hydroxycinnamoyl transferase (HCT) down-regulated transgenic poplars. Fuel. 2014;134:485–492. doi: 10.1016/j.fuel.2014.05.069. [DOI] [Google Scholar]
- 8.Abdulrazzak N, et al. A coumaroyl-ester-3-hydroxylase insertion mutant reveals the existence of nonredundant meta-hydroxylation pathways and essential roles for phenolic precursors in cell expansion and plant growth. Plant Physiol. 2006;140:30–48. doi: 10.1104/pp.105.069690. [DOI] [PMC free article] [PubMed] [Google Scholar]
- 9.Chen F, et al. Multi-site genetic modulation of monolignol biosynthesis suggests new routes for formation of syringyl lignin and wall-bound ferulic acid in alfalfa (medicago sativa L.) Plant J. 2006;48:113–124. doi: 10.1111/j.1365-313X.2006.02857.x. [DOI] [PubMed] [Google Scholar]
- 10.Robinson AR, Mansfield SD. Rapid analysis of poplar lignin monomer composition by a streamlined thioacidolysis procedure and near-infrared reflectance-based prediction modeling. Plant J. 2009;58:706–714. doi: 10.1111/j.1365-313X.2009.03808.x. [DOI] [PubMed] [Google Scholar]
- 11.Lee Y, Chen F, Gallegogiraldo L, Dixon RA, Voit EO. Integrative analysis of transgenic alfalfa (medicago sativa L.) suggests new metabolic control mechanisms for monolignol biosynthesis. Plos Comput. Biol. 2011;7:1–13. doi: 10.1371/journal.pcbi.1002047. [DOI] [PMC free article] [PubMed] [Google Scholar]
- 12.Spokevicius AV, et al. β-tubulin affects cellulose microfibril orientation in plant secondary fibre cell walls. The Plant Journal for Cell & Molecular Biology. 2007;51:717–726. doi: 10.1111/j.1365-313X.2007.03176.x. [DOI] [PubMed] [Google Scholar]
- 13.Coleman HD, Cánovas FM, Man H, Kirby EG, Mansfield SD. Enhanced expression of glutamine synthetase (GS1a) confers altered fibre and wood chemistry in field grown hybrid poplar (Populus tremula X alba) (717-1B4) Plant Biotech. J. 2012;10:883–889. doi: 10.1111/j.1467-7652.2012.00714.x. [DOI] [PubMed] [Google Scholar]
- 14.Li X, Weng JK, Chapple C, Benning C, Pichersky E. Improvement of biomass through lignin modification. Plant J. 2008;54:569–581. doi: 10.1111/j.1365-313X.2008.03457.x. [DOI] [PubMed] [Google Scholar]
- 15.Hatfield R, Vermerris W. Lignin formation in plants. the dilemma of linkage specificity. Plant Physiol. 2001;126:1351–1357. doi: 10.1104/pp.126.4.1351. [DOI] [PMC free article] [PubMed] [Google Scholar]
- 16.Boerjan W, Ralph J, Baucher M. Lignin biosynthesis. Annu. Rev. Plant Biol. 2003;54:519–546. doi: 10.1146/annurev.arplant.54.031902.134938. [DOI] [PubMed] [Google Scholar]
- 17.Baucher M, Halpin C, Petitconil M, Boerjan W. Lignin: genetic engineering and impact on pulping. Crit. Rev. Biochem. Mol. 2003;38:305–350. doi: 10.1080/10409230391036757. [DOI] [PubMed] [Google Scholar]
- 18.Lu S, Zhou Y, Li L, Chiang VL. Distinct roles of cinnamate 4-hydroxylase genes in populus. Plant cell physiol. 2006;47:905–914. doi: 10.1093/pcp/pcj063. [DOI] [PubMed] [Google Scholar]
- 19.Liu S, et al. Isolation and characterization of a gene encoding cinnamate 4-hydroxylase from parthenocissus henryana. Mol. Biol. Rep. 2009;36:1605–1610. doi: 10.1007/s11033-008-9357-6. [DOI] [PubMed] [Google Scholar]
- 20.Li LB, Liu L, He CF, Dong YM, Peng ZH. Research progresses on the genes encoding the key enzymes in biosyn-thetic pathway of lignin. Mol. Plant Breeding. 2007;5:45–51. [Google Scholar]
- 21.Tan FR, et al. Application of transgenic technology in energy plant breeding. Curr. Biotech. 2014;34:1025–1026. [Google Scholar]
- 22.Wei JH, et al. Pulping performance of transgenic poplar with depressed caffeoyl-coa o-methyltransferase. Chinese Sci. Bull. 2008;53:3553–3558. doi: 10.1007/s11434-008-0405-3. [DOI] [Google Scholar]
- 23.Mahboubi A, et al. Aspen SUCROSE TRANSPORTER 3 allocates carbon into wood fibers. Plant Physiol. 2013;163:1729–1740. doi: 10.1104/pp.113.227603. [DOI] [PMC free article] [PubMed] [Google Scholar]
- 24.Song EH, Cai C, Wei G, Gao H, Xiang Y. Cultivation of low lignin poplar by RNA interference. Sci. Silva. Sin. 2010;46:39–44. [Google Scholar]
- 25.Horvath, B. Effect of lignin content and structure on the anatomical, physical and mechanical properties of genetically engineered aspen trees. Ph.D. Thesis, North Carolina State University, Raleigh (2009).
- 26.Hu WJ, et al. Repression of lignin biosynthesis promotes cellulose accumulation and growth in transgenic trees. Nat. Biotech. 1999;17:808–812. doi: 10.1038/11758. [DOI] [PubMed] [Google Scholar]
- 27.Ślesak I, et al. Phytoalexin deficient 4 affects reactive oxygen species metabolism, cell wall and wood properties in hybrid aspen (populus tremula L. × tremuloides) Plant Cell Environ. 2015;38:1275–1284. doi: 10.1111/pce.12388. [DOI] [PubMed] [Google Scholar]
- 28.Li, L. F. Extraction, modification and degradation of lignin with choline chloride-based deep eutectic solvents. Ph.D. Thesis, Northeast Forestry University, Harbin (2015).
- 29.Pingali SV, et al. Breakdown of cell wall nanostructure in dilute acid pretreated biomass. Biomacromolecules. 2010;11:2329–2335. doi: 10.1021/bm100455h. [DOI] [PubMed] [Google Scholar]
- 30.Chen F, Dixon R. Lignin modification improves fermentable sugar yields for biofuel production. Nat. Biotech. 2007;25:759–761. doi: 10.1038/nbt1316. [DOI] [PubMed] [Google Scholar]
- 31.Wang CG, Jiang ZH, Fei BH, Yu Y, Zhang SY. Effects of chemical components on longitudinal MOE and hardness of wood cell wall. J Beijing For. Univ. 2012;34:107–110. [Google Scholar]
- 32.Zhou XW, et al. Cell wall structure and mechanical properties of Salix psammophila. Wood Res. 2017;62:1–12. [Google Scholar]
- 33.Ciucanu I, Kerek F. A simple and rapid method for the permethylation of carbohydrates. Carbohydr. Res. 1984;131:209–217. doi: 10.1016/0008-6215(84)85242-8. [DOI] [Google Scholar]
- 34.Fukushima RS, Hatfield RD. Extraction and isolation of lignin for utilization as a standard to determine lignin concentration using the acetyl bromide spectrophotometric method. J. Agric. Food Chem. 2001;49:3133–3139. doi: 10.1021/jf010449r. [DOI] [PubMed] [Google Scholar]
- 35.Iiyama K, Wallis AFA. An improved acetyl bromide procedure for determining lignin in woods and wood pulps. Wood Sci. Tech. 1988;22:271–280. doi: 10.1007/BF00386022. [DOI] [Google Scholar]
- 36.Iiyama K, Wallis AFA. Determination of lignin in herbaceous plants by an improved acetyl bromide procedure. J. Agric. Food Chem. 1990;51:145–161. doi: 10.1002/jsfa.2740510202. [DOI] [Google Scholar]
- 37.Colom X, Carrillo F, Nogues F, Garriga P. Structural analysis of photodegraded wood by means of FTIR spectroscopy. Polym. Degrad. Stab. 2003;80:543–549. doi: 10.1016/S0141-3910(03)00051-X. [DOI] [Google Scholar]
- 38.Stevanic JS, Salmén L. Characterizing wood polymers in the primary cell wall of Norway spruce (Picea abies (L.) Karst.) using dynamic FT-IR spectroscopy. Cellulose. 2008;15:285–295. doi: 10.1007/s10570-007-9169-1. [DOI] [Google Scholar]
- 39.Pandey KK, Pitman AJ. FTIR studies of the changes in wood chemistry following decay by brown-rot and white-rot fungi. Int. Biodeterior. Biodegrad. 2003;52:151–160. doi: 10.1016/S0964-8305(03)00052-0. [DOI] [Google Scholar]
- 40.Segal LC, Creely J, Martin AEJ, Conrad CM. An empirical method for estimating the degree of crystallinity of native cellulose using the x-ray diffractometer. Text. Res. J. 1959;29:786–794. doi: 10.1177/004051755902901003. [DOI] [Google Scholar]
- 41.Meng YJ, et al. A novel sample preparation method to avoid influence of embedding medium during nano-indentation. Appl. Phys. A. 2013;110:361–369. doi: 10.1007/s00339-012-7123-z. [DOI] [Google Scholar]
Associated Data
This section collects any data citations, data availability statements, or supplementary materials included in this article.
Data Availability Statement
The datasets generated during and/or analysed during the current study are available from the corresponding author on reasonable request.


