

Abstract
The failure of DNA ligases to complete their catalytic reactions generates cytotoxic adenylated DNA strand breaks. The APTX RNA‐DNA deadenylase protects genome integrity and corrects abortive DNA ligation arising during ribonucleotide excision repair and base excision DNA repair, and APTX human mutations cause the neurodegenerative disorder ataxia with oculomotor ataxia 1 (AOA1). How APTX senses cognate DNA nicks and is inactivated in AOA1 remains incompletely defined. Here, we report X‐ray structures of APTX engaging nicked RNA‐DNA substrates that provide direct evidence for a wedge‐pivot‐cut strategy for 5′‐AMP resolution shared with the alternate 5′‐AMP processing enzymes POLβ and FEN1. Our results uncover a DNA‐induced fit mechanism regulating APTX active site loop conformations and assembly of a catalytically competent active center. Further, based on comprehensive biochemical, X‐ray and solution NMR results, we define a complex hierarchy for the differential impacts of the AOA1 mutational spectrum on APTX structure and activity. Sixteen AOA1 variants impact APTX protein stability, one mutation directly alters deadenylation reaction chemistry, and a dominant AOA1 variant unexpectedly allosterically modulates APTX active site conformations.
Keywords: APTX, Ataxia Oculomotor Apraxia 1, DNA repair, missense mutation, X‐ray crystallography
Subject Categories: DNA Replication, Repair & Recombination; Molecular Biology of Disease; Structural Biology
Introduction
DNA ligation is a central process in biology that finalizes genome maintenance metabolic processes including DNA replication, recombination, and DNA repair. Eukaryotic DNA ligases catalyze ligation via a three‐step, ATP‐dependent reaction. First, the DNA ligase active site lysine is adenylated. Second, the adenylate is transferred to a DNA 5′ phosphate to facilitate the third nick‐sealing step. Third, nucleophilic attack of a 3′‐OH on the activated 5′‐adenylate facilitates phosphodiester bond formation, and sealing of the DNA break (Pascal et al, 2004; Tomkinson et al, 2006). Environmental and metabolic sources of DNA damage prompt “abortive ligation”, the failure of ligase to complete step 3, and generation of 5′‐adenylated (5′‐AMP) DNA strand breaks (Ahel et al, 2006; Andres et al, 2015; Schellenberg et al, 2015) (Fig 1A). Triggers of abortive ligation include RNA‐DNA junction intermediates in ribonucleotide excision repair (RER) (Tumbale et al, 2014), single‐strand breaks with oxidative DNA base damage (e.g. 3′‐8‐oxo‐dG) (Parsons et al, 2005; Ahel et al, 2006; Harris et al, 2009), and DNA nicks bearing 5′ deoxyribose phosphate groups, such as those generated by base excision repair (BER) (Rass et al, 2007). In these contexts, it is hypothesized that DNA ligase exacerbates genome instability with the creation of complex 5′‐adenylated damage comprised of the instigating lesion, compounded by adenylation of the DNA 5′‐terminus.
Figure 1. X‐ray structure of hAPTX‐nicked‐RNA‐DNA complex.

- Schematic presentation of APTX 2‐step deadenylation mechanism.
- Concatemerized nicked RNA‐DNA duplex substrate bound in the structure of hAPTX‐nicked‐RNA‐DNA complex. The 6 bp upstream region is shown in blue, 8 bp downstream region, and the complementary template strand in black, 5′ ribonucleotide positioned at the nick junction in yellow, and N‐terminal α1‐helix in orange.
- Transparent surface representation of two APTX protomers (Pro1, cyan and Pro2, gray) bound to a single RNA‐DNA molecule containing two nick sub‐sites in each asymmetric unit. Simulated annealing omit 2Fo‐Fc electron density for the bound nicked RNA‐DNA (magenta) illustrates APTX engagement to DNA nick induces large‐scale DNA distortions at the nick.
- X‐ray structure of hAPTX‐nicked‐RNA‐DNA complex. N‐terminal α1‐helix is colored orange, HIT domain in light blue, Znf domain in light green, DNA in pink, RNA in yellow, AMP in teal, and HIT‐loop in dark green.
The aprataxin (APTX) RNA/DNA polynucleotide deadenylase directly reverses 5′‐AMP damage (Fig 1A) (Ahel et al, 2006; Harris et al, 2009; Reynolds et al, 2009; Tumbale et al, 2011, 2014) and associates with DNA repair scaffolds XRCC1 (Cherry et al, 2015) and XRCC4 (Breslin & Caldecott, 2009). Mutational inactivation of APTX is associated with elevated levels of oxidative DNA damage (Hirano et al, 2007; Harris et al, 2009), and increased DNA damage following treatment with the anticancer topoisomerase inhibitor CPT (Mosesso et al, 2005), and S. pombe Aptx mutants are sensitive to 4NQO (Deshpande et al, 2009). Genetic evidence implicates the budding yeast APTX homolog Hnt3p in repair of RNA‐triggered abortive ligation during ribonucleotide excision repair (RER) (Tumbale et al, 2014), as well as alkylation and oxidative DNA damage repair pathways (Daley et al, 2010). Aptx‐deficient mice expressing mutant superoxide dismutase (SOD1) show cellular survival defects in cultured cells (Carroll et al, 2015), and the genetic combination of Aptx and Tdp1 (tyrosyl‐DNA phosphodiesterase 1) knockout results in global defects in repair of oxidative and alkylation‐induced DNA damage (El‐Khamisy et al, 2009). The consequences of APTX dysfunction in humans are severe. APTX mutations are linked to the progressive neurodegenerative diseases ataxia with Oculomotor Apraxia 1 (AOA1) (Date et al, 2001; Moreira et al, 2001), ataxia with coenzyme Q10 (coQ10) deficiency (Quinzii et al, 2005), and a multiple system atrophy resembling Parkinson's disease (Baba et al, 2007). AOA1 mutations map to the APTX catalytic domain (Barbot et al, 2001; Moreira et al, 2001; Shimazaki et al, 2002; Le Ber et al, 2003; Tranchant et al, 2003; Criscuolo et al, 2004, 2005; Ito et al, 2005; Mosesso et al, 2005; Baba et al, 2007; Yokoseki et al, 2011) and cause variable age of disease onset. Yet, how these mutations impact the APTX structure and its polynucleotide deadenylase functions remains largely unknown.
Previous molecular structural interrogations of S. pombe (Tumbale et al, 2011; Chauleau et al, 2015) and human (Tumbale et al, 2014) APTX homologs by us and others have resolved how APTX engages blunt DNA duplex structures, and provided a basis for understanding the APTX direct‐reversal DNA deadenylation reaction. However, the presumed cognate substrates for APTX that arise during ribonucleotide excision repair (RER) and base excision repair are nicked DNA and RNA‐DNA junctions. How APTX senses DNA nicks and processes adenylation damage in these contexts remains undefined. It is also unknown whether the APTX structure and activity is regulated, and if so, how disease states might impact such regulation. To help resolve these questions, we have secured molecular snapshots of APTX in complex with nicked RNA‐DNA substrates and investigated its conformations throughout its reaction cycle using nuclear magnetic resonance (NMR) spectroscopy. We uncovered a DNA nick‐induced fit active site assembly mechanism that modulates APTX active site loop conformations. Furthermore, results from a comprehensive structural and functional characterization of AOA1 mutants provide a framework for understanding APTX inactivation in neurodegenerative disease. We find AOA1 mutations impair APTX function by impacting protein folding, altering active site chemistry, or by perturbing ligand‐dependent APTX conformational changes.
Results
Molecular architecture of APTX bound to nicked RNA‐DNA
To visualize APTX bound to a cognate reaction product harboring nicked RNA‐DNA and a cleaved AMP lesion, we surveyed 80 combinations of protein/RNA‐DNA complexes for co‐crystallization. Our combinatorial crystallization approach involved varying upstream and downstream duplex lengths surrounding a DNA nick, varying position of the nick, as well as concatemerization of DNA nicks within a single target nicked RNA/DNA substrate (Fig 1B). We obtained crystals (Appendix Fig S1A) diffracting to 2.4 Å resolution that contain two APTX catalytic domain (APTXcat, residues 165–342) protomers engaging a doubly nicked target structure (Fig 1B and C). Successful crystallization strategies ultimately utilized a concatemerized nick substrate with a 6 bp upstream and 8 bp downstream duplexes (Fig 1B). In addition, a 5′‐ribonucleotide is positioned at the nick junction. In this configuration, the structural snapshots captured in our crystal structures are representative of APTX bound to a nicked RNA‐5′‐3′‐DNA junction reaction product complex formed by APTX during repair of abortive ligation products created during ribonucleotide excision repair (RER) (Tumbale et al, 2014; Schellenberg et al, 2015).
The structure reveals how APTX induces large‐scale DNA duplex substrate distortions in order to access the 5′‐terminal adenylated lesion in the context of a nicked duplex. In each of the complexes captured in our crystals, abrupt DNA bending is governed by the APTX amino‐terminal helix, as previously hypothesized (Tumbale et al, 2011). This structure illuminates how APTX senses DNA damage through two discontinuous nucleic acid binding sub‐sites, dictated by both the HIT and Znf domains which together collaborate to sense the nick. The electron density for the bound nick target is well defined in the crystals (Fig 1C). Although the doubly nicked RNA‐DNA sequence is symmetrical, about an 8 bp double‐stranded palindromic region, in three‐dimensional space this twofold symmetry, is broken. Two nick‐bound APTX molecules bind the upstream region of the nick with distinct conformations (Appendix Fig S1B, and Materials and Methods). In both binding modes captured, APTX‐directed DNA wedging and penetration into the base stack results in the redirection of the base stack approximately orthogonal to the helical axis of the bound downstream region.
The major molecular interface at the DNA nick is mediated by the amino‐terminal HIT domain α‐helix (α1) that infiltrates the DNA base stack. Here, α1 serves as a doubly barbed “wedge” that splays the base stack apart (Figs 1D and 2A, orange helix). The planar rings of His166 and Trp167 together redirect the DNA duplex, imparting a ~90° bend to the substrate RNA‐DNA. The protein displaces the upstream half of the nick and unwinds both the 3′ and 5′ sides of the nick. This has two effects: First, extraction of the 5′‐terminus facilitates positioning of the adenylated lesion into the active site; and second, disruption of the 3′‐terminal side of the nick exposes the 3′ end.
Figure 2. DNA‐induced conformational ordering of N‐terminal α1‐helix.

- Molecular details of APTX‐DNA nick interface illustrate the N‐terminal α1‐helix wedges into the DNA base stack. His166 and Trp167 stack against the bases at the nick, bending the DNA duplex at a ˜90° and unwinding both the 3′ and 5′ ends of the damaged strand.
- Limited chymotryptic proteolysis of APTX. The unliganded full‐length APTX was proteolysed to C1 fragment (blue) mapped to the N‐terminus of the HIT domain. The C1 fragment was further degraded to C2 (magenta) and C3 (green), and mapped to the N‐term α1‐helix (orange box). Addition of blunt‐ended DNA, nicked DNA, and transition mimic DNA (adenosine (Ade) and orthovanadate ()) substrates resulted in proteolytic protection of C1. APTX was not protected from proteolysis when incubated with relaxed circular plasmid DNA. AOA1 K197Q active site mutant that is severely defective in DNA binding displays impaired DNA‐end‐dependent proteolytic protection.
- Locations of [methyl‐13C]‐labeled methionine residues (cyan) mapped in the catalytic core of APTX.
- Overlays of assigned 1H‐13C HSQC spectra of [methyl‐13C]methionine‐labeled wild‐type APTX in unliganded state (black), blunt‐ended RNA‐DNA substrate bound state (cyan), and nicked RNA‐DNA substrate bound state (red). The arrows indicate resonance shifts in response to DNA substrates.
- Overlays of assigned 1H‐13C HSQC spectra of [methyl‐13C]methionine‐labeled wild‐type APTX in unliganded state (black), adenosine‐VO3‐RNA‐DNA transition mimic state (blue), and nicked AMP and RNA‐DNA product bound state (purple). The arrows indicate resonance shifts in response to RNA‐DNA substrates.
- Kinetic parameters of APTX processing of 5′‐adenylated RNA‐DNA substrates, nicked (red) and blunt‐ended (cyan). Mean ± 1 SD (n = 3 technical replicates) is displayed.
DNA‐induced fit APTX conformational changes
Previous X‐ray structures of APTX bound to blunt‐ended DNA displayed two major APTX conformations differing by a conformational change of α1, a series of linked rearrangements of the histidine triad (HIT, HxHxH) substrate engagement loop, and additional compensating movements throughout the fused HIT‐Znf catalytic core (Tumbale et al, 2014). In a “closed”, and catalytically competent conformer, α1 packs against the HIT‐loop and aligns the active site nucleophile His260 for attack on the 5′‐AMP phosphorous atom. In comparison, a catalytically incompetent “open” conformer is typified by partial disengagement of the α1 helix from the HIT‐loop, and a misaligned active site (Appendix Fig S2A). Structural superpositions indicate the present nick‐bound APTX protomers are both found in the closed conformation, with the active site poised for catalysis (Appendix Fig S2B). Furthermore, in the DNA nick‐bound forms, His166 (α1) stacks against the upstream duplex (Fig 2A). Modeling the opened state with this DNA shows it would clash in the open conformation, suggesting the interaction of His166 with the upstream duplex reinforces a closed and catalytically competent active site. Collectively, these observations suggest that DNA substrate engagement regulates conformations of the HIT wedge helix and, in turn, active site assembly.
Difference distance matrix plot (DDMP) analysis (Appendix Fig S3) and a structural interpolation comparing the open and closed APTX conformational states (Movie EV1) reveals significant overall rearrangements of the HIT‐Znf scaffold. We thus hypothesized that substrate binding and catalysis are intimately associated with α1 conformational change. To test this, we probed the structural response of full‐length human APTX (hAPTXFL) to substrate and AMP lesion binding using limited proteolysis coupled to mass spectrometry. In the absence of DNA and the AMP lesion, chymotrypsin protease efficiently degrades hAPTXFL, yielding a metastable fragment (fragment “C1” aa 152‐342, blue, Fig 2B, and Appendix Fig S4). C1 is digested further by cleavages at Trp167 (C2) and Leu171 (C3) in the N‐terminal helix α1, revealing that in the absence of DNA, relative to the HIT‐Znf core, helix α1 is flexible, accessible to protease, and therefore partially unfolded in solution. Addition of blunt‐ended DNA or a nicked DNA oligonucleotide in the presence of AMP resulted in proteolytic protection of α1 (sites C2 and C3), consistent with a DNA‐induced conformational ordering of α1 (Fig 2B). Similar proteolytic protection was observed with incubation with nicked DNA, adenosine (Ade), and orthovanadate () under solution conditions that have been previously demonstrated to covalently trap an APTX transition‐like state (Tumbale et al, 2014; Fig 2B, lanes 11–15). That APTX was not protected from proteolysis when incubated with relaxed circular plasmid DNA indicates that helix α1 is specifically responsive to DNA damage binding at DNA ends and nicks (Fig 2B, lane 21–25 Appendix Fig S4). Moreover, an AOA1 active site mutant K197Q which impacts the active site DNA and AMP binding pocket displays impaired DNA‐dependent proteolytic protection (Fig 2B, lanes 27–45). Thus, DNA‐binding linked α1 conformational change is altered by AOA1 mutations linked to neurological disease.
Global conformational responses of the APTX catalytic domain during catalysis
To better define the response of the APTX catalytic domain (APTXcat) to substrate binding in solution, we investigated the behavior of 13CH3‐Met‐labeled APTXcat by NMR. The 13CH3‐Met labels provide seven probes distributed throughout APTXcat located proximal to α1 (Met164, Met175, and Met180), the HIT‐loop (Met256), and at three added positions remote from α1 and the active center (Met227, Met309, and Met296) (Fig 2C and Appendix Table S1). These probes are also coincident with regions shown to undergo motion in X‐ray structures (Appendix Fig S3). Distinct 13CH3‐Met resonance shifts are observed for apo (unliganded structure) compared with blunt‐ended or nicked DNA substrates (DNA in twofold molar excess; Fig 2D).
The 13CH3 shifts for Met164 are close to those expected for a methionine residue in a random coil (Butterfoss et al, 2010), consistent with the origin of this residue as a residual fragment from an N‐terminal His‐tag. Nevertheless, the M164 1H shift is sensitive to the presence of nicked DNA, most probably as a result of the stacking of nearby Trp167 against the rG1 residue at the nick. As a result of its position near the N‐terminus of helix α1, this observation underscores a key role for α1 in DNA nick recognition. Met175/Met180 (α1) and Met256 (HIT‐loop) also display substrate‐specific chemical shift perturbations. The large, downfield 1H shift of ~0.4 ppm for M256 is consistent with its position at the edge of the Trp167 indole side chain in the nicked DNA complex (Appendix Table S1, Fig 2D). Consistent with these substrate‐dependent conformational responses, kinetic analysis of APTX deadenylation reaction (Fig 2F) yielded distinct parameters for APTX deadenylase activity on blunt (K m = 37.1, kcat = 0.51/s) versus nicked (K m = 17.1 nM, k cat = 0.38/s) substrates, with APTX displaying superior catalytic efficiency on nicked DNA (k cat/K m = 0.022 nicked, k cat/K m = 0.014 blunt DNA).
To obtain further insight into catalysis‐related conformational changes, we measured the 13CH3‐Met resonance shifts to compare (i) Apo (Black, Fig 2E), (ii) reaction transition state (blue, Fig 2E), and (iii) product states (purple, Fig 2E). Comparison of 13CH3‐Met spectra shows that major changes in the molecular environment of Met256 (HIT‐loop), Met175, and Met180 (α1) occur during the APTX reaction cycle. Strikingly, the methyl resonances of Met227, Met309, and to a lesser extent, Met296, corresponding to residues located removed from the active site (> 10–15 Å, Appendix Table S1) and substrate binding regions of the enzyme, also exhibit significant substrate (Fig 2D) and reaction‐state (Fig 2E)‐dependent chemical shift behaviors. The chemical shift sensitivity of residues remote from the active site may be amplified by proximity to shift‐inducing aromatic residues. For instance, the M227 shift may be responsive to small positional variations relative to Y250. Overall, these NMR solution results are consistent with our X‐ray structures and proteolysis indicating conformational change in α1 and the HIT‐loop is coincident with a global APTX conformational response to DNA engagement. These observations further implicate a DNA regulated active site assembly/disassembly cycle in catalysis.
APTX mutations variably impact protein folding and activity
The crystallographically defined APTX intermediate states and NMR characterized ligand‐dependent conformational changes provide a framework for understanding the molecular consequences of the many known AOA1‐linked missense mutations. A subset of APTX mutants have been demonstrated to harbor defects in a weak APTX AMP‐lysine hydrolase activity (Seidle et al, 2005). However, for the majority of AOA1 variants, the molecular and functional impacts on APTX RNA‐DNA deadenylase activity have not been assessed. Several AOA1 mutations are single amino acid substitutions within the protein core or lead to premature protein truncations (Fig 3A and Appendix Fig S5). We thus evaluated the impact of AOA1 mutations on protein folding. First, we tested the solubility of 17 AOA1‐linked missense and nonsense mutants expressed in E. coli. With the exception of two nonsense variants (R247X and W279X), all proteins expressed at comparable levels as assessed by Western blotting to a 6x‐His‐tag in the recombinant protein (Fig 3B). In contrast, analysis of the soluble protein fractions revealed marked variability in solubility. Six mutants (A198V, H201R, P206L, G231E, R247X, W279X) were entirely insoluble, revealing these substitutions are poorly tolerated in the APTX structure. Examination of the molecular environments of these amino acid positions (Appendix Fig S5) shows these mutations are likely to disrupt folding of the HIT domain. The remaining 11 AOA1 variants (D185E, K197Q, R199H, H201Q, L223P, S242N, L248M, V263G, D267G, W279R, R306X) (Fig 3B) display wide ranging solubility, suggesting these mutations differentially impact protein stability and activity.
Figure 3. AOA1 mutagenic effects on APTX solubility, stability, and catalytic activity.

- APTX mutations in AOA1 map to the catalytic core of APTX comprising the HIT (blue) and Znf (green) domains.
- Solubility of 17 AOA1‐linked APTX missense and nonsense mutants expressed in E. coli was assessed by Western blotting. With the exception of two nonsense variants (R247X and W279X), all proteins expressed at comparable levels. The soluble protein fractions revealed marked variability in solubility.
- Thermal melting profile of APTX mutants. Unfolding of APTX proteins was monitored using SYPRO Orange fluorescent dye. The midpoint temperature (T m) for APTX wild‐type and mutants in unliganded (bottom) and AMP bound (top) conditions is displayed. X = unable to determine T m, *P‐value < 0.05, **P‐value < 0.01, N.S. = not‐significant, two‐tailed t‐test. Mean ± 1 SD (three technical replicates) is shown.
- Deadenylation activity of APTX mutants. Tenfold dilutions of APTX mutant proteins were tested for deadenylation on a TAMRA labeled 5′‐adenylated nicked RNA‐DNA substrate at 25 and 37°C. Reaction products were resolved on 15% TBE‐urea denaturing gels and visualized by fluorescence scan. Fold increase in protein to reach 50% activity relative to wild‐type APTX is displayed. Mean ± 1 SD (3 technical replicates) is displayed.
To further define the molecular basis for AOA1 defects, we purified soluble variants (Fig 3B, Appendix Fig S6) and measured protein thermal stabilities and RNA‐DNA deadenylase activities (Fig 3C, Appendix Figs S6 and S7A, and Dataset EV1). Thermal shift assays derive a thermal melting point transition from fluorescence of Sypro Orange dye binding to the protein hydrophobic core as the protein undergoes heat‐induced unfolding, in the presence or absence of bound ligands (Huynh & Partch, 2015) (Fig 3C). With the exception of L248M, all mutants displayed statistically significant decreases in protein thermal stability compared to WT. In the absence of ligand, accurate T m values for D185E, H201Q, V263G, and L223P could not be determined due to their intrinsic instability under the conditions examined. Addition of AMP (the APTX deadenylation reaction product) induced a positive thermal stability shift for WT (T m‐Apo = 50.1°C, T m‐AMP = 53.6°C). All AOA1 mutants, including those whose T m could not be determined without ligand, were also stabilized by AMP. Interestingly, L248M is more thermostable than WT in the presence of AMP.
To test the hypothesis that AOA1 mutations compromise APTX RNA‐DNA processing capacity, we evaluated 5′‐adenylated RNA‐DNA reversal activity of purified mutant proteins. Two temperatures (22 and 37°C) were used to test temperature‐dependent effects on catalysis (Fig 3D, Appendix Figs S6A and C, and S7B). This analysis shows that to varying degrees, all mutants were impaired in their ability to process 5′‐adenylated RNA‐DNA substrates. Consistent with stability defects, a majority of the AOA1 mutants (K197Q, S242N, R306X, W279R, D267G, H201Q, V263G, L223P) displayed a ~2‐ to 8‐fold more severe catalytic impairment at 37°C compared to 22°C (Fig 3D and Appendix Fig S6C).
Molecular bases for APTX inactivation in AOA1
Given the complex differences in the effects on thermal stability and catalytic activity, and the variable age of onset conferred by AOA1 mutations, we sought to better define the root molecular causes of AOA1‐linked APTX defects. We utilized a blunt‐ended substrate for co‐crystallization with mutant APTX (Tumbale et al, 2014). This substrate yields crystals that grow rapidly (within 24 h) and typically diffract to higher resolution compared to nicked‐DNAs whose protracted crystallization times proved intractable for structural analysis of destabilizing mutations. For five amenable variants (V263G, H201Q, S242N, R199H, and L248M), we successfully crystallized and determined X‐ray structures of mutant proteins as ternary complexes with RNA‐DNA and AMP (Fig 4, Appendix Table S2). The remaining mutants precipitated rapidly and could not be successfully crystallized under the conditions examined.
Figure 4. X‐ray structures of AOA1 mutants.
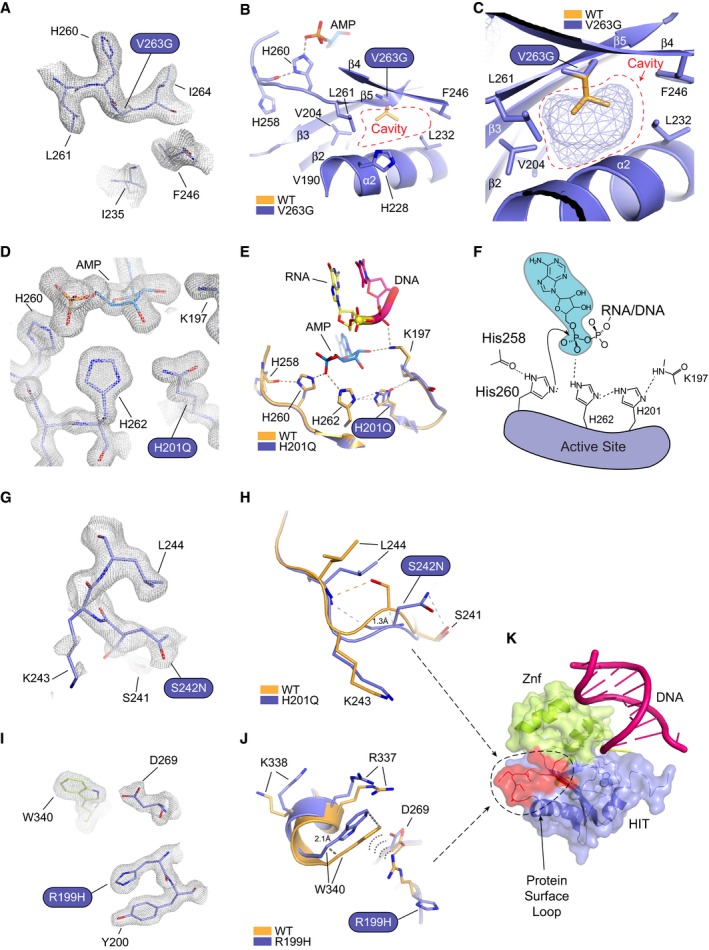
- Omit 2Fo‐Fc electron density for the V263G mutant.
- X‐ray structure of the V263G mutant (blue) overlaid upon wild‐type APTX (orange). Val263 maps to β5 and is a hydrophobic core residue engaging in close Van der Waals interactions with neighboring hydrophobic residues. The structure of V263G shows the mutation creates a large cavity in the hydrophobic core, resulted from the loss of the valine side chain.
- Mesh space filled presentation illustrates a cavity in APTX hydrophobic core created by the V263G mutation.
- Omit 2Fo‐Fc electron density for the H201Q mutant.
- X‐ray structure of the H201Q mutant (blue) overlaid upon wild‐type APTX (orange). His201 participates in a charge relay mechanism that stabilizes the transition state of the APTX deadenylation reaction.
- Schematic presentation of the APTX active site. A charge relay consists of the main‐chain amide of Lys197, His201, and His262 that hydrogen bonds to the scissile phosphate of the 5′‐adenylate phosphoanhydride. The structure of H201Q reveals the disruption to the charge relay network.
- Omit 2Fo‐Fc electron density for the S242N mutant.
- X‐ray structure of the S242N mutant (blue) overlaid upon wild‐type APTX (orange). Ser242 maps to a surface loop. The native loop conformation in wild‐type APTX is stabilized through hydrogen bond between Ser242 hydroxyl and Leu244 main‐chain amide. The serine to asparagine mutation causes rearrangements of side‐chain contacts resulting in an altered loop structure with a 1.3 Å shift at the Ser242 Cα.
- Omit 2Fo‐Fc electron density for the R199H mutant.
- X‐ray structure of the R199H mutant (blue) overlaid upon wild‐type APTX (orange). Arg199 forms a salt bridge with Asp269 and a cation‐π interaction with C‐terminal residue Trp340. The arginine to histidine mutation causes the loss of these contacts resulting in an altered protein surface structure with a 2.1 Å shift from the protein core.
- Surface representation of APTX RNA‐DNA complex showing both S242N and R199H mapped on a putative protein binding surface.
V263G: Val263 maps to the β‐strand bearing the APTX catalytic nucleophile His260 and is a hydrophobic core residue engaging in Van der Waals interactions with neighboring Leu261 (β5), Val204 (β3), Ile232 (α2), His228 (α2), Phe246 (β4), and Val190 (β2). The structure of V263G (at 2.90 Å, Fig 4A–C) reveals the mutation creates a sizeable cavity in the hydrophobic core corresponding to loss of the valine side chain. Similar to core cavitation mutants of BRCA1 (Williams et al, 2003, 2004), V263G has severe impacts on stability (Fig 3C, and Appendix Fig S6C) and temperature‐dependent activity, being ~7‐fold more impaired for deadenylation activity at 37°C compared to 22°C (Fig 3D, Appendix Figs S6A and C).
H201Q: While His201 falls outside of the so‐called HIT domain histidine triad motif, it is highly conserved in HIT domain phosphohydrolases, including APTX homologs. Based on the structure of an adenosine‐vanadate transition‐like state mimic, it is proposed that His201 enables stabilization of the negatively charged transition state of the deadenylation reaction (Tumbale et al, 2014; Schellenberg et al, 2015) via its participation in a charge relay consisting of the main‐chain backbone of Lys197, His201, and His262 that hydrogen bonds to the scissile phosphate of the 5′‐AMP phosphoanhydride (Fig 4D–F). The high‐resolution structure of H201Q (at 1.65 Å) reveals the effects of this substitution on active site chemistry from the histidine to glutamine mutation (Fig 4D and E). In the structure of the H201Q mutant, although the active site undergoes minimal gross structural rearrangements, this charge relay is compromised, likely resulting in the significant reduction in catalytic activity (Fig 3D, Appendix Fig S6A and C) and protein stability (Fig 3C, and Appendix Fig S6C). Intriguingly, while seemingly well accommodated in the active site, the H201Q substitution also confers substantial temperature‐dependent effects on catalysis. Close analysis of the backbone conformations of the Tyr200‐Gln201 peptide bond reveals that a strained, but permissible deviation of peptide bond planarity (172–173°) is observed compared to wild‐type APTX (Tumbale et al, 2014). This non‐native backbone conformation in part could explain the thermal stability defect for H201Q.
S242N: Ser242 maps to a surface loop linking α2 and β4. The native loop conformation is stabilized by a hydrogen bond between the Ser242 hydroxyl and Leu244 main‐chain peptide amide (Fig 4G and H). However, in the structure of the S242N mutant the Asn242 side‐chain hydrogen bonds to Ser241 instead. These contacts stabilize rearrangements and an altered loop structure with a 1.3 Å shift at the Ser242‐Cα between the wild‐type and mutant structures. Overall impacts in protein folding are mild (ΔTm = 3.5°C) (Appendix Fig S6C), consistent with a surface loop destabilization of the structure.
R199H: Arg199 forms a salt bridge with Asp269, as well as participates in cation‐π interactions with Trp340 (Fig 4I and J). The structure of the mutant reveals these interactions are lost in R199H. Trp340 shifts away from the protein core by 2.1 Å and the surrounding region of the Znf (α6) shifts ~0.5 Å away from the HIT domain. This suggests R199H destabilizes the HIT‐Znf domain interface and explains the observed APTX stability (ΔTm = −6.7°C) and catalytic (14‐ to 18‐fold reduced) defects. Intriguingly, the effect of this mutation propagates up into the region affected by S242N (α2–β4), and Ser242 makes an additional hydrogen bond to the carbonyl of Ala239. Thus, we hypothesize that by altering a common region of APTX these mutations may also affect a putative protein binding surface of currently unknown function (Fig 4K).
L248M: The dominant L248M APTX mutant was identified in AOA1 patients with severe clinical phenotype presenting early disease onset and a progressive ataxic syndrome with cerebellar atrophy, mental retardation, and epilepsy (Table 1) (Castellotti et al, 2011). This substitution is conservative and slightly stabilizing in the presence of AMP (Fig 3C), yet unexpectedly has a ~7‐fold impact on APTX deadenylation at 37°C (Fig 3D, Appendix Fig S6C). Intriguingly, the crystal structure of L248M shows limited overall conformational perturbation of the DNA bound protein, with structural changes limited to minor shifts in neighboring His228 (Fig 5A). However, Leu248 maps to strand β4, is found in the protein hydrophobic core, and flanks regions of the protein undergoing conformational changes between the catalytic domain closed and opened states (Appendix Fig S2). These conformational changes extend from α1 to residues surrounding the active site and Leu248 also participates in this network. Thus, we hypothesized that L248M might impact solution conformational states of the protein.
Table 1.
Impacts of AOA1 mutations
| Mutants | Allele | Classes | Solubility | Predicted mutagenic effects on APTX structure and function | Mean age at onset (year of age) | Disease severity | References |
|---|---|---|---|---|---|---|---|
| A198V | A198V/A198V;A198V/P206L | Highly destabilizing | − | The larger valine side chain causes steric clash, disrupting bonding interactions at HIT and Znf domain interface. | 5 | XX | Le Ber et al (2003), Criscuolo et al (2004) |
| P206L | P206L/P206L;A198V/P206L | Highly destabilizing | − | The larger leucine side chain causes steric clash, disrupting hydrophobic interactions. | 11 | XX | Date et al (2001), Criscuolo et al (2004), Castellotti et al (2011), Moreira et al (2001) |
| G231E | G231E/689insT | Highly destabilizing | − | The larger and charged glutamate side chain causes steric clash, disrupting hydrophobic interactions. | 1 | XXX | Ito et al (2005) |
| R247X | R247X/R247X | Highly destabilizing | − | Truncation at R247 causes loss of the entire Znf domain. | n.r. | n.r. | Mosesso et al (2005) |
| W279X | W279X/W279X;D267G/W279X;W279X/R306X;W279X/Q181X;W279X/I159 fs | Highly destabilizing | − | Truncation at W279 causes loss of the entire Znf domain. | 5 | XX | Le Ber et al (2003), Castellotti et al (2011), Barbot et al (2001), Moreira et al (2001) |
| H201R | H201R/H201R | Highly destabilizing | − | The larger arginine side chain causes steric clash in the active site, resulting in protein unfolding. | 7.5 | XX | Shimazaki et al (2002) |
| H201Q | H201Q/H201Q | Moderately destabilizing | + | Distortion of active site architecture and chemistry. | 29 | X | Criscuolo et al (2004) |
| D185E | D185E/WT | Moderately destabilizing | + | The larger glutamate side chain disrupts H‐bonding contacts and causes steric clash. | 18 | X | Castellotti et al (2011) |
| L223P | L223P/L223P | Moderately destabilizing | ++ | The leucine to proline mutation causes kinking in α2, altering protein surface. | 40 | X | Criscuolo et al (2005) |
| W279R | W279R/W279R;W279R/IVS5 + 1 | Moderately destabilizing | ++ | The larger and charged arginine side chain disrupts hydrophobic contacts, causing protein instability. | 5 | XX | Le Ber et al (2003), Castellotti et al (2011) |
| D267G | D267G/W279X | Moderately destabilizing | + | The smaller and uncharged glycine side chain causes loss of bonding contacts at the HIT and Znf domain interface. | 16.5 | XX | Le Ber et al (2003) |
| V263G | V263G/V263G;V263G/P206L | Moderately destabilizing | + | The smaller glycine side chain creates a cavity in protein core. | 19–25a | X | Date et al (2001), Yokoseki et al (2011) |
| K197Q | K197Q/W279X | Mildly destabilizing | +++ | The glutamine side chain causes loss of contacts with DNA phosphate and AMP ribose, impairing DNA binding. | 15 | XX | Tranchant et al (2003) |
| R199H | R199H/? | Mildly destabilizing | +++ | The arginine to histidine mutation results in altered putative protein binding surface. | 2.5 | XX | Barbot et al (2001), Moreira et al (2001) |
| S242N | S242N/? | Mildly destabilizing | +++ | The serine to asparagine mutation results in rearrangement of side chain contacts, altering surface loop structure. | 38 | X | Baba et al (2007) |
| R306X | R306X/R306X;R306X/W279X | Mildly destabilizing | +++ | Truncation at R306 causes partial loss of Znf domain. | 6.5 | XX | Castellotti et al (2011) |
| L248M | L248M/WT | Stabilizing | +++ | The leucine to methionine mutation hinders allosteric regulation of active site assembly coupled to catalysis. | 1–16a | XX‐XXX | Castellotti et al (2011) |
+++ = comparable to WT, ++ = moderately soluble, + = mildly soluble, − = insoluble, XXX = age onset < 2 years of age, XX = age onset > 2–18 years of age, X = age onset > 18 years of age, n.r. = not reported.
Exact age not reported.
Figure 5. X‐ray crystallographic and NMR analyses of L248M.
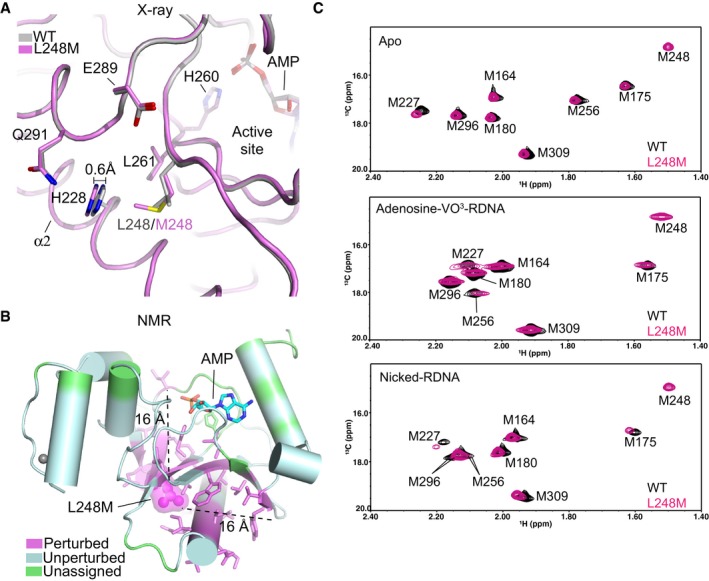
- X‐ray structural overlays of AOA1 mutant L248M (purple) and wild‐type APTX (gray).
- Location of residues exhibiting 1H‐15N NMR chemical shift perturbation (also see Appendix Fig S8) due to the L248M mutation. Perturbed (magenta), unperturbed (cyan), unassigned (green).
- Assigned 1H‐13C HSQC spectral overlay of [methyl‐13C]methionine‐labeled wild‐type APTX and L248M mutant in APO (top), transition state (middle), and product bound state (bottom).
Consistent with this hypothesis, and in stark contrast to the DNA bound X‐ray structure of the L248M protein, apo L248M displayed significant global conformational perturbations in 1H‐15N HSQC spectra of unliganded protein compared to WT (Fig 6B, Appendix Fig S8). The mutant impacts residue resonances that are > 16 Å from the mutation site. Similarly, the 1H‐13C‐Met HSQC spectra showed non‐native chemical shifts for L248M in a subset of both the Apo and reaction product bound states (Fig 5C). However, these differences were less apparent than those observed for WT versus L248M 1H‐15N samples (Appendix Fig S8 and Fig 5B). By comparison, the transition‐like state (adenosine‐vanadate reacted) displayed very similar 1H‐13C HSQC‐Met spectra for WT and L248M APTX (Fig 5C, middle panel), consistent with the mutant protein being trapped in a catalytically competent state. That is, while apo and product states are non‐native, covalent trapping of the transition state might mitigate these conformational differences. Given the distance from the catalytic center (> 10 Å), we assert that L248M substitution impacts active site assembly allosterically, possibly through a network of interactions within the protein core that are influenced by this substitution (Fig 5B).
Figure 6. A wedge‐pivot‐cut mechanism underlies alternate 5′‐AMP processing pathways.

- The APTX α1 wedges into the damaged nick, inducing a ˜90° bend in the DNA and exposing both the 3′ and 5′ termini. In addition to APTX, DNA polymerase β (POLβ) and FEN1 nucleases provide alternate processing pathways for 5′‐AMP repair.
- Direct reversal of adenylation by APTX.
- Endonucleolytic incision of the damaged 5′ adenylated strand by FEN1.
- Removal of adenylated 5′‐deoxyribose phosphate (5′‐dRP) by POLβ.
Discussion
Our APTX nicked RNA‐DNA complex X‐ray structure, NMR analysis of solution APTX‐DNA binding properties, and structural and biochemical characterization of AOA1 mutants provided us with three important new insights into APTX structure and inactivation in disease. First, we have illuminated the conserved determinants of APTX nicked DNA engagement that facilitate the APTX deadenylation direct‐reversal DNA repair reaction. Second, the APTX catalytic core is dynamic and regulated by substrate engagement. Structural rearrangements involve the amino‐terminal DNA nick sensing helical wedge and reorganization of the APTX active site, indicating that APTX employs a DNA damage‐induced fit mechanism for substrate recognition and active site assembly. Third, this work defines a detailed framework for understanding and categorizing the impacts of APTX catalytic domain missense and nonsense substitutions linked to AOA1 neurological disease.
The APTX double‐barbed wedge segregates the upstream and downstream halves of the DNA damage site to facilitate a “wedge‐pivot‐cut”‐mediated DNA damage direct‐reversal reaction. 5′‐AMP strand binding is fortified through the HIT‐Znf composite DNA binding interface. Data from biochemical analysis of the R306X AOA1 truncation variant support the conclusion that two‐point engagement of the lesion bearing strand enables efficient deadenylation repair. At the damaged DNA nick juncture, the aromatic histidine and tryptophan rings of the APTX α1 wedge induce DNA splaying with a ~90° bend. Such helical wedging provides a pivot point for the redirection of 5′ and 3′ strands, and this mechanism emerges as a common theme in DNA nick recognition. Notable similar examples include DNA polymerase β (POLβ) and FEN1 nucleases, both of which provide alternate processing pathways for 5′‐AMP repair (Daley et al, 2010; Caglayan & Wilson, 2017; Uson et al, 2017). Strikingly, these enzymes catalyze diverse reactions: (i) direct reversal of adenylation (APTX), (ii) AP lyase removal of damaged termini, in the case of abortive ligation on 5′‐deoxyribose phosphate (5′‐dRP) nicks (POLβ), or (iii) endonucleolytic incision of the damaged 5′ strand (FEN1) (Fig 6A) (Tsutakawa et al, 2011). These convergent solutions to resolving adenylated 5′‐DNA ends all involve wedge‐pivot‐cut strategies built upon diverse domain folds and chemistry for removal of bulky adenylated termini (Fig 6B–D). Given that 3′ DNA damage can initiate the abortive ligation cycle (Harris et al, 2009; Daley et al, 2010; Schellenberg et al, 2015), we speculate APTX‐DNA wedging might also permit access to the 3′ terminus for concerted or subsequent action of DNA‐end repair enzymes such as polynucleotide kinase/phosphatase (Bernstein et al, 2005) for processing of 3′ damage flanking the adenylated lesion from abortive DNA ligase action.
Conformational changes and disorder‐to‐order transitions of the wedge helix regulate assembly of the APTX active site lid. Based on the observed structural states, NMR spectroscopy and protease protection results, the DNA wedge helix adopts at least three states: (i) a disordered ligand free state, (ii) an α‐helical DNA bound pre‐catalytic (opened) state, and (iii) a closed α‐helical catalytically competent conformer with an aligned APTX HIT active site loop. This mobile catalytic framework is further impacted by APTX mutations. The conformational changes observed in our structures extend deep into the protein core. Strikingly, hydrophobic core residues undergoing conformational changes in our structures are flanked by residues mutated in AOA1, including the beta sheet residue Leu248 (Castellotti et al, 2011). NMR results show the L248M mutation impacts a network of surrounding secondary structure, rendering the domain “arthritic”, such that DNA binding‐induced conformational changes are impaired. The Leu248 side chain on β4 extends toward Gly231 on helix α2. Glycine is generally considered to be an unfavorable residue for α‐helix stability (Malkov et al, 2008), but its position opposite Leu248 on β4 indicates that it may reinforce correct alignment of β4 with α2. The presence of the smaller Gly side chain paired with larger opposing side chains in adjacent structural elements has been suggested to play similar roles in other structures (Eilers et al, 2002; Liu et al, 2005; Mueller et al, 2005). In APTX, this arrangement allows Leu248 to intercalate between α2‐helix residues His228 and Ile235. Extension of the Met248 methyl group into the face of His228 is primarily responsible for the extreme upfield 1H shift of the methyl resonance (Fig 5C).
Overall, the solubility, protein stability, and activity assays broadly segregate AOA1 mutations into four protein stability classes (Table 1, Fig 7) defined here as follows: (i) highly destabilizing insoluble mutants (R247X, W279X, A198V, H201R, P206L, and G231E), (ii) moderately destabilizing mutations with T m‐Apo and T m‐AMP < 40°C (D185E, W279R, L223P, V263G, D267G, and H201Q), (iii) mildly destabilizing with T m‐Apo and T m‐AMP > 40°C (K197Q, S242N, R199H, and R306X), and (iv) stabilizing in the presence of ligand (L248M). Our biophysical results provide an atomic level rationale for instability of APTX mutant protein variants in AOA1 patient mutation derived cell lines that has been reported for several of the variants (W279X, P206L, V263G, R306X) (Gueven et al, 2004; Hirano et al, 2007; Castellotti et al, 2011) studied here and suggest that APTX protein destabilization is a common mode of inactivation in AOA1. Specific added functional defects for three mutants that impact DNA binding (K197Q), active site assembly/conformational changes (L248M), and deadenylation reaction and active site chemistry (H201Q) can be ascribed (Fig 7). Previous work showed that the K197Q mutation directly influences the substrate binding pocket (Tumbale et al, 2014), consistent with the impact on DNA binding‐induced ordering of the wedge helix (Fig 2B). The stabilizing effect of L248M and its allosteric impact on catalytic domain conformations suggest that this mutation influences active site assembly and disassembly. Precisely how the H201Q substitution disrupts the APTX charge relay system will require future NMR or neutron scattering analysis of active site protonation states.
Figure 7. Molecular impacts of AOA1 mutations on APTX structure and activity.

AOA1 mutations are broadly classified into four classes based on their thermal stability: (i) highly destabilizing, (ii) moderately destabilizing, (iii) mildly destabilizing, and (iv) stabilizing. The highly destabilizing mutations cause protein unfolding. Other mutations reduce protein stability. AOA1 mutations have deferential impacts on APTX activity. The K197Q mutation causes DNA binding defects, L248M impairs active site assembly, and H201Q abolishes active site chemistry.
A survey of age of onset and disease severity does not yield clear correlates with protein stability or catalytic activity (Table 1). This suggests that additional genetic and/or environmental factors influence disease onset and progression. The progressive nature of AOA1 is typified by complex gene–environment interactions rooted in both mitochondrial and nuclear DNA repair defects conferred by APTX deficiency (Sykora et al, 2011; Akbari et al, 2015; Schellenberg et al, 2015). The subtle but ultimately catastrophic protein alterations defined herein likely trigger a cascade of molecular, cytological, and tissue‐level degenerative developments in a time span of years to decades. Individual outcomes are also likely to be context dependent and may be impacted by the extent to which other repair pathways such as FEN1‐dependent excision (Daley et al, 2010) are able to compensate for the loss of APTX activity. It has also been demonstrated that the base excision DNA repair proteins PARP‐1, apurinic endonuclease 1 (APE1), and OGG1 are expressed at reduced levels in AOA1 cells concomitant with loss of APTX protein (Harris et al, 2009). Thus, a complex interplay between APTX deficiency and the modulation of base excision repair BER capacity in AOA1 also exists. Together, the results provide a mechanism for APTX deficiencies in AOA1 that may directly be linked to APTX catalytic deficiency and instability, and/or to more complex alterations in the APTX protein interactome that includes key base excision repair factors.
Our integrated APTX functional and structural studies provide testable structural paradigms for DNA‐nick and DNA‐end cleansing enzymes in the DNA damage response pathways, and better establish a molecular platform for understanding APTX dysfunction in neurodegenerative disease. Though AOA1 is a rare disorder, outcomes of this research have broad implications for understanding modes of APTX mutagenic inactivation in disease and individual genetic susceptibility to environmentally induced DNA damage. Micro‐RNA modulation of APTX expression can radio‐sensitize tumor cells (Wang et al, 2016). Thus, rational design of inhibitors that modulate APTX‐DNA‐end and DNA‐nick deadenylation activities stemming from this work could be useful for treatment of cancers, or as a co‐therapy with existing chemotherapeutics that induce “dirty” complex structured DNA breaks.
Materials and Methods
Cloning, mutagenesis, protein expression, and purification
His‐tagged human APTX (hAPTX) protein variants were expressed and purified as previously described with some modifications (Tumbale et al, 2014). hAPTX variants were generated using QuickChange site‐direct mutagenesis kit (Stratagene). hAPTX wild‐type and variants were expressed as N‐terminal His‐tagged proteins in E. coli Rosetta 2 (DE3) cells (Novagen). Cell cultures were grown at 37°C in LB medium supplemented with ampicillin (100 μg/ml) and chloramphenicol (34 ng/ml) until A 600 reached 1, at which 50 μM IPTG was added to cell cultures. Protein expression was carried out at 16°C overnight. Cells were harvested by centrifugation (16,000 g, 10 min). Cell pellet was resuspended and lysed in 30 ml (50 mM Tris, pH 8.5, 500 mM NaCl, 10 mM imidazole, 0.1 g lysozyme/1l pellet, 1 tablet Roche mini EDTA‐free protease inhibitor cocktail) and incubated at 4°C for 30 min, followed by sonication. The soluble fraction was applied to Ni‐NTA resins (5 ml packed volume) (Qiagen) and washed with 100 ml (50 mM Tris, pH 8.5, 500 mM NaCl, 10 mM imidazole), 15 ml (50 mM Tris, pH 8.5, 500 mM NaCl, 30 mM imidazole). The His‐tagged protein was eluted in 15 ml (50 mM Tris, pH 7.5, 500 mM NaCl, 300 mM imidazole). The His‐tag was removed by thrombin cleavage (50 U) (Sigma) at 4°C overnight. The untagged protein was purified on a Superdex 75 gel filtration column (GE healthcare) in gel filtration buffer (50 mM Tris, pH 7.5, 500 mM NaCl, 5% glycerol, 0.1% βmercaptoethanol), followed by cation exchange chromatography on HiTrap SP HP 5 ml column (GE healthcare). The purified proteins were analyzed by SDS–PAGE and stored in 25 mM Tris, 150 mM NaCl, 5% glycerol at −80°C until use.
15N‐ and 13C‐methionine labeling hAPTX
The 13C‐methionine‐labeled hAPTX proteins were expressed in E. coli Rosetta 2 (DE3) cells in M9 growth medium containing ampicillin (100 μg/ml) and chloramphenicol (34 ng/ml) (supplemented with 0.5% glucose, 2 mM MgSO4, 1,000× trace metals (200 μl/l), 20 amino acids (except for proline, alanine and glycine) (200 mg/l), 200 mg/l 13C‐methyl methionine. The 15N‐labeled proteins were expressed in M9 medium containing 15NH4Cl with ampicillin (100 μg/ml) and chloramphenicol (34 ng/ml). Protein expression and purification methods were as described for unlabeled APTX variants above.
NMR assignments
Methionine Cε and Hε resonances were assigned by creating site directed M to L mutations of each methionine residue and comparing the 13C‐1H HSQC spectra of 13C methyl methionine‐labeled mutants with the wild‐type hAPTX spectra. Assignments of the backbone 1H, 13C, and15N resonance were achieved with standard techniques and are nearly identical to that reported by Bellstedt et al (2013), and are reported in the BMRB, accession 27287. Notably, the APTX constructs used here (aa 151–307) did not suffer the precipitation problems previously encountered (Bellstedt et al, 2013).
hAPTX AOA1 variants solubility assays
hAPTXcat WT and variants were grown in 3 ml LB medium containing ampicillin (100 μg/ml) and chloramphenicol (34 ng/ml) at 37°C. Cell cultures were induced with 100 μM IPTG when A 600 = 1. Protein expression was carried out at 16°C overnight. Cell density was normalized to A 600 = 1. Cell pellet from 1 ml cell culture was suspended and lysed in 200 μl (50 mM Tris, pH 8.0, 100 mM NaCl, 5 mM EDTA, 0.25 mg/ml lysozyme, 10 μg/ml DNaseI, 5 mM MgCl2) at 4° for 1 h. Cell lysate was fractionated by centrifugation (30,000 g, 10 min). Whole cell lysates (5 μl) and soluble fractions (5 μl) were boiled in 2× SDS sample buffer (5 μl) for 10 min, followed by centrifugation (30,000 g, 10 min). Western blotting for his‐tagged hAPTXcat WT and variant proteins in whole cell lysate and soluble fractions used HRP mouse anti‐His6 antibodies (1:5,000) (BD Pharmingen), followed by HRP‐conjugated rabbit anti‐mouse secondary antibodies (1:5,000). Membranes were treated by ECL detection kit (GE Healthcare) and then exposed to chemiluminescence film (GE Healthcare).
hAPTX deadenylation reactions
Reaction mixtures (10 μl) contained 5′‐AMPRNA‐DNA (Tumbale et al, 2014) (10 nM) and hAPTX (2 nM) in 50 mM Tris, pH 7.5, 40 mM NaCl, 5 mM EDTA, 1 mM DTT, and 5% glycerol. Reactions were incubated at 25 or 37°C for 10 min, followed by inactivation at 97°C in 8 M urea, 50 mM Tris, pH 7.5, 25 mM EDTA, and 5% glycerol (10 μl) for 10 min. Denatured DNA was analyzed on 15% TBE‐Urea gel (Invitrogen). Fluorescent‐labeled reaction products were detected with a Typhoon scanner and quantified using ImageQuant (GE Healthcare).
Limited proteolysis
Proteolysis reaction mixtures (60 μl) contained 22 μM full‐length hAPTX WT or K197Q, ligands (2 mM AMP), blunt RNA/DNA (oligos 2 and 3, Appendix Table S3, 200 μM), nicked DNA (oligo 1, Appendix Table S3, 200 μM), plasmid DNA (1 mg), adenosine (2 mM), or vanadate (2 mM), and 2 μg chymotrypsin in 20 mM Tris, pH 7.5, 450 mM NaCl, and 0.1% β‐mercaptoethanol. A 10 μl aliquot of the reaction mixture was removed at 5, 15, 30, and 60 min, immediately mixed with 1 μl 1 mg/ml PMSF, and heat inactivated in Novex SDS sample buffer (Invitrogen) at 95°C for 10 min. Proteolytic digestions were analyzed by SDS–PAGE, and protein was stained with Coomassie Blue.
Thermal shift assay
Reaction mixtures (20 μl) contained hAptx (200 μg/ml), AMP (1 mM) or DMSO (1% v/v), Sypro orange dye (1:2,500) (Invitrogen) in 10 mM Tris, pH 7.5, 150 mM NaCl. Fluorescent intensity was collected starting at 25°C up to 95°C (2°C increment/min) with a QPCR machine using excitation and emission wavelengths of 492 nm and 610 nm, respectively (Niesen et al, 2007). Delta T m for a ligand is calculated as average T m (for controls) minus the observed T m for the protein in the presence of a ligand.
hAptx‐nicked DNA complex crystallization and structure determination
Crystals of the hAPTX‐nicked‐RNA‐DNA–AMP–Zn2+ complex (oligos 4 and 5, Appendix Table S3) were grown by mixing 300 nL of complex solution (10 mg/ml hAptx (165–342), 1 mM AMP, 1.5:1 DNA:protein molar ratio, in 150 mM NaCl, 20 mM Tris–HCl, pH 7.5, and 0.1% β‐mercaptoethanol) with an equal volume of precipitant solution (100 mM MES, pH 6.5, 16% (w/v) polyethylene glycol 3350) at 4°C. X–ray diffraction data were collected on beamline 22‐ID of the Advanced Photon Source at a wavelength of 1,000 Å. X‐ray diffraction data were processed and scaled using the HKL2000 suite (Otwinowski & Minor, 1997). The hAPTX–nicked‐RNA‐DNA–AMP–Zn2+ complex structure was solved by molecular replacement using PDB entry 4NDG (Tumbale et al, 2014) as a search model with PHASER (McCoy et al, 2007) executed in the PHENIX software suite (Adams et al, 2011). Iterative rounds of model building in COOT (Emsley et al, 2010) and refinement with PHENIX were used to produce the final models that have excellent geometry (Appendix Table S2).
The crystallographic asymmetric unit contains one doubly nicked DNA substrate and two APTX protomers (Fig 1B and C). At the nick junctions, DNA base intercalation unwinds both of the 5′ and 3′ base pairs proximal to the nick site. These DNA bending and unwinding events are fundamentally different in the two bound complexes in the crystallographic asymmetric unit (Appendix Fig S1B). The local unwinding events at the nick junctions are also stabilized in the crystal by a series of microhomology‐mediated pairing events between the two non‐crystallographic related molecules. The position of the upstream region of the nick in each complex also differs. While the upstream regions are bound orthogonally relative to the downstream duplex (8 bp region), structural overlays shows the nick can be positioned in alternate binding modes related by an ~ 90° degree relative rotation to one another (Appendix Fig S1B).
Mutant hAPTX Crystallization and structure determination
Crystals of the hAPTX‐R199H/RNA‐DNA/AMP‐Zn2+ product complex (Oligos 2 and 3, Appendix Table S3) were grown by mixing 300 nl of complex solution (10 mg/ml hAPTX‐R199H (165–342), 1 mM AMP, 1.5:1 RNA/DNA:protein molar ratio, in 150 mM NaCl, 20 mM Tris–HCl, pH 7.5, and 0.1% β‐mercaptoethanol) with an equal volume of precipitant solution (100 mM MES, pH 6.5, 20% (w/v) polyethylene glycol 3350) at 4°C. Crystals of the hAPTX‐H201Q/RNA‐DNA/AMP‐Zn2+ product complex (Oligos 2 and 3, Appendix Table S3) were grown by mixing 300 nl of complex solution (9 mg/ml hAPTX‐H201Q (165–342), 1 mM AMP, 1.5:1 RNA/DNA:protein molar ratio, in 150 mM NaCl, 20 mM Tris–HCl, pH 7.5, and 0.1% β‐mercaptoethanol) with an equal volume of precipitant solution (100 mM sodium HEPES, pH 7.5, 25% (w/v) polyethylene glycol 3350) at 4°C. Crystals of the hAPTX‐S242N/RNA‐DNA/AMP‐Zn2+ product complex (Oligos 2 and 3, Appendix Table S3) were grown by mixing 300 nl of complex solution (10 mg/ml hAPTX‐S242N (165–342), 1 mM AMP, 1.5:1 RNA/DNA:protein molar ratio, in 150 mM NaCl, 20 mM Tris–HCl, pH 7.5, and 0.1% β‐mercaptoethanol) with an equal volume of precipitant solution (200 mM ammonium formate, 20% (w/v) polyethylene glycol 3350) at 4°C. Crystals of the hAPTX‐L248M/DNA/AMP‐Zn2+ product complex (Oligo 6, Appendix Table S3) were grown by mixing 300 nl of complex solution (10 mg/ml hAPTX‐L248M (165–342), 1 mM AMP, 1.5:1 DNA:protein ratio, in 150 mM NaCl, 20 mM Tris–HCl, pH 7.5, and 0.1% β‐mercaptoethanol) with an equal volume of precipitant solution (100 mM MES, pH 6.5, 25% (w/v) polyethylene glycol 4000) at 4°C. Crystals of the hAPTX‐V263G/RNA‐DNA/AMP‐Zn2+ product complex (Oligos 2 and 3, Appendix Table S3) were grown by mixing 300 nl of complex solution (5 mg/ml hAPTX‐V263G (165–342), 1 mM AMP, 1.5:1 RNA/DNA:protein molar ratio, in 150 mM NaCl, 20 mM Tris–HCl, pH 7.5, and 0.1% β‐mercaptoethanol) with an equal volume of precipitant solution (100 mM MES pH 6.5, 20% (w/v) polyethylene glycol 3350). Crystals were washed in cryo‐protectant (precipitant solution supplemented with 12% (v/v) glycerol) and flash frozen in liquid nitrogen for data collection.
Data availability
The NMR data from this publication have been deposited in the Biological Magnetic Resonance Data Bank (http://www.bmrb.wisc.edu/) and assigned the identifier 27287.
Structural coordinates from X‐ray crystallographic studies in this publication have been deposited in the RCSB protein data bank (https://www.rcsb.org/) and assigned the identifiers 6CVO, 6CVP, 6CVQ, 6CVR, 6CVS, and 6CVT (see Appendix Table S2).
Author contributions
Conceptualization RSW, PT, GAM, REL; methodology PT, GAM, JK, EF, MJS, JNL, MW, IW, REL RSW; investigation PT, MJS, GAM, EM, MW, JK, JNL, RSW; writing—original draft, RSW; writing—reviewing and editing, PT, MJS, GAM, JK, EF, JNL, MW, IW, REL, RSW; funding acquisition REL, IW, RSW; supervision REL, IW, RSW.
Conflict of interest
The authors declare that they have no conflict of interest.
Supporting information
Appendix
Dataset EV1
Movie EV1
Review Process File
Acknowledgements
Our studies are supported by the US National Institute of Health Intramural Program, US National Institute of Environmental Health Sciences (NIEHS), 1Z01ES102765 (to R.S.W.) and 1ZIA ES050111‐26 (to R.E.L.), and Cancer Research UK (C480/A11411 to I.W). We thank L. Pedersen of the NIEHS Collaborative crystallography group for data collection support and the Advanced Photon Source (APS) Southeast Regional Collaborative Access Team (SER‐CAT) for beamline access. Use of the APS was supported by the U. S. Department of Energy, Office of Science, Office of Basic Energy Sciences, under Contract No. W‐31‐109‐Eng‐38. We thank Dr. Bill Copeland and Dr. Monica Pillon for comments on the manuscript.
The EMBO Journal (2018) 37: e98875
References
- Adams PD, Afonine PV, Bunkoczi G, Chen VB, Echols N, Headd JJ, Hung LW, Jain S, Kapral GJ, Grosse Kunstleve RW, McCoy AJ, Moriarty NW, Oeffner RD, Read RJ, Richardson DC, Richardson JS, Terwilliger TC, Zwart PH (2011) The Phenix software for automated determination of macromolecular structures. Methods 55: 94–106 [DOI] [PMC free article] [PubMed] [Google Scholar]
- Ahel I, Rass U, El‐Khamisy SF, Katyal S, Clements PM, McKinnon PJ, Caldecott KW, West SC (2006) The neurodegenerative disease protein aprataxin resolves abortive DNA ligation intermediates. Nature 443: 713–716 [DOI] [PubMed] [Google Scholar]
- Akbari M, Sykora P, Bohr VA (2015) Slow mitochondrial repair of 5′‐AMP renders mtDNA susceptible to damage in APTX deficient cells. Sci Rep 5: 12876 [DOI] [PMC free article] [PubMed] [Google Scholar]
- Andres SN, Schellenberg MJ, Wallace BD, Tumbale P, Williams RS (2015) Recognition and repair of chemically heterogeneous structures at DNA ends. Environ Mol Mutagen 56: 1–21 [DOI] [PMC free article] [PubMed] [Google Scholar]
- Baba Y, Uitti RJ, Boylan KB, Uehara Y, Yamada T, Farrer MJ, Couchon E, Batish SD, Wszolek ZK (2007) Aprataxin (APTX) gene mutations resembling multiple system atrophy. Parkinsonism Relat Disord 13: 139–142 [DOI] [PubMed] [Google Scholar]
- Barbot C, Coutinho P, Chorao R, Ferreira C, Barros J, Fineza I, Dias K, Monteiro J, Guimaraes A, Mendonca P, do Ceu Moreira M, Sequeiros J (2001) Recessive ataxia with ocular apraxia: review of 22 Portuguese patients. Arch Neurol 58: 201–205 [DOI] [PubMed] [Google Scholar]
- Bellstedt P, Seiboth T, Hafner S, Kutscha H, Ramachandran R, Gorlach M (2013) Resonance assignment for a particularly challenging protein based on systematic unlabeling of amino acids to complement incomplete NMR data sets. J Biomol NMR 57: 65–72 [DOI] [PubMed] [Google Scholar]
- Bernstein NK, Williams RS, Rakovszky ML, Cui D, Green R, Karimi‐Busheri F, Mani RS, Galicia S, Koch CA, Cass CE, Durocher D, Weinfeld M, Glover JN (2005) The molecular architecture of the mammalian DNA repair enzyme, polynucleotide kinase. Mol Cell 17: 657–670 [DOI] [PubMed] [Google Scholar]
- Breslin C, Caldecott KW (2009) DNA 3′‐phosphatase activity is critical for rapid global rates of single‐strand break repair following oxidative stress. Mol Cell Biol 29: 4653–4662 [DOI] [PMC free article] [PubMed] [Google Scholar]
- Butterfoss GL, DeRose EF, Gabel SA, Perera L, Krahn JM, Mueller GA, Zheng X, London RE (2010) Conformational dependence of 13C shielding and coupling constants for methionine methyl groups. J Biomol NMR 48: 31–47 [DOI] [PMC free article] [PubMed] [Google Scholar]
- Caglayan M, Wilson SH (2017) In vitro assay to measure DNA polymerase beta nucleotide insertion coupled with the DNA ligation reaction during base excision repair. Bio Protoc 7: e2341 [DOI] [PMC free article] [PubMed] [Google Scholar]
- Carroll J, Page TK, Chiang SC, Kalmar B, Bode D, Greensmith L, McKinnon PJ, Thorpe JR, Hafezparast M, El‐Khamisy SF (2015) Expression of a pathogenic mutation of SOD1 sensitizes aprataxin‐deficient cells and mice to oxidative stress and triggers hallmarks of premature ageing. Hum Mol Genet 24: 828–840 [DOI] [PMC free article] [PubMed] [Google Scholar]
- Castellotti B, Mariotti C, Rimoldi M, Fancellu R, Plumari M, Caimi S, Uziel G, Nardocci N, Moroni I, Zorzi G, Pareyson D, Di Bella D, Di Donato S, Taroni F, Gellera C (2011) Ataxia with oculomotor apraxia type1 (AOA1): novel and recurrent aprataxin mutations, coenzyme Q10 analyses, and clinical findings in Italian patients. Neurogenetics 12: 193–201 [DOI] [PubMed] [Google Scholar]
- Chauleau M, Jacewicz A, Shuman S (2015) DNA3′pp5′G de‐capping activity of aprataxin: effect of cap nucleoside analogs and structural basis for guanosine recognition. Nucleic Acids Res 43: 6075–6083 [DOI] [PMC free article] [PubMed] [Google Scholar]
- Cherry AL, Nott TJ, Kelly G, Rulten SL, Caldecott KW, Smerdon SJ (2015) Versatility in phospho‐dependent molecular recognition of the XRCC1 and XRCC4 DNA‐damage scaffolds by aprataxin‐family FHA domains. DNA Repair 35: 116–125 [DOI] [PMC free article] [PubMed] [Google Scholar]
- Criscuolo C, Mancini P, Sacca F, De Michele G, Monticelli A, Santoro L, Scarano V, Banfi S, Filla A (2004) Ataxia with oculomotor apraxia type 1 in Southern Italy: late onset and variable phenotype. Neurology 63: 2173–2175 [DOI] [PubMed] [Google Scholar]
- Criscuolo C, Mancini P, Menchise V, Sacca F, De Michele G, Banfi S, Filla A (2005) Very late onset in ataxia oculomotor apraxia type I. Ann Neurol 57: 777 [DOI] [PubMed] [Google Scholar]
- Daley JM, Wilson TE, Ramotar D (2010) Genetic interactions between HNT3/Aprataxin and RAD27/FEN1 suggest parallel pathways for 5′ end processing during base excision repair. DNA Repair 9: 690–699 [DOI] [PMC free article] [PubMed] [Google Scholar]
- Date H, Onodera O, Tanaka H, Iwabuchi K, Uekawa K, Igarashi S, Koike R, Hiroi T, Yuasa T, Awaya Y, Sakai T, Takahashi T, Nagatomo H, Sekijima Y, Kawachi I, Takiyama Y, Nishizawa M, Fukuhara N, Saito K, Sugano S et al (2001) Early‐onset ataxia with ocular motor apraxia and hypoalbuminemia is caused by mutations in a new HIT superfamily gene. Nat Genet 29: 184–188 [DOI] [PubMed] [Google Scholar]
- Deshpande GP, Hayles J, Hoe KL, Kim DU, Park HO, Hartsuiker E (2009) Screening a genome‐wide S. pombe deletion library identifies novel genes and pathways involved in genome stability maintenance. DNA Repair 8: 672–679 [DOI] [PMC free article] [PubMed] [Google Scholar]
- Eilers M, Patel AB, Liu W, Smith SO (2002) Comparison of helix interactions in membrane and soluble alpha‐bundle proteins. Biophys J 82: 2720–2736 [DOI] [PMC free article] [PubMed] [Google Scholar]
- El‐Khamisy SF, Katyal S, Patel P, Ju L, McKinnon PJ, Caldecott KW (2009) Synergistic decrease of DNA single‐strand break repair rates in mouse neural cells lacking both Tdp1 and aprataxin. DNA Repair 8: 760–766 [DOI] [PMC free article] [PubMed] [Google Scholar]
- Emsley P, Lohkamp B, Scott WG, Cowtan K (2010) Features and development of coot. Acta Crystallogr D Biol Crystallogr 66: 486–501 [DOI] [PMC free article] [PubMed] [Google Scholar]
- Gueven N, Becherel OJ, Kijas AW, Chen P, Howe O, Rudolph JH, Gatti R, Date H, Onodera O, Taucher‐Scholz G, Lavin MF (2004) Aprataxin, a novel protein that protects against genotoxic stress. Hum Mol Genet 13: 1081–1093 [DOI] [PubMed] [Google Scholar]
- Harris JL, Jakob B, Taucher‐Scholz G, Dianov GL, Becherel OJ, Lavin MF (2009) Aprataxin, poly‐ADP ribose polymerase 1 (PARP‐1) and apurinic endonuclease 1 (APE1) function together to protect the genome against oxidative damage. Hum Mol Genet 18: 4102–4117 [DOI] [PubMed] [Google Scholar]
- Hirano M, Yamamoto A, Mori T, Lan L, Iwamoto TA, Aoki M, Shimada K, Furiya Y, Kariya S, Asai H, Yasui A, Nishiwaki T, Imoto K, Kobayashi N, Kiriyama T, Nagata T, Konishi N, Itoyama Y, Ueno S (2007) DNA single‐strand break repair is impaired in aprataxin‐related ataxia. Ann Neurol 61: 162–174 [DOI] [PubMed] [Google Scholar]
- Huynh K, Partch CL (2015) Analysis of protein stability and ligand interactions by thermal shift assay. Curr Protoc Protein Sci 79: 28 9 1–28 9 14 [DOI] [PMC free article] [PubMed] [Google Scholar]
- Ito A, Yamagata T, Mori M, Momoi MY (2005) Early‐onset ataxia with oculomotor apraxia with a novel APTX mutation. Pediatr Neurol 33: 53–56 [DOI] [PubMed] [Google Scholar]
- Le Ber I, Moreira MC, Rivaud‐Pechoux S, Chamayou C, Ochsner F, Kuntzer T, Tardieu M, Said G, Habert MO, Demarquay G, Tannier C, Beis JM, Brice A, Koenig M, Durr A (2003) Cerebellar ataxia with oculomotor apraxia type 1: clinical and genetic studies. Brain 126: 2761–2772 [DOI] [PubMed] [Google Scholar]
- Liu W, Crocker E, Zhang W, Elliott JI, Luy B, Li H, Aimoto S, Smith SO (2005) Structural role of glycine in amyloid fibrils formed from transmembrane alpha‐helices. Biochemistry 44: 3591–3597 [DOI] [PubMed] [Google Scholar]
- Malkov SN, Zivkovic MV, Beljanski MV, Hall MB, Zaric SD (2008) A reexamination of the propensities of amino acids towards a particular secondary structure: classification of amino acids based on their chemical structure. J Mol Model 14: 769–775 [DOI] [PubMed] [Google Scholar]
- McCoy AJ, Grosse‐Kunstleve RW, Adams PD, Winn MD, Storoni LC, Read RJ (2007) Phaser crystallographic software. J Appl Crystallogr 40: 658–674 [DOI] [PMC free article] [PubMed] [Google Scholar]
- Moreira MC, Barbot C, Tachi N, Kozuka N, Uchida E, Gibson T, Mendonca P, Costa M, Barros J, Yanagisawa T, Watanabe M, Ikeda Y, Aoki M, Nagata T, Coutinho P, Sequeiros J, Koenig M (2001) The gene mutated in ataxia‐ocular apraxia 1 encodes the new HIT/Zn‐finger protein aprataxin. Nat Genet 29: 189–193 [DOI] [PubMed] [Google Scholar]
- Mosesso P, Piane M, Palitti F, Pepe G, Penna S, Chessa L (2005) The novel human gene aprataxin is directly involved in DNA single‐strand‐break repair. Cell Mol Life Sci 62: 485–491 [DOI] [PMC free article] [PubMed] [Google Scholar]
- Mueller GA, Kirby TW, DeRose EF, Li D, Schaaper RM, London RE (2005) Nuclear magnetic resonance solution structure of the Escherichia coli DNA polymerase III theta subunit. J Bacteriol 187: 7081–7089 [DOI] [PMC free article] [PubMed] [Google Scholar]
- Niesen FH, Berglund H, Vedadi M (2007) The use of differential scanning fluorimetry to detect ligand interactions that promote protein stability. Nat Protoc 2: 2212–2221 [DOI] [PubMed] [Google Scholar]
- Otwinowski Z, Minor W (1997) Processing of X‐ray diffraction data collected in oscillation mode In Methods in enzymology, Carter CW, Jr, Sweets RM. (eds), pp 307–326. New York: Academic Press; [DOI] [PubMed] [Google Scholar]
- Parsons JL, Dianova II, Dianov GL (2005) APE1‐dependent repair of DNA single‐strand breaks containing 3′‐end 8‐oxoguanine. Nucleic Acids Res 33: 2204–2209 [DOI] [PMC free article] [PubMed] [Google Scholar]
- Pascal JM, O'Brien PJ, Tomkinson AE, Ellenberger T (2004) Human DNA ligase I completely encircles and partially unwinds nicked DNA. Nature 432: 473–478 [DOI] [PubMed] [Google Scholar]
- Quinzii CM, Kattah AG, Naini A, Akman HO, Mootha VK, DiMauro S, Hirano M (2005) Coenzyme Q deficiency and cerebellar ataxia associated with an aprataxin mutation. Neurology 64: 539–541 [DOI] [PubMed] [Google Scholar]
- Rass U, Ahel I, West SC (2007) Actions of aprataxin in multiple DNA repair pathways. J Biol Chem 282: 9469–9474 [DOI] [PubMed] [Google Scholar]
- Reynolds JJ, El‐Khamisy SF, Katyal S, Clements P, McKinnon PJ, Caldecott KW (2009) Defective DNA ligation during short‐patch single‐strand break repair in ataxia oculomotor apraxia 1. Mol Cell Biol 29: 1354–1362 [DOI] [PMC free article] [PubMed] [Google Scholar]
- Schellenberg MJ, Tumbale PP, Williams RS (2015) Molecular underpinnings of Aprataxin RNA/DNA deadenylase function and dysfunction in neurological disease. Prog Biophys Mol Biol 117: 157–165 [DOI] [PMC free article] [PubMed] [Google Scholar]
- Seidle HF, Bieganowski P, Brenner C (2005) Disease‐associated mutations inactivate AMP‐lysine hydrolase activity of Aprataxin. J Biol Chem 280: 20927–20931 [DOI] [PMC free article] [PubMed] [Google Scholar]
- Shimazaki H, Takiyama Y, Sakoe K, Ikeguchi K, Niijima K, Kaneko J, Namekawa M, Ogawa T, Date H, Tsuji S, Nakano I, Nishizawa M (2002) Early‐onset ataxia with ocular motor apraxia and hypoalbuminemia: the aprataxin gene mutations. Neurology 59: 590–595 [DOI] [PubMed] [Google Scholar]
- Sykora P, Croteau DL, Bohr VA, Wilson DM III (2011) Aprataxin localizes to mitochondria and preserves mitochondrial function. Proc Natl Acad Sci USA 108: 7437–7442 [DOI] [PMC free article] [PubMed] [Google Scholar]
- Tomkinson AE, Vijayakumar S, Pascal JM, Ellenberger T (2006) DNA ligases: structure, reaction mechanism, and function. Chem Rev 106: 687–699 [DOI] [PubMed] [Google Scholar]
- Tranchant C, Fleury M, Moreira MC, Koenig M, Warter JM (2003) Phenotypic variability of aprataxin gene mutations. Neurology 60: 868–870 [DOI] [PubMed] [Google Scholar]
- Tsutakawa SE, Classen S, Chapados BR, Arvai AS, Finger LD, Guenther G, Tomlinson CG, Thompson P, Sarker AH, Shen B, Cooper PK, Grasby JA, Tainer JA (2011) Human flap endonuclease structures, DNA double‐base flipping, and a unified understanding of the FEN1 superfamily. Cell 145: 198–211 [DOI] [PMC free article] [PubMed] [Google Scholar]
- Tumbale P, Appel CD, Kraehenbuehl R, Robertson PD, Williams JS, Krahn J, Ahel I, Williams RS (2011) Structure of an aprataxin‐DNA complex with insights into AOA1 neurodegenerative disease. Nat Struct Mol Biol 18: 1189–1195 [DOI] [PMC free article] [PubMed] [Google Scholar]
- Tumbale P, Williams JS, Schellenberg MJ, Kunkel TA, Williams RS (2014) Aprataxin resolves adenylated RNA‐DNA junctions to maintain genome integrity. Nature 506: 111–115 [DOI] [PMC free article] [PubMed] [Google Scholar]
- Uson ML, Ghosh S, Shuman S (2017) The DNA repair repertoire of Mycobacterium smegmatis FenA includes the incision of DNA 5′ flaps and the removal of 5′ adenylylated products of aborted nick ligation. J Bacteriol 199: e00304‐17 [DOI] [PMC free article] [PubMed] [Google Scholar]
- Wang X, Li Q, Jin H, Zou H, Xia W, Dai N, Dai XY, Wang D, Xu CX, Qing Y (2016) miR‐424 acts as a tumor radiosensitizer by targeting aprataxin in cervical cancer. Oncotarget 7: 77508–77515 [DOI] [PMC free article] [PubMed] [Google Scholar]
- Williams RS, Chasman DI, Hau DD, Hui B, Lau AY, Glover JN (2003) Detection of protein folding defects caused by BRCA1‐BRCT truncation and missense mutations. J Biol Chem 278: 53007–53016 [DOI] [PubMed] [Google Scholar]
- Williams RS, Lee MS, Hau DD, Glover JN (2004) Structural basis of phosphopeptide recognition by the BRCT domain of BRCA1. Nat Struct Mol Biol 11: 519–525 [DOI] [PubMed] [Google Scholar]
- Yokoseki A, Ishihara T, Koyama A, Shiga A, Yamada M, Suzuki C, Sekijima Y, Maruta K, Tsuchiya M, Date H, Sato T, Tada M, Ikeuchi T, Tsuji S, Nishizawa M, Onodera O (2011) Genotype‐phenotype correlations in early onset ataxia with ocular motor apraxia and hypoalbuminaemia. Brain 134: 1387–1399 [DOI] [PubMed] [Google Scholar]
Associated Data
This section collects any data citations, data availability statements, or supplementary materials included in this article.
Supplementary Materials
Appendix
Dataset EV1
Movie EV1
Review Process File
Data Availability Statement
The NMR data from this publication have been deposited in the Biological Magnetic Resonance Data Bank (http://www.bmrb.wisc.edu/) and assigned the identifier 27287.
Structural coordinates from X‐ray crystallographic studies in this publication have been deposited in the RCSB protein data bank (https://www.rcsb.org/) and assigned the identifiers 6CVO, 6CVP, 6CVQ, 6CVR, 6CVS, and 6CVT (see Appendix Table S2).