

Abstract
Prolonged exposure to microbial products, e.g. lipopolysaccharide (LPS), can induce a form of innate immune memory that blunts subsequent responses to unrelated pathogens (“LPS tolerance”). Sepsis, which continues to have a high mortality rate, is a dysregulated, systemic immune response to disseminated infection. In some patients, this results in a period of immunosuppression (“immunoparalysis”)1 with reduced inflammatory cytokine output2, increased secondary infection3, and increased risk of organ failure and mortality4. LPS tolerance recapitulates several key features of sepsis-associated immunosuppression5. Although various epigenetic changes have been observed in tolerized macrophages6–8, the molecular basis for tolerance, immunoparalysis, and other forms of innate immune memory has remained unclear. Here, we performed a screen for tolerance-associated microRNAs (miRNAs) and identified miR-221/222 as regulators of the functional reprogramming of macrophages during LPS tolerization. Prolonged stimulation with LPS in mice leads to Increased expression of miR-221/222, which regulates brahma-related gene 1 (Brg1) causing transcriptional silencing of a subset of inflammatory genes that depend on SWI/SNF- (SWItch/Sucrose Non-Fermentable) and STAT- (signal transducer and activator of transcription) mediated chromatin remodeling, and promotes tolerance. In sepsis patients, increased miR-221/222 expression correlates with immunoparalysis and increased organ damage. Hence our results show that specific microRNAs can regulate macrophage tolerization and may serve as biomarkers of immunoparalysis and poor prognosis in sepsis patients.
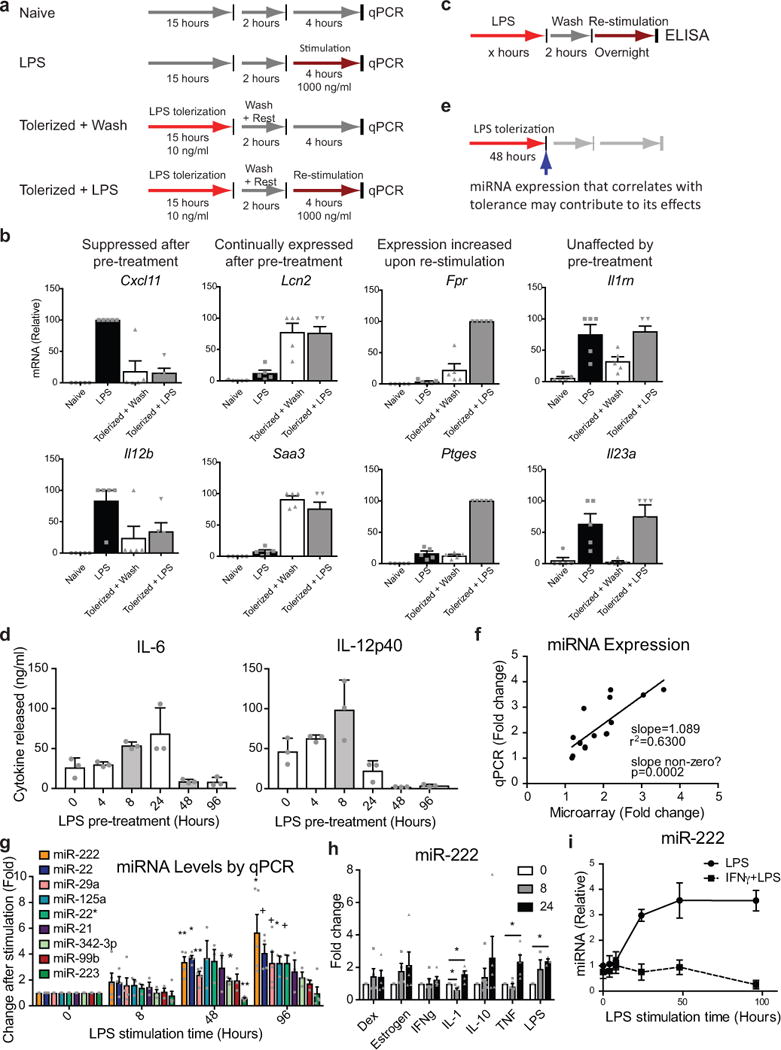
LPS tolerance is an immunosuppressive form of innate immune memory that can be modeled in vitro by prolonged treatment of bone-marrow derived macrophages (BMDMs) with LPS (Extended Data Fig. 1a). As a result of this functional reprogramming of macrophages a majority of LPS-induced genes are transcriptionally silenced, i.e. tolerized, and fail to be expressed upon re-stimulation7,9 (Extended Data Fig. 1b). Using this in vitro model (Extended Data Fig. 1c–e) we identified miRNAs with expression patterns correlating with tolerance (Fig. 1a). We validated these findings using qPCR (Extended Data Fig. 1f–g) and found that several miRNAs are differentially expressed during tolerance but not during an acute LPS response. Levels of miR-222, in particular, increased late during the LPS response (Extended Data Fig. 1g), and correlated with tolerance induction (Fig. 1b). miR-222 was also upregulated to a lesser extent with prolonged tumor necrosis factor (TNF) or interleukin-1β (IL-1β stimulation (Extended Data Fig. 1h), which have been shown to weakly induce innate immune tolerance10,11. Pre-treatment of BMDMs with interferon gamma (IFNγ), which inhibits LPS tolerance8, prevented LPS-induced upregulation of miR-222 (Extended Data Fig. 1i). Although miR-221 is processed from the same primary transcript as miR-22212, mature levels of miR-221 and of miR-222 do not always correlate (Extended Data Fig. 2a–c). Given that miR-221 is not responsive to LPS (Extended Data Fig. 2a) or IFNγ (Extended Data Fig. 2d) in BMDMs, we focused on miR-222 in BMDM experiments.
Figure 1. miR-222 is upregulated in tolerized BMDMs and suppresses inflammatory gene expression.

a, miRNA expression in BMDMs from 2 mice (A or B) by microarray. b, Overlay of qPCR measurement of miR-222 levels in naïve BMDMs (right axis, n=4 biologically independent samples) and cytokine release after re-stimulation of BMDMs as in Extended Data Fig. 2a (left axis, n=3 biologically independent samples) to correlate miR-222 expression kinetics with immunosuppression. c, LPS-induced cytokine production after mimic transfection (n=5 biologically independent samples). d-f, BMDMs (d, f) or immortalized BMDMs (iBMDMs, e) were transduced with antagonist constructs. d, Cytokine production after stimulation of naïve cells (n=4 biologically independent samples). e, Re-stimulation of cells with fixed LPS doses after varying pre-treatment time (n=3 independent experiments). f, Re-stimulation of cells with varying LPS doses after fixed pre-treatment time (n=6 biologically independent samples). For all graphs, center value represents mean and error bars the SEM. p-values calculated by Student’s t-test (paired, 2-sided).
BMDMs were transfected with a miR-222 mimic and stimulated with LPS to determine if miR-222 induced reprogramming independently of other tolerogenic factors (Extended Data Fig. 2e). Overexpression of miR-222 inhibited expression of several inflammatory mediators at the protein (Fig. 1c), mRNA (Extended Data Fig. 2f), and primary transcript level (Extended Data Fig. 2g). Conversely, antagonization of miR-222 resulted in increased inflammatory gene expression, even during a naïve LPS response. This effect was relatively mild early after stimulation (data not shown), likely due to low basal miR-222 expression, but increased in magnitude at later time points (Fig. 1d). To test the effect of miR-222 on tolerance, BMDMs were transduced with a miR-222 antagonist and tolerized in vitro. Antagonization of miR-222 reduced the duration and magnitude of suppression of LPS-response genes (Fig. 1e). In some cases, tolerized cells with antagonized miR-222 produced as much IL-6 or IL-12p40 in response to LPS as non-tolerized cells (Fig. 1f).
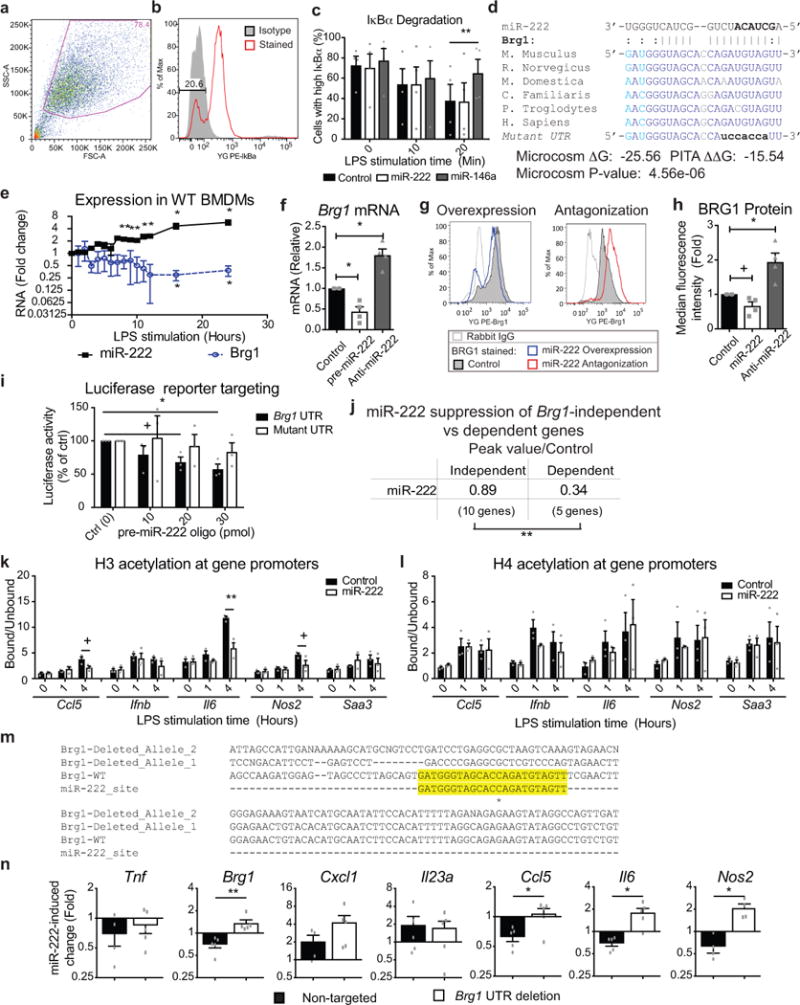
In contrast to other genes, Tnf was suppressed at the mRNA, but not primary transcript level (Extended Data Fig. 2f–g), suggesting miR-222 regulates Tnf through a mechanism distinct from other tolerized genes. Indeed, the Tnf UTR has a predicted binding site for miR-222 (Extended Data Fig. 3a). Luciferase reporter assays (Extended Data Fig. 3b) and CRISPR deletions of the predicted binding site (Extended Data Fig. 3c–g) confirmed that Tnf is a miR-222 target. However, post-transcriptional effects of miR-222 on TNF expression do not contribute to the effects of miR-222 on other genes, as TNF neutralization did not recapitulate the effects of miR-222 overexpression (Extended Data Fig. 3h–i).
Intact Tnf transcription suggested miR-222 does not alter TLR4 signaling. Indeed, miR-222 overexpression did not affect LPS-induced IκBα degradation (Extended Data Fig. 4a–c). We therefore filtered computational predictions for miR-222 targets that were expressed in macrophages, did not affect Toll-like receptor 4 (TLR4) signaling, and decreased in expression late in the LPS response (between 8-24 hours of LPS stimulation; Extended Data Table 1). This approach identified Brg1 (Smarca4) as the most likely target affected by miR-222 during LPS tolerance. BRG1, a catalytic subunit of the SWI/SNF (BAF) complex, evicts Polycomb repressive complexes in an ATP-dependent manner, promoting chromatin accessibility and allowing for transcription factor recruitment to specific binding sites13. Notably, BRG1 is recruited to the promoters of late LPS response genes, which require SWI/SNF activity for their transcription14.
The predicted miR-222:Brg1 binding site is evolutionarily conserved (Extended Data Fig. 4d), and RNA levels of Brg1 and miR-222 during the LPS response were inversely correlated (Extended Data Fig. 4e). Artificial modulation of miR-222 caused an inverse effect on Brg1 mRNA and protein levels (Extended Data Fig. 4f–h). To confirm that this was due to direct targeting, the Brg1 UTR was cloned into a luciferase reporter. miR-222 dose-dependently suppressed luciferase activity resulting from co-transfection, but only if the miR-222 binding site in the Brg1 UTR was intact (Extended Data Fig. 4i). The effect of miR-222 overexpression on genes previously identified as being SWI/SNF-dependent in macrophages15 was compared. Overexpression of miR-222 preferentially suppressed expression of SWI/SNF-dependent genes (Fig. 2a and Extended Data Fig. 4j). Furthermore, BRG1 recruitment to inflammatory gene promoters was reduced after miR-222 overexpression (Fig. 2b). Histone H3 acetylation, which occurs downstream14 of BRG1 activity, was also reduced (Extended Data Fig. 4k). In contrast, histone H4 acetylation at these promoters, which occurs prior to BRG1 recruitment16,17, was unaffected (Extended Data Fig. 4l). Finally, CRISPR-Cas9 disruption of the miR-222 binding site in the Brg1 UTR in RAW cells (Extended Data Fig. 4m) prevented miR-222-mediated suppression of some SWI/SNF-dependent genes (Extended Data Fig. 4n).
Figure 2. miR-222 suppresses BRG1- and STAT-dependent inflammatory gene expression.
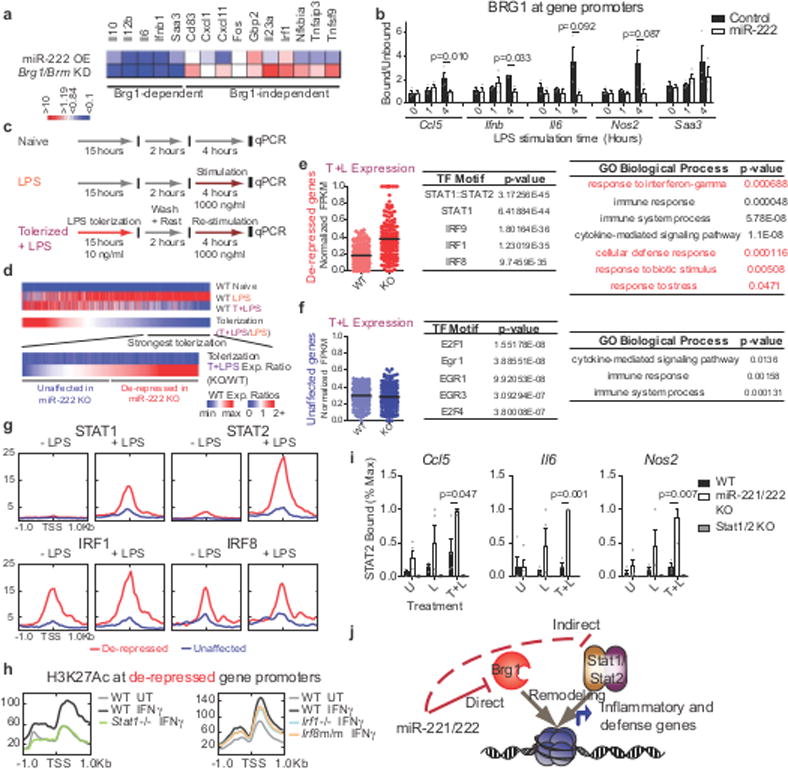
a, Comparison of miR-222 mimic transfection and Brg1/Brm knockdown15 effect on LPS-induced gene expression. b, ChIP in iBMDMs transduced with overexpression constructs (n=3 independent experiments; p-values from Students t-test for paired values, 2-sided). c-d, Schematic of treatments (c) and genes (d) analyzed in (e-i). e-f, Dotplot of RNA-seq expression values (normalized to maximal expression per gene), top 5 predicted41 transcription factor motifs, and statistically over-represented gene ontology terms (determined by PANTHER) for indicated gene groups (n=103 gene expression values/group). g-h, Transcription factor occupancy (g) and histone modification (h) at promoters, quantified from published ChIP-seq datasets. i, ChIP for STAT2 occupancy in peritoneal macrophages. Values normalized to maximal binding detected for each ChIP (WT, miR-221/222 KO n=4 biologically independent samples; Stat1/2 KO n=2 biologically independent samples. p-values only calculated for WT vs. miR-221/222 KO comparisons by Students t-test, 2-sided, heteroscedastic). j, Model of miR-221/222 effect on chromatin at affected gene promoters. For all bar graphs and dot plots, center represents mean and error bars (if present) the SEM.
To characterize the biological role of miR-222, we generated an animal knockout model. However, miR-221 and miR-222 are encoded in the same transcript; are induced by LPS in certain cell types (Extended Data Fig. 2b–c); have similar seed sequences (Extended Data Fig. 5a); have substantial overlap in predicted mRNA targets (Extended Data Fig 5b); and are both predicted to bind to the same target site in the Brg1 UTR (Extended Data Fig. 5c). Furthermore, like miR-222, overexpression of miR-221 downregulates Brg1 levels (Extended Data Fig. 5d) and has downstream effects on inflammatory gene expression (Extended Data Fig. 5e). Therefore, we targeted both miRNAs for deletion18 (Extended Data Fig. 5f–h). We then used qPCR and RNA-sequencing to characterize the LPS response in miR-221/222 knockout macrophages (Fig. 2c). Although the increase in Brg1 expression in peritoneal macrophages from knockout mice was modest compared to in vitro experiments, miR-221/222 knockout cells expressed higher levels of many Brg1-dependent genes, as well as Tnf (Extended Data Fig. 5i–j). Interestingly, some Brg1-dependent genes were more affected by miR-221/222 knockout than others (for instance, comparing Il6 and Nos2 in Extended Data Fig. 5j), suggesting differential sensitivity to changes in BRG1 levels.
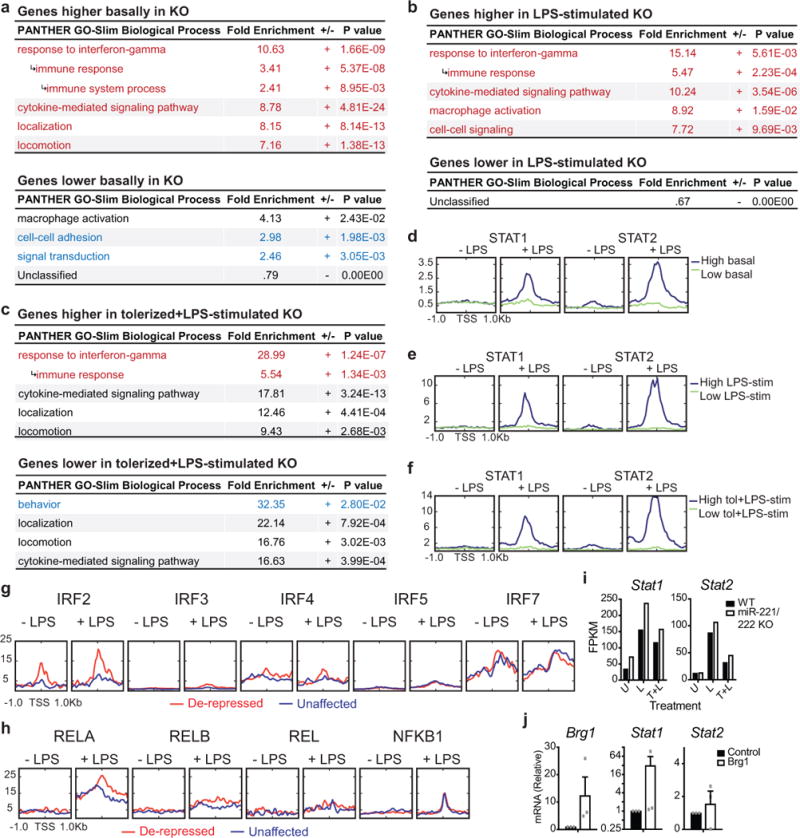
To better understand the mechanisms of altered gene expression in cells lacking miR-221/222 (Extended Data Fig. 5k), we analyzed the promoters of affected genes to identify common regulatory features. Although we obtained similar results in multiple analyses of affected gene subsets (Extended Data Fig. 6a–f), we limited our main analysis to those LPS genes that are most suppressed in tolerized wildtype cells (358 genes/1036 genes responsive to LPS; Fig. 2d). Roughly half of these genes were expressed at higher levels in tolerized knockout cells compared to tolerized wildtype cells (“de-repressed” genes, Fig. 2e), and roughly half were unaffected (“unaffected” genes, Fig. 2f). The promoters of de-repressed genes were enriched for IRF and STAT1/STAT2 binding motifs (Fig. 2e), whereas those of unaffected genes were enriched for E2F and EGR family motifs (Fig. 2f). An analysis of predicted downstream functions of the de-repressed genes subset found an enrichment for IFN-response genes (Fig. 2e), and LPS-induced expression of many of these genes is reduced in Ifnar knockout cells19. This implies that many of these genes are a part of the late LPS response, transcribed as a result of STAT activation by autocrine/paracrine signaling by IFN generated from the initial LPS stimulation.
To determine whether the predicted binding motifs were utilized during the LPS response, we analyzed transcription factor occupancy using published ChIP-seq data20–23. Interferon regulatory factor 1 (IRF1) and IRF8 were found to be selectively pre-associated with de-repressed gene promoters (Fig. 2g and Extended Data Fig. 6g). However, STAT1 and STAT2 were recruited specifically to the promoters of de-repressed genes only after LPS stimulation (Fig. 2g). Other transcription factors, such as NF-κB, were not differentially recruited (Extended Data Fig. 6h). Furthermore, in cells with deletion or mutation of Irf1 or Irf8, respectively24, cytokine-induced H3K27 (histone H3, lysine 27) acetylation, a marker of active transcription, was diminished at the promoters of de-repressed genes, whereas deletion of Stat125 almost completely abolished cytokine-induced H3K27 acetylation at these genes (Fig. 2h). Consistent with this analysis, STAT2 recruitment was significantly higher at the promoters of de-repressed genes in tolerized miR-221/222 knockout cells after restimulation (Fig. 2i). Furthermore, Stat1 mRNA levels are higher in miR-221/222 knockout cells and in cells in which Brg1 is overexpressed (Extended Data Fig. 7i-j). Therefore, miR-221/222 perturbs SWI/SNF promoter recruitment, leading to repression of STAT activity at inflammatory gene promoters. As BRG1 and STAT transcription factors work cooperatively only at certain gene promoters to allow IFN- and cytokine-induced gene transcription26,27, miR-221/222 may limit expression of specific genes (Fig. 2i).
We next examined miR-221/222 activity utilizing a model of sterile inflammatory shock induced by high-dose LPS injection. In this system, changes that decrease inflammation increase survival: therefore, we used this model mainly to determine whether the anti-inflammatory effects of miR-221/222 we observe in vitro also occur in vivo. After LPS injection, levels of miR-221 and miR-222 in circulating immune cells were elevated (Fig. 3a). To determine whether this is physiologically relevant, LPS tolerance was induced in wildtype and miR-221/222 knockout littermates by administering two sublethal doses of LPS prior to a lethal LPS dose: this regimen induces sufficient tolerance to prevent lethality in wildtype mice (Extended Data Fig. 7a–b). Although miR-221/222 knockout mice were also protected from lethality, the miR-221/222 knockout mice exhibited more symptoms of septic shock (Extended Data Fig. 7c), indicating decreased anti-inflammatory effects in the knockouts. To test whether miR-221/222 contributes to survival under more extreme conditions, we utilized a model of septic shock in which tolerance is only partially protective against lethality (Extended Data Fig. 7d–e). In this model, absence of miR-221/222 decreased median time (from 36.5 to 20.5 hours) and likelihood of septic shock survival over a 72-hour period (Fig. 3b).
Figure 3. miR-221/222 protect against inflammatory septic shock but increase susceptibility to live infection in mice.

a, miRNA levels in blood buffy coat 24 hours after LPS injection (n=7 animals for dose 0; 7 animals for dose 8; and 9 animals for dose 12 mg/kg). b, Survival of littermates that were untreated or tolerized prior to lethal LPS injection, as in Extended Data Fig. 1c. c-d, Bacterial dissemination (c, n=6 WT and 8 KO animals) and host survival (d) after intraperitoneal injection with S. Typhimurium. e, Model of miR-221/222 effect on the immune response and host survival during the course of sepsis. For (a, c), p-values determined by Student’s t-test (paired, 2-sided). p-values for (b, d): log-rank (Mantel-Cox) test (only performed when n>3). For all dot plots, center line represents mean; error bars represent SEM.
Although LPS-induced septic shock is used to study acute inflammation in vivo, this model does not recapitulate sepsis in patients, or necessarily predict the effect of inflammatory regulators on patient outcome. Therefore, to study the role of miR-221/222 in a model that better reflects the systemic innate response to pathogen challenge, we utilized a Salmonella enterica Typhimurium (S. Typhimurium) infection model. First, we performed in vitro assays using green fluorescent protein (GFP)-expressing S. Typhimurium infection of BMDMs. BMDMs from miR-221/222 knockout mice exhibited increased GFP per cell early after infection (Extended Data Fig. 7f–h). At later time points, this difference was not observed (Extended Data Fig. 7h), suggesting that despite increased phagocytosis, miR-221/222 knockout cells are more efficient at suppressing intracellular replication and/or survival. We confirmed this finding by lysing BMDMs and comparing bacterial colony-forming unit (CFU) recovery at early and late time points after infection (Extended Data Fig. 7i). To test miR-221/222 effects in vivo, wildtype and knockout mice were injected intraperitoneally with the same strain of S. Typhimurium. 2 days post-infection, fewer bacterial CFUs were recovered from the liver and spleen of miR-221/222 knockout animals (Fig. 3c). In addition, miR-221/222 knockout animals exhibited increased survival time (Fig. 3d), suggesting that loss of miR-221/222 confers resistance to bacterial replication and/or dissemination. These findings suggest that miR-221/222 broadly suppress inflammation and innate immune function. During early stages of sepsis miR-221/222 expression may be protective by limiting excessive inflammatory cytokine production that contributes to septic shock. Conversely, miR-221/222 appears to contribute to immunoparalysis, and increased miR-221/222 expression may enhance lethality at later stages of sepsis (Fig. 3e).
Because it is unclear which models most accurately resemble patient conditions, we next examined miR-221/222 expression in human disease. Consistent with results from murine cells, miR-221 and miR-222 are both upregulated in response to prolonged LPS stimulation of a human monocyte-like cell line, whereas only miR-222 is upregulated by LPS in this cell line after PMA-induced differentiation to a macrophage-like cell type (Extended Data Fig. 8a–b). Next we analyzed miR-221/222 expression in three patient cohorts. In the first cohort (Extended Data Fig. 8c), we quantified miR-221 and miR-222 levels in peripheral blood mononuclear cells (PBMCs) from 10 sequential intensive care unit (ICU) patients who met sepsis criteria28 within 4 hours of ICU admission. Compared to PBMCs from healthy donors, miR-221 and miR-222, but not several other inflammation-associated miRNAs, were significantly higher in the ICU patient samples (Fig. 4a). Expression levels were then examined in a second patient cohort with acute decompensated liver disease and clinical suspicion of infection (Extended Data Fig. 8d). Patients with organ failure, defined by the chronic liver failure-sequential organ failure assessment (CLIF-SOFA), had significantly higher miR-222 levels than patients without (Fig. 4b). Levels of miR-221 correlated with miR-222 levels (Extended Data Fig. 8f), but were not increased to statistically significant levels (Fig. 4c). Levels of miR-222 in this cohort inversely correlated with BRG1 expression levels (Fig. 4d). In a set of matched PBMC and serum samples, miR-222 and TNF levels also inversely correlated (Fig. 4e). Finally, the inverse correlation between miR-222 and BRG1 was also observed in CD14+ monocytes sorted from the PBMC population of a third clinical cohort (Fig. 4f and Extended Data Fig. 8e), confirming changes in myeloid cell miR-222 and BRG1 levels.
Figure 4. miR-222 correlates with immunosuppression and severe sepsis in patients.

a, Expression in PBMCs from healthy donors (H) or septic ICU patients (P) (n=10/group). p-values: 2-sided Mann–Whitney U test. b-c, Expression in PBMCs from a patient cohort with chronic liver disease stratified for bacterial infection (n=20 patients negative, 10 positive) and inflammation-related organ failure (acute-on-chronic liver failure; n=15 patients/group). p-values: 2-sided Mann–Whitney U test. d, f, Correlation of RNA levels in PBMCs (d, n=28 patients) or CD14+ monocytes of multiple organ failure patients (f, n=10 patients). Spearman’s rho (rs) and p-values from bivariate non-parametric regression analysis. e, Correlation of serum TNF and miR-222 expression in PBMCs from four patients with signs of infection. 2 patients had organ failure according to the EASL CLIF-C criteria for Acute-on-chronic Liver Failure. Box and whisker plots: median as center line; box: 25th to 75th percentiles; whiskers: minimum to maximum values.
Unlike generalized inflammatory markers, miR-222 elevation correlates specifically with severe sepsis. miR-222 levels do not correlate with inflammatory markers such as CRP or white blood cell count, but showed a significant correlation with organ damage markers including creatinine and the model for end-stage liver disease score (Extended Data Fig. 8g–j). Hence, miR-222 expression may be a useful biomarker for discriminating patients who are undergoing septicemia-induced immunoparalysis and are, therefore, predisposed to organ failure and mortality.
In summary, the data presented in this report establish a model in which miR-221/222 restricts chromatin remodeling and silences transcription to enforce innate immune tolerance. Upon prolonged innate immune signaling, increased expression of miR-221/222 reduces BRG1 expression. The resulting changes in SWI/SNF complex levels, or composition, leads to selective expression of only those LPS-response genes with the most favorable chromatin states. The fact that significant changes in gene expression result from modest miR-221/222 dependent changes in BRG1 expression is consistent with previous reports that mutation or deletion of a single allele of SWI/SNF subunit is sufficient to confer strong phenotypic effects29,30. Hence, by fine-tuning the levels of BRG1, miR-221/222 can prevent prolonged expression of STAT-dependent inflammatory genes in macrophages, thereby leading to tolerance or innate immunoparalysis (Extended Data Fig. 9). In contrast, robust activation of STAT1, for example by co-stimulation with IFNγ can block8 or even reverse31,32 LPS tolerance and innate immunoparalysis. Consistent with such a role for STAT1, treatment with IFNγ has been shown to improve outcomes in sepsis33.
Although LPS tolerance promotes survival in murine models of sterile shock, sepsis patients likely succumb to primary or secondary1 infections due to immunosuppression as a result of functional reprogramming of myeloid cells. Thus, paradoxically, the same innate immunoparalysis that is protective in the murine LPS-shock model would be responsible for organ damage and mortality in human sepsis patients. We identify miR-222/221 as a mediator of tolerance and show that miR-221/222 expression may distinguish organ failure patients at high risk of mortality from those with infection alone. Thus, monitoring of miR-221/222 or related bio-markers may help clinicians to stratify sepsis patients into groups who would benefit from pro-inflammatory immunotherapies versus those who might be helped by classical anti-inflammatory treatments.
Methods
Cell culture
RAW 264.7 cells (ATCC TIB-7) were cultured in DMEM supplemented with 10% fetal bovine serum. 293FT cells (Invitrogen R7007) and L-929 cells (ATCC CCL-1) were cultured in DMEM supplemented with 10% fetal bovine serum. Cells were purchased from vendor and tested for mycoplasma contamination prior to use (no further authentication of line identity was performed). L-cell conditioned medium (LCM) was generated by filter-sterilizing the supernatant of L-929 cells that were allowed to grow for one week in culture. Primary BMDMs were generated by isolation and culture of mouse bone marrow in complete RPMI supplemented with 20% LCM for up to 12 days. Immortalization of BMDMs was performed as described34 by inoculation with the J2 retrovirus. For cell stimulations, 10 ng/ml LPS (Sigma L8274), 10 ng/ml recombinant human TNF (R&D Systems 210-TA), 100 ng/ml recombinant mouse IL-1β (R&D Systems 401-ML-005), 100 ng/ml recombinant mouse IFNγ (BD Pharmingen 554587), 10 pg/ml recombinant mouse IL-10 (eBioScience 88-7104-ST), 10 μM dexamethasone (Sigma D402), and 0.01 μM estrogen (Sigma E2758) were used unless otherwise indicated. For tolerization experiments, BMDMs were stimulated with 10 ng/ml LPS for 15 hours (or as indicated), washed 5 times with 1× PBS, then allowed to rest for 2 hours in LPS-free complete medium supplemented with 20% LCM. BMDMs were then stimulated with 1 μg/ml LPS for 4 hours (for qPCR) or 12 hours (for ELISA), or as indicated.
miRNA microarray
Samples were treated as described, rinsed with 1× PBS, lysed in TRIzol, and sent to a commercial microRNA array profiling service (Exiqon). As part of the service, samples were labeled using the miRCURY Hy3/Hy5 Power labeling kit and hybridized on the miRCURY LNA Array (v.11.0 hsa, mmu and rno). All capture probes for the control spike-in oligonucleotides produced signals in the expected range. The quantified signals (background corrected) were normalized using the global Lowess (LOcally WEighted Scatterplot Smoothing) regression algorithm, and a list of differentially expressed miRNAs was returned.
miRNA mimic and antagonist oligonucleotides
Pre-miR miRNA precursors (Ambion AM17100) and Anti-miR miRNA inhibitors (Ambion AM17000) were transfected into BMDMs to modulate miRNA function in short term experiments. Part numbers for oligonucleotides are as follows: For overexpression experiments, Pre-miR Negative Control #1 (Invitrogen AM17110), miR-222-3p (PM11376), miR-221-3p (PM10337); for antagonization experiments, Anti-miR miRNA Negative Control #1 (Ambion AM17010), miR-222-3p (AM11376), miR-221-3p (AM10337). To optimize transfection conditions, the FAM Dye-Labeled Pre-miR Negative Control #1 (Invitrogen AM17121) oligonucleotide was used. Transfection of 50,000 BMDMs per well of a 12-well plate with 6 μl Lipofectamine and 0.1 nmol oligonucleotide diluted in 200 μl of Opti-MEM (total) was found to provide transfection of >80% of cells (as measured by flow cytometry), and these conditions were used for all further experiments in BMDMs. Medium was replaced with complete RPMI containing 20% LCM after 4 hours to minimize cytotoxicity. Cells were allowed to recover for 24-48 hours before stimulation.
Production of virus and BMDM transduction
Plasmids for miRNA overexpression (GeneCopoeia CmiR0001-MR01, MmiR3289-MR01, or MmiR3434-MR01) or antagonization (GeneCopoeia CmiR-AN0001-AM03 or HmiR-AN0399-AM03) were transfected into 293FT cells with the Lenti-Pac HIV Expression Packaging Kit (GeneCopoeia HPK-LVTR-20) or Lenti-Pac FIV Expression Packaging Kit (GeneCopoeia FPK-LVTR-20) to generate viral particles. BMDMs were inoculated by spin infection in 6-well plates in the presence of 6 μg/ml polybrene (Sigma H9268). Following spin inoculation, viral supernatant was immediately replaced with complete RPMI supplemented with 20% LCM. Cells were allowed to recover overnight. For primary BMDMs, plating for inoculation was generally performed on day 5 of differentiation. The first spin infection was performed on day 6, second spin infection (if necessary) was performed on day 7, and plating for experiments was performed on day 8.
ELISA
BMDMs were plated at 50,000 cells/well, and cytokine concentrations in cell supernatants were measured using the BD OptEIA Mouse IL-6 ELISA Set (BD 555240), BD OptEIA Mouse IL-12 (p40) ELISA Set (BD 555165), or BD OptEIA Mouse TNF (Mono/Mono) ELISA Set (BD 555268) according to manufacturer instructions.
RNA extraction, RT, and qPCR
Total RNA was extracted from samples using TRIzol reagent (Invitrogen 15596018). For reverse transcription of and detection of miRNAs, the Universal cDNA Synthesis Kit (Exiqon 203301) and locked nucleic acid primers (Exiqon) were used. For other genes, approximately 1 μg of RNA was reverse transcribed with SuperScript III (Invitrogen 18080085). qPCR was then performed with VeriQuest Fast SYBR (Affymetrix 75675). The amplified transcripts were quantified using the comparative Ct method.
Computational prediction of miRNA binding sites
miR-222 binding sites were predicted using the PITA algorithm35 (http://genie.weizmann.ac.il/pubs/mir07/mir07_prediction.html) or MicroCosm Targets program (which utilizes the miRanda algorithm; http://www.ebi.ac.uk/enright-srv/microcosm/htdocs/targets/v5/) as indicated in the text. MicroCosm Targets Version 5 was used to search for targets for mmu-miR-22236. UTRs and miRNA sequence were manually input to the PITA algorithm, and default search settings were utilized. All predictions were re-verified with their respective programs on Dec 5, 2013.
Construction of reporter vectors and luciferase reporter assays
The Brg1 UTR was amplified from IMAGE clone 30533489 (Open Biosystems MMM1013-9498346) and cloned into the pMIR-Report (Ambion AM5795) multiple cloning site using HindIII and SpeI restriction sites. The Tnf UTR was amplified from cDNA generated from BMDMs stimulated with LPS for 1 hour, and inserted into the pMIR-Report vector as performed for the Brg1 UTR. Reporter plasmids were transfected into 293FT cells along with a Renilla luciferase reporter (used to normalize for transfection efficiency). After 24 hours, Firefly and Renilla luciferase activity was quantified using the Dual-Luciferase Reporter Assay (Promega E1980).
CRISPR
The CRISPR design tool (crispr.mit.edu) was used to design guide RNAs for cloning into the PX458 (Addgene 48138) and PX459 (Addgene 48139) Cas9/sgRNA expression plasmids37 to generate plasmids to target identified miR-222 binding sites for deletion. Cells were transiently transfected with empty vector or targeting vectors. After 24 hours, transfected cells were selected by 48 hours of puromycin treatment (PX459) or by sorting for GFP positive (PX458) cells. Limiting dilution was performed to isolate clonal cell lines. Clones were screened for appropriate deletion by PCR. Deletion of targeted regions was confirmed by sequencing when necessary. Gene expression was compared between lines with successful deletion, unsuccessful deletion, and lines generated by transfected with expression plasmids that lacked a Cas9 targeting sequence.
For deletion of the miR-222 binding site in the Tnf UTR, the following guide sequences were used:
Combination 1:
TCAGCGTTATTAAGACAATT GGG
ATTACAGTCACGGCTCCCGT GGG
Combination 2:
TTGTCTTAATAACGCTGATT TGG
ATTTCTCTCAATGACCCGTA GGG
For deletion of the miR-222 binding site in the Brg1 UTR, the following guide sequences were used:
Combination 1:
GGAGTAGCCCTTAGCAGTGA TGG
ACCAGATGTAGTTTCGAACT TGG
Intracellular staining for flow cytometry
Cells were rinsed and fixed for 15-30 minutes at room temperature in 4% paraformaldehyde. Cells were rinsed and permeabilized by resuspension in 5% saponin for 10-20 minutes at room temperature. Either anti-IκBα (L35A5, Cell Signaling 4814), anti-Brg1 (H88, Santa Cruz sc-10768), or Rabbit mAb IgG Isotype Control (Cell Signaling 3900) was added, and cells were incubated for an additional 20 minutes at room temperature. Cells were rinsed and re-suspended in saponin with 1:300 dilution of fluorochrome conjugated secondary antibody (Alexa Fluor 488 Donkey Anti-Rabbit IgG, Invitrogen A21206; Alexa Fluor 546 Goat Anti-Rabbit IgG, Invitrogen A11010; or Alexa Fluor 546 Donkey Anti-Mouse IgG, Invitrogen A10036). After incubation at room temperature for 20 minutes, cells were rinsed, re-suspended in PBS, and analyzed on a BD LSRII flow cytometer.
Chromatin immunoprecipitation
Cells from a 15 cm plate were fixed by incubation in 1% formaldehyde for 5 minutes, rinsed, and lysed by incubation for 5 minutes on ice in buffer L1 (50 mM Tris at pH 9, 2 mM EDTA, 0.1% NP-40, 10% glycerol, with protease inhibitors). Nuclei were spun down and re-suspended in 500 μl buffer L2 (50 mM Tris at pH 8, 0.1% sodium dodecyl sulfate, and 5 mM EDTA). Sonication was performed in a Bioruptor, using 10 cycles of 30 seconds each. Immunoprecipitation was performed using 20 μl magnetic protein A beads and 5 μg anti-acetyl-histone H4 (Lys5; Millipore 07-327), 2 μg Brg1 (H-88; Santa Cruz sc-10768), or 5 μg acetyl-histone H3 (Millipore 06-599) per 50 μl of chromatin in a 500 ul volume. After overnight rotation at 4 C, supernatant was isolated. DNA was recovered from the supernatant by adding 20 μl of 5 M NaCl, 50 μl of 10% SDS, and 5 μl of proteinase K, shaking for 2 hours at 60 degrees (unbound fraction). Beads were washed 3× in high salt buffer (20 mM Tris at pH 8.0, 0.1% SDS, 1% NP-40, 2 mM EDTA, and 0.5 M NaCl), and 3× in TE. DNA was eluted from beads by re-suspending beads in 100 μl elution buffer and shaking for 2 hours at 60 degrees (bound fraction). Bound and unbound fractions were heated to 95 C for 10 minutes. DNA was purified from fractions using the Qiagen PCR Purification Kit (28104). To check for promoter binding, qPCR was performed using DNA from the bound and unbound fractions. Bound/unbound ratios were normalized to alpha-crystallin ratios, as this should represent a silent gene.
Amaxa nucleofection
BMDMs were nucleofected with 2 ug of plasmid DNA using the Amaxa Mouse Macrophage Nucleofector Kit (VPA-1009), in conjunction with the Amaxa Nucleofector II Device, according to the manufacturer-optimized protocol.
Salmonella enterica serovar Typhimurium infection
For these experiments, a GFP-expressing Salmonella enterica serovar Typhimurium strain (SL1344) was used. S. Typhimurium cultures were grown in LB supplemented with 100 ug/ml carbenicillin and 30 ug/ml streptomycin. Overnight cultures were diluted and allowed to grow for an additional hour before use to ensure bacteria were in log growth phase. OD 600 readings were correlated to previously determined CFU values and used to quantify number of bacteria present in culture. BMDMs were infected by inoculation of DMEM growth medium (containing only streptomycin) with bacteria at a multiplicity of infection of 50. Plates were spun at 800 rcf for 5 minutes at 4 C. BMDMs were incubated for 30 minutes at 37 degrees. Cells were washed 3 times, then incubated in medium containing gentamycin (100 ug/ml for incubations of 2 hours or less, 12 ug/ml for longer incubations). BMDMs were subsequently analyzed for GFP content by flow cytometry, or lysed in water to allow for plating of lysate dilutions on LB agar plates containing carbenicillin to determine bacterial CFU counts.
Mice
For BMDM generation, female C57Bl/6J mice, 7-10 weeks of age, were used unless otherwise noted. For tolerance and septic shock experiments, male C57Bl/6J mice, 6-10 weeks of age, were used. LPS (E. coli O55:B5; Sigma L2880) and D-(+)-Galactosamine hydrochloride (Sigma G0500) were re-suspended in sterile PBS and filter sterilized prior to intraperitoneal injection. For in vivo infection experiments, mice were given intraperitoneal injections of 1×10^7 CFU/kg of a GFP-expressing Salmonella enterica serovar Typhimurium strain (SL1344) suspended in PBS. Mice were maintained under specific pathogen-free conditions in animal facilities at Columbia University Medical Center. All animal experiments were carried out with the approval of the Columbia University Institutional Animal Care and Use Committee, and in compliance with regulations and guidelines set forth by Columbia University.
Generation of knockout mice
miR-221/222 knockout mice were generated at the Columbia University Transgenic Mouse facility. In brief, KV1 (129B6 hybrid) ES cells were electroporated with the linearized targeting construct discussed in Extended Data Fig. 6. After positive and negative selection, clonal cell lines were screened by PCR for proper integration of the construct. Positive lines were expanded, blastocyst injection was performed, and germline transmission was confirmed. miR-221/222 knockout mice were backcrossed to the C57Bl/6 background 5-8 times prior to experimental use.
Peritoneal macrophage isolation
5 ml of cold PBS was injected into the peritoneal cavity of euthanized mice. Peritoneum was gently massaged. Fluid was collected, and process was repeated. Cell suspension was spun down, and cells were plated at 500,000 cells per well in 12-well plates. Macrophages allowed to adhere overnight. Non-adherent cells rinsed off with PBS washes.
Thioglycollate elicitation of peritoneal macrophages
3% thioglycollate was sterilized and aged for at least 2 months. 1 ml of thioglycolate preparation was injected into the peritoneal cavity of each mouse 5 days prior to the isolation of macrophages (as described above).
Monocyte isolation
Bones were isolated from wildtype C57Bl6/J mice. Marrow was retrieved by crushing. Monocytes were purified using the EasySep Mouse Monocyte Isolation Kit.
RNA-sequencing
RNA-sequencing was performed by the JP Sulzberger Columbia Genome Center. Poly-A pull-down was used to enrich mRNAs from total RNA samples (200ng-1ug per sample, RIN>8 required). Libraries were prepared using the Illumina TruSeq RNA prep kit. Libraries were then sequenced using Illumina HiSeq2000. Multiplexed and pooled samples were sequenced to a depth of 24-34×106 reads per sample as 100 bp single end reads. RTA (Illumina) was used for base calling, and bcl2fastq (version 1.8.4) was used for converting BCL to fastq format, coupled with adaptor trimming. Reads were mapped to a reference genome (Mouse: UCSC/mm9) using Tophat (version 2.1.0) with 4 mismatches (–read-mismatches = 4) and 10 maximum multiple hits (–max-multihits = 10). To tackle the mapping issue of reads that are from exon-exon junctions, Tophat infers novel exon-exon junctions ab initio, and combines them with junctions from known mRNA sequences (refgenes) as the reference annotation. The relative abundance (aka expression level) of genes and splice isoforms were estimated using cufflinks (version 2.0.2) with default settings.
ChIP-sequencing analysis
Track data of genes of interest were loaded into Galaxy38 (usegalaxy.org) using the UCSC table browser and mouse mm10 genome. Using Galaxy, previously published ChIP-seq data was then aligned to the mouse mm10 genome using the HISAT program (Galaxy Version 2.03) with default settings. BamCoverage (Galaxy Version 2.3.6.0) was then used to generate a coverage bigwig file, using default settings to scale to the size of the mm9 mouse genome. ComputeMatrix (Galaxy Version 2.3.6.0) and plotHeatmap (Galaxy Version 2.3.6.0) were then used to compare TF occupancy at gene promoters, using the TSS as the reference point.
Dataset references
ChIP-seq data was analyzed from the following: GSE5612320 (IRF1, IRF8, STAT1, STAT2); GSE6734321 (IRF3); GSE3610422 (IRF2, IRF4, NF-kB subunits); ERA319838 (IRF5); GSE6269723 (IRF7); GSE7788624 (IRF mutants); GSE3837925 (STAT1 knockout).
Patient sample selection and processing (Fig. 4a)
We selected 10 consecutive patients newly admitted to a medical or surgical ICU who had the systemic inflammatory response syndrome (SIRS) and a known or suspected infection39. Patients were excluded from the study if they had an ICU admission or bacteremia within the previous 30 days. After obtaining informed consent from the patient or a surrogate, whole blood was drawn within 4 hours of ICU admission. PBMCs were isolated from whole blood of healthy human volunteers or buffy coat isolates from ICU patients meeting sepsis criteria by centrifugation on a Ficoll cushion. RNA was isolated with the miRNeasy micro kit (Qiagen 217084) and reverse transcribed as described above. Experiments were performed with approval of the Institutional Review Board at Columbia University and in accordance with regulations and guidelines set forth by the university.
Patient sample selection and processing (Fig. 4b–f)
Additional patient cohorts were obtained from hospitalized patients with acute decompensation of chronic liver disease and suspected bacterial infection. Baseline characteristics and outcome of patients with decompensated liver disease in the absence or presence of multiple organ failure syndrome (according to the EASL CLIF-C criteria for Acute-on-chronic Liver Failure40) are given in Extended Data Fig. 8. Clinical scores such as model for end-stage liver disease (MELD) scores, bacterial culture count, protein analysis, blood count and serum levels of C-reactive protein (CRP), creatinine were obtained from routine laboratory analysis. The determination of serum concentration of TNF was performed by ELISA.
The isolation and characterization of human immune cells and the use of clinical data was approved by the internal review board (Ethics committee of the Jena University Hospital, no. 3683-02/3). The study conformed to the ethical guidelines of the 1975 Declaration of Helsinki, and patients granted written informed consent prior to inclusion.
Statistics and sample collection
Students t-tests were performed using the T.TEST function in Microsoft Excel. All other statistical tests were performed using Prism software. Unless otherwise stated, two-sided tests were performed. For samples using cell lines and cells isolated from inbred mice, the Students t-test was often used. The distributional requirements for the test are assumptions. This means for instance, under the assumption of normal-distributed residuals, the t-test is an exact test, however given a non-normal distribution of cell line data, the test is not anymore exact but approximative. For patient samples, nonparametric tests were used to avoid the assumption of a normal distribution. In all figures, error bars represent S.E.M. unless otherwise indicated. Standard deviations and S.E.M. were calculated for each group of data and used to estimate variation (S.E.M. values are shown as error bars in most experiments). Variation generally appears similar between groups being compared. All experiments were replicated in the laboratory at least 2 times. Unless otherwise indicated, in experiments utilizing primary cells, n represents number of experiments performed with separate cell isolations; in experiments utilizing immortalized cells or cell lines, n represents the number of experiments performed using separate cell populations. Systematic randomization and blinding were not performed. Samples were excluded from the analysis if they were identified as outliers using the Grubbs' test, also called the ESD method (extreme studentized deviate).
For animal LPS shock studies, appropriate sample size was estimated based on an outcome variable of survival time, measured in hours. An estimate was based on using a one-tailed Student's t-test to determine statistical significance. Control animals were expected to succumb within 62 hours. Knockout animals were expected to become moribund 52 hours after LPS injection at the latest. Therefore, the minimal effect size was estimated to be 10 hours. Based on literature and experiments previously performed by our lab, we anticipated a standard deviation of 10 hours. Taking into account a power of 80% and alpha of 0.05, we calculated a sample size of 10 mice per genotype.
Data accessibility
RNA-sequencing data that support the findings of this study have been deposited in GEO with the accession code GSE89918 (https://www.ncbi.nlm.nih.gov/geo/).
Extended Data
Extended Data Figure 1. In vitro modeling of tolerance and miR-222 induction upon prolonged LPS stimulation.

a, Schematic of experiments performed in (b). b, Expression of LPS-response genes in control BMDMs that have undergone the given treatments. 4 major expression patterns of LPS response genes in response to tolerization were noted (n=5 biologically independent samples). c, Schematic of experiments performed in (d). d, Cytokine production, measured by ELISA, by BMDMs re-stimulated with LPS overnight after pre-treatment with LPS for the given periods of time. Time points chosen for miRNA microarray analysis are highlighted in gray (n=3 biologically independent samples). e, Schematic of strategy for experiments performed in Fig. 1. f, Comparison of microarray (x-axis) and qPCR (y-axis) measurements of LPS-induced upregulation of miRNAs. Linear regression showing correlation between the two methods is plotted (n=16 miRNAs tested). g, qPCR verification of LPS-induced change in expression of 9 miRNAs (n=3 biologically independent samples). h, Expression of miR-222 after stimulation of BMDMs by anti-inflammatory and tolerance-inducing factors for the given lengths of time (n=5 biologically independent samples; Dex, Dexamethasone). i, Expression of miR-222 in response to LPS alone, or LPS after pre-treatment of BMDMs with IFNγ (n=4 biologically independent samples). For all bar and line graphs, mean +/− SEM is plotted. ** p < 0.01, * p < 0.05, + p < 0.1 as determined by 2-sided Student’s t-test for paired values.
Extended Data Figure 2. Differential regulation of miR-222 and miR-221 and association of miR-222 with in vitro tolerance.
a-c, Expression of miR-221 and miR-222 in response to LPS stimulation of BMDMs (a, n=4 biologically independent samples), peritoneal macrophages (b, n=3 biologically independent samples for miR-222 and n=4 biologically independent samples for miR-221), or monocytes isolated from the bone marrow (c, n=3 biologically independent samples), as determined by qPCR. d, LPS-induced miR-221 and miR-222 expression in BMDMs with or without IFNγ pre-treatment, as determined by qPCR (n=2 biologically independent samples). e, Schematic of experiments performed in (f-g) and Fig. 1c. f-g, LPS-induced gene expression at the mRNA (i) or primary transcript (j) level after miR-222 mimic transfection (n=5 biologically independent samples). For all bar and line graphs, mean +/− SEM is plotted. ** p < 0.01, * p < 0.05, + p < 0.1 as determined by two-sided Student’s t-test for paired values.
Extended Data Figure 3. Tnf is a direct target of miR-222, but suppression of Tnf does not account for miR-222-mediated transcriptional silencing of late LPS response genes.

a, Sequence and prediction scores of a miR-222 binding site in the Tnf UTR. b, Activity of a luciferase reporter construct in which the luciferase coding sequence is followed by either the complete Tnf UTR, or a UTR in which the predicted miR-222 binding site has been mutated to the sequence shown in (a) (n=6 independent experiments). c, CRISPR-Cas9 targeting strategy to delete predicted binding sites. d, RAW clones were screened for successful deletion of the miR-222 binding site by PCR across the targeted region of the UTR, using genomic DNA from the given clonal line as a template. Screening for Tnf UTR deletion is shown. Experiment was repeated twice with similar results. e, Successful deletion of the miR-222 binding site in RAW cell clones was confirmed by sequencing genomic DNA of the given cell line. miR-222 binding site in the TNF UTR is highlighted in yellow. f, LPS-induced Tnf expression in control and CRISPR-Cas9 targeted RAW cells (n=4 independent experiments). g, Average effect of miR-222 mimic transfection on LPS-induced Tnf mRNA levels in either control MEFs or MEFs which have undergone CRISPR targeting and clonal selection for deletion of the miR-222 binding site. Average of the effects from the 3 clonal lines (n=3 independent experiments). h, Wildtype BMDMs were transfected with a control or miR-222 mimic oligonucleotide. 24 hours later, cells were pre-treated with an isotype control (IgG) or TNF neutralizing (α-TNF) antibody for two hours, and stimulated with 10 ng/ml LPS. Expression of the given genes was measured by qPCR (n=4 biologically independent samples). i, Efficacy of TNF neutralization was confirmed by treating cells with IgG or α-TNF as above, followed by stimulation with 100 ng/ml recombinant mouse TNF (n=3 biologically independent samples). Gene upregulation was not detected (ND) in 2/3 samples treated with α-TNF. For all bar graphs, mean +/− SEM is plotted. ** p < 0.01, * p < 0.05, + p < 0.1 as determined by two-sided Student’s t-test for paired values.
Extended Data Figure 4. Evidence of miR-222 targeting of Brg1.
a, Example of gating that was used to exclude dead cells from flow cytometry analyses in (c), (g), and Extended Data Fig. 6i. b, Example of gating used to distinguish cells with high vs. low levels of IκBα, as analyzed in (c). c, Effect of miRNA overexpression (by viral transduction) on LPS-induced IκBα degradation in iBMDMs, measured by flow cytometry (n=4 independent experiments). d, Sequence and prediction scores of a miR-222 binding site in the Brg1 UTR. e, miR-222 and Brg1 mRNA levels in LPS-stimulated BMDMs (n=3 biologically independent samples). f, Brg1 mRNA levels in resting BMDMs 24 hours after transfection (n=4 biologically independent samples). g, Effect of miRNA overexpression or antagonization (by viral transduction) on BRG1 levels in iBMDMs, observed by flow cytometry. Representative of 4 independent experiments with similar results, quantified in (h). h, Flow cytometry analysis of BRG1 protein levels in transduced iBMDMs (n=4 independent experiments). i, Activity of a luciferase reporter construct in which the luciferase coding sequence is followed by either the complete Brg1 UTR, or a UTR in which the predicted miR-222 binding site has been mutated to the sequence shown in (d) (n=3 independent experiments). j, Quantification of average effect of miR-222 mimic transfection on Brg1-dependent and –independent LPS-response genes (n=3 biologically independent samples). Two-sided Student’s t-test for heteroscedastic values used to compare ratios (miR-222 overexpression/control) at peak LPS-induced expression times for Brg1-dependent vs. -independent genes. k-l, ChIP for histone H3 acetylation (k), or histone H4 acetylation (l) after LPS stimulation of iBMDMs transduced with overexpression constructs (k-l tested in same n=3 independent experiments). m, Successful deletion of the miR-222 binding site in the Brg1 UTR in RAW cell clones was confirmed by sequencing genomic DNA of the given cell line. miR-222 binding site is highlighted in yellow. n, Effect of miR-222 overexpression (by oligonucleotide transfection) on LPS-induced gene expression in either a RAW cell line in which the Brg1:miR-222 binding site was deleted by CRISPR targeting (as shown in Extended Data Fig. 3c) or a cell line in which the binding site was not targeted for deletion (n=5 independent experiments). For all bar graphs, mean +/− SEM is plotted. ** p < 0.01, * p < 0.05, + p < 0.1 as determined by two-sided Student’s t-test for paired values.
Extended Data Figure 5. Comparison of miR-221 and miR-222 and effects of miR221/222 deletion on the transcriptional response to LPS.

a, Alignment of the mature miR-221 and miR-222 sequences. The miRNA seed sequence is highlighted in yellow. b, Venn diagram displaying overlap between Microcosm target predictions for mmu-miR-221 and mmu-miR-222. c, Alignment and computational scores of miR-221 sequence with predicted Brg1 UTR target site. Alignment of miR-222 sequence with the site is also shown. d, Brg1 expression in BMDMs transfected with the given oligonucleotide (n=3 biologically independent samples). e, LPS-induced cytokine production in BMDMs transfected with given miRNA mimics, as measured by ELISA (n=5 biologically independent samples). f, Schematic of the miR-221/222 locus after targeting with a construct designed to generate both complete and conditional miR-221/222 knockout mice. g, Schematic of the miR-221/222 locus after breeding targeted mice (f) with EIIa-Cre mice, which results in complete deletion of miR-221/222. h, miRNA expression in BMDMs from littermates with a wildtype or miR-222 knockout allele (n=5 biologically independent samples). i, LPS-induced gene expression in naïve or tolerized peritoneal macrophages isolated from wildtype or miR-222 knockout littermates (n=7 biologically independent samples). j, Heatmap comparing the effect of Brg1/Brm knockdown15 and miR-222 knockout on gene expression. Colors represent values of the given ratios; red indicates increased expression, white indicates no change, and blue indicates decreased expression. k, Heat map of LPS-induced gene expression in wildtype and miR-222 knockout macrophages. For all bar graphs, mean +/− SEM is plotted. ** p < 0.01, * p < 0.05, + p < 0.1 as determined by two-sided Student’s t-test for paired (d-e) or heteroscedastic (i) values.
Extended Data Figure 6. Gene ontology and ChIP-seq analysis shows that genes affected by miR-221/222 knockout have differential gene functions and transcription factor binding at promoters.

a–f, Enriched gene ontology terms (a-c) and transcription factor binding at promoters (d-f) of genes that are expressed at higher (2-fold or higher) or lower (0.5-fold or lower) levels in miR-221/222 KO macrophages after no stimulation (a, d; n=647 genes higher, 565 genes lower), LPS stimulation (b, e; n=143 genes higher; 121 genes lower), or LPS tolerization followed by restimulation (c, f; n=123 genes higher; 48 genes lower). PANTHER was used to identify GO terms. Top 4 for each category are shown; GO terms that are unique to either higher or lower expression gene subsets are highlighted. g-h, IRF and NF-κB subunit occupancy at gene promoters; gene subsets analyzed are described in Fig. 2h. For transcription factor analyses, previously published ChIP-seq data were utilized. i, RNA levels of genes in wildtype or miR-221/222 knockout peritoneal macrophages, quantified by a single RNA-sequencing experiment. j, qPCR for gene expression in WT BMDMs after Amaxa-based nucleofection of given overexpression construct (n=3 biologically independent samples). For all bar graphs, center value represents the mean and errors bars (if applicable) represent SEM is plotted.
Extended Data Figure 7. miR-221/222 knockout mice have an altered LPS response and knockout macrophages exhibits enhanced Salmonella uptake and clearance in vitro.

a,d, Schematic of experiments performed in (b-c). b, Survival of naive or tolerized mice injected with high doses of LPS. c, Wildtype or miR-222 knockout littermates were tolerized to LPS prior to lethal LPS injection. Change in body temperature after final LPS injection was monitored for 24 hours. d, Schematic of experiments performed in (e). e, Survival of naïve or tolerized mice injected with LPS and D-galactosamine. f, BMDMs from WT or miR-221/222 KO mice were spin-infected with a GFP-expressing strain of S. Typhimurium. Fluorescence was analyzed by microscopy 60 minutes post-infection. Representative of 2 independent experiments with similar results. g, BMDMs from WT or miR-221/222 KO mice were spin-infected with a GFP-expressing strain of S. Typhimurium. Fluorescence was analyzed by flow cytometry 30 minutes post-infection. Representative of 3 independent experiments with similar results. h, Average fluorescence of infected BMDMs after early (left) or late (right) time points after infection (n=4 biologically independent WT samples, 3 biologically independent KO samples). i, S. Typhimurium survival after in vitro infection of BMDMs, determined by comparing CFUs after lysis of BMDMs at early and late time points of infection (n=5 biologically independent WT samples, 4 biologically independent KO samples). For all bar and line graphs, mean +/− SEM is plotted. ** p < 0.01, * p < 0.05 as determined by two-sided Student’s t-test for heteroscedastic values.
Extended Data Figure 8. miR-221/222 is upregulated in human cells and sepsis patients.
a, b, LPS-induced miRNA expression in undifferentiated (a) or PMA-differentiated (b) human U937 cells (n=3 independent experiments). c, Patient characteristics for data in Fig. 4a. ICU, intensive care unit; APACHE, acute physiology and chronic health evaluation; SAPS, simplified acute physiology score. Categorical variables are given as (n, %) and continuous variables as (median, IQR). d,e Baseline characteristics of patients with decompensated liver disease in the absence or presence of multiple organ failure syndrome (according to the EASL CLIF-C criteria for Acute-on-chronic Liver Failure). Data in table (d) corresponds to PBMC analyses (Fig. 4b–d). Median with interquartiles or frequencies and percentages are shown. P values from Mann-Whitney U test or Fisher’s exact test as appropriate (2-sided). *comparing any infection versus no infection. ** 4/30 (13%) and 1/10 (10%) patients were lost to follow-up within 30 days. Data in table (e) corresponds to monocyte analyses (Fig. 4f). Median with interquartiles or frequencies and percentages are shown. P values from Mann-Whitney U test of Fisher’s exact test as appropriate (2-sided). *comparing any infection versus no infection. ** 1/10 (10%) patients were lost to follow-up within 30 days. f, Correlation between miR-221 and miR-222 levels in patients characterized in (d; n=30 patients). Bivariate nonparametric correlation analysis (Spearman’s rho) was used to identify correlations between variables and p-values. g-j, Linear correlation of miR-222 expression and CRP (g), WBC count (h) creatinine levels (i) or MELD score (j) in samples from the patient cohort described in (d; n=30 patients). Bivariate nonparametric correlation analysis (Spearman’s rho) was used to identify correlations between variables and p-values. For line graphs, mean +/− SEM is plotted.
Extended Data Figure 9. Model of the effect of miR-222 on LPS-induced macrophage tolerance.

a, Before an acute LPS stimulation, chromatin at BRG1-dependent gene promoters prevents binding of remodeling-dependent transcription factors and RNA polymerase. b, After an acute LPS stimulation, transcription factors such as STAT1 and STAT2 are recruited to gene promoters and stabilize BRG1 binding. c, BRG1 activity leads to chromatin remodeling, which d, allows for recruitment of additional transcription factors, such as NF-κB, to the unwound DNA. This allows for polymerase recruitment and licensing, leading to gene transcription. e, After an initial LPS response, chromatin is “reset” to an inhibitory state by negative regulators of chromatin accessibility. f, Upon LPS re-stimulation, transcription factors must again be recruited to gene promoters. However, miR-222 limits levels of BRG1. g, Lack of available BRG1 prevents chromatin remodeling at many gene promoters, and prevents downstream transcription factor recruitment. This prevents gene transcription from occurring in most cells.
Extended Data Table 1.
Identification of miR-222 targets.
| Predicted Target | Algorithm Score | P-Value | % Decrease |
|---|---|---|---|
| Mesdc1 | 16.1968 | 3.86E 09 | 31.83 |
| Nfyb | 16.5309 | 8.58E-07 | 31.90 |
| Nfyb | 16.027 | 8.58E-07 | 31.90 |
| Sntb1 | 15.4316 | 2.95E-06 | 25.70 |
| Smarca4 | 17.4905 | 4.57E-06 | 22.64 |
| Dclre1a | 15.2548 | 8.64E-06 | 22.67 |
| Nudt5 | 16.5017 | 2.21E-05 | 82.49 |
| Tpbg | 16.3439 | 3.79E-05 | 75.81 |
| Ptx3 | 15.9272 | 4.03E-05 | 50.04 |
| Apaf1 | 15.3191 | 9.59E-05 | 39.79 |
| Atp1a1 | 17.6386 | 9.74E-05 | 50.18 |
| Pdhb | 15.579 | 1.55E-04 | 26.18 |
| Uchl1 | 15.4257 | 4.72E-04 | 20.26 |
| Dhx9 | 16.4603 | 8.57E-04 | 96.82 |
| Tsc2 | 20.1182 | 8.93E-04 | 40.97 |
| Stmn1 | 16.5573 | 1.11E-03 | 82.55 |
| Stmn1 | 16.009 | 1.11E-03 | 82.55 |
| Ogfr | 16.0031 | 1.13E-03 | 21.35 |
| Ogfr | 16.0031 | 1.13E-03 | 21.35 |
| Ddx52 | 15.8837 | 1.30E-03 | 22.54 |
| Zfp462 | 15.3834 | 1.55E-03 | 20.92 |
| Sap30 | 17.1462 | 2.13E-03 | 37.05 |
| Mad2l2 | 16.0031 | 2.22E-03 | 37.34 |
| Idh2 | 15.8888 | 2.87E-03 | 47.13 |
| ll19 | 17.0841 | 3.61E-03 | 53.02 |
| Slc28a1 | 15.7179 | 4.02E-03 | 97.33 |
| Tsc2 | 18.4316 | 4.61E-03 | 40.97 |
| Capn7 | 15.7361 | 4.74E-03 | 24.89 |
| Aldh2 | 15.5459 | 5.13E-03 | 23.55 |
| Agpat2 | 18.2641 | 5.42E-03 | 40.86 |
| Kcnh2 | 16.7713 | 5.47E-03 | 32.31 |
| Cdca3 | 15.5835 | 5.53E-03 | 47.93 |
| Plaur | 15.7368 | 5.98E-03 | 57.51 |
| Agpat2 | 18.1381 | 6.13E-03 | 40.86 |
| Nfkbil1 | 17.832 | 6.74E-03 | 22.93 |
| Slc23a3 | 17.9463 | 7.38E-03 | 96.59 |
| Zyx | 15.3325 | 7.52E-03 | 27.10 |
| Nudt12 | 15.3316 | 7.53E-03 | 47.39 |
| Nfkb1 | 15.676 | 7.54E-03 | 67.70 |
| Nnt | 15.7463 | 7.66E-03 | 30.32 |
| Lcp1 | 16.0977 | 7.72E-03 | 45.12 |
| Lrg1 | 15.3173 | 7.73E-03 | 22.69 |
| Grip1 | 17.8508 | 8.09E-03 | 22.34 |
| Golga1 | 15.2869 | 8.15E-03 | 28.15 |
| Mapk6 | 15.3013 | 9.89E-03 | 36.07 |
| Smarca4 | 17.4953 | 1.14E-02 | 22.64 |
| Camp | 15.6238 | 1.43E-02 | 39.31 |
| Slc25a11 | 15.3352 | 1.46E-02 | 59.66 |
| Sult1a1 | 15.2729 | 1.60E-02 | 31.32 |
| 4930544G11Rik | 17.1192 | 1.64E-02 | 24.04 |
| Cish | 17.0804 | 1.70E-02 | 26.38 |
| Pdcd10 | 15.3459 | 1.88E-02 | 63.49 |
| Slc23a3 | 16.9058 | 2.01E-02 | 96.59 |
| Qdpr | 16.4511 | 2.06E-02 | 50.84 |
| Pabpc1 | 16.86 | 2.10E-02 | 65.55 |
| Cacnb2 | 16.0474 | 2.12E-02 | 34.44 |
| Ddhd1 | 16.8345 | 2.15E-02 | 89.58 |
| Dbnl | 16.7678 | 2.29E-02 | 29.83 |
| Ddhd1 | 16.696 | 2.45E-02 | 89.58 |
| Rtn1 | 16.6889 | 2.47E-02 | 33.46 |
| Exosc5 | 16.6889 | 2.47E-02 | 22.56 |
| Fignl1 | 16.64 | 2.59E-02 | 23.59 |
| 2610020O08Rik | 16.527 | 2.88E-02 | 21.06 |
| Tnfsf11 | 16.4951 | 2.97E-02 | 22.56 |
| Atox1 | 16.4786 | 3.02E-02 | 21.37 |
| Fntb | 16.3904 | 3.28E-02 | 26.90 |
| 4933402D24Rik | 16.3904 | 3.28E-02 | 21.47 |
| Olfr110 | 16.3782 | 3.32E-02 | 30.81 |
| Mrpl3 | 15.4861 | 3.34E-02 | 63.03 |
| Azi2 | 16.3295 | 3.47E-02 | 27.88 |
| Tnks | 16.326 | 3.48E-02 | 25.84 |
| Fkbp9 | 15.872 | 3.58E-02 | 60.69 |
| S100a4 | 16.2317 | 3.80E-02 | 78.00 |
| Dtymk | 16.2317 | 3.80E-02 | 20.44 |
| Ppp1r14d | 16.1174 | 3.82E-02 | 80.53 |
| H47 | 16.2002 | 3.92E-02 | 24.67 |
| Mrg2 | 16.1772 | 4.00E-02 | 32.25 |
| Rpl27a | 16.0727 | 4.41E-02 | 24.60 |
| Impa2 | 16.0513 | 4.50E-02 | 66.38 |
| Smarca4 | 16.0312 | 4.59E-02 | 22.64 |
| Mad2l2 | 16.0031 | 4.71E-02 | 37.34 |
| Cd33 | 15.9762 | 4.83E-02 | 46.63 |
miR-222 targets predicted by the MicroCosm program were filtered based on their expression in macrophages. Only targets that decreased in expression from 8–24 hours of LPS stimulation (column 4) were considered (using microarray data generated for a prior study42). Results were then sorted by p-value (generated by the microCosm program). Brg1 (Smarca4) is highlighted in bold red font. (Note: multiple listings for a target indicate that more than one site prediction for that gene was made by the MicroCosm program.)
Acknowledgments
We thank Dr. Michael McManus (UCSF) for generously providing us with a targeting construct used in the generation of miR-221/222 knockout mice. Supported by grants R21-AI116082 and R37-AI33443 to SG from the National Institutes of Health.
Footnotes
Author contributions: JJS performed the majority of the experiments and writing of the manuscript. RB performed the microRNA microarray experiment. GM performed experiments on patient samples. TB, SD, and DEF assisted with experimental design and collected patient samples for the human portions of this study. MSH assisted with experimental design and the writing of the manuscript. SG conceived of the study, provided guidance with experimental design, and writing of the manuscript.
RNA-seq data is deposited in the GEO database.
The authors declare no competing financial interests.
Main Text References
- 1.Hotchkiss RS, Monneret G, Payen D. Sepsis-induced immunosuppression: from cellular dysfunctions to immunotherapy. Nat Rev Immunol. 2013;13:862–874. doi: 10.1038/nri3552. [DOI] [PMC free article] [PubMed] [Google Scholar]
- 2.Ertel W, et al. Downregulation of proinflammatory cytokine release in whole blood from septic patients. Blood. 1995;85:1341–1347. [PubMed] [Google Scholar]
- 3.Otto GP, et al. The late phase of sepsis is characterized by an increased microbiological burden and death rate. Crit Care. 2011;15:R183. doi: 10.1186/cc10332. [DOI] [PMC free article] [PubMed] [Google Scholar]
- 4.Boomer JS, et al. Immunosuppression in patients who die of sepsis and multiple organ failure. JAMA. 2011;306:2594–2605. doi: 10.1001/jama.2011.1829. [DOI] [PMC free article] [PubMed] [Google Scholar]
- 5.Cavaillon JM, Adib-Conquy M. Bench-to-bedside review: endotoxin tolerance as a model of leukocyte reprogramming in sepsis. Crit Care. 2006;10:233. doi: 10.1186/cc5055. [DOI] [PMC free article] [PubMed] [Google Scholar]
- 6.Saeed S, et al. Epigenetic programming of monocyte-to-macrophage differentiation and trained innate immunity. Science. 2014;345:1251086. doi: 10.1126/science.1251086. [DOI] [PMC free article] [PubMed] [Google Scholar]
- 7.Foster SL, Hargreaves DC, Medzhitov R. Gene-specific control of inflammation by TLR-induced chromatin modifications. Nature. 2007;447:972–978. doi: 10.1038/nature05836. [DOI] [PubMed] [Google Scholar]
- 8.Chen J, Ivashkiv LB. IFN-gamma abrogates endotoxin tolerance by facilitating Toll-like receptor-induced chromatin remodeling. Proc Natl Acad Sci U S A. 2010;107:19438–19443. doi: 10.1073/pnas.1007816107. [DOI] [PMC free article] [PubMed] [Google Scholar]
- 9.Mages J, Dietrich H, Lang R. A genome-wide analysis of LPS tolerance in macrophages. Immunobiology. 2007;212:723–737. doi: 10.1016/j.imbio.2007.09.015. [DOI] [PubMed] [Google Scholar]
- 10.Fraker DL, Stovroff MC, Merino MJ, Norton JA. Tolerance to tumor necrosis factor in rats and the relationship to endotoxin tolerance and toxicity. J Exp Med. 1988;168:95–105. doi: 10.1084/jem.168.1.95. [DOI] [PMC free article] [PubMed] [Google Scholar]
- 11.Cavaillon J-M, P C, Fitting C. Endotoxin tolerance is not a LPS-specific phenomenon: partial mimicry with IL-1, IL-10 and TGFβ. Journal of Endotoxin Research. 1994:21–29. [Google Scholar]
- 12.Di Leva G, et al. MicroRNA cluster 221-222 and estrogen receptor alpha interactions in breast cancer. J Natl Cancer Inst. 2010;102:706–721. doi: 10.1093/jnci/djq102. [DOI] [PMC free article] [PubMed] [Google Scholar]
- 13.Stanton BZ, et al. Smarca4 ATPase mutations disrupt direct eviction of PRC1 from chromatin. Nat Genet. 2017;49:282–288. doi: 10.1038/ng.3735. [DOI] [PMC free article] [PubMed] [Google Scholar]
- 14.Ramirez-Carrozzi VR, et al. Selective and antagonistic functions of SWI/SNF and Mi-2beta nucleosome remodeling complexes during an inflammatory response. Genes Dev. 2006;20:282–296. doi: 10.1101/gad.1383206. [DOI] [PMC free article] [PubMed] [Google Scholar]
- 15.Ramirez-Carrozzi VR, et al. A unifying model for the selective regulation of inducible transcription by CpG islands and nucleosome remodeling. Cell. 2009;138:114–128. doi: 10.1016/j.cell.2009.04.020. [DOI] [PMC free article] [PubMed] [Google Scholar]
- 16.Saccani S, Pantano S, Natoli G. Two waves of nuclear factor kappaB recruitment to target promoters. J Exp Med. 2001;193:1351–1359. doi: 10.1084/jem.193.12.1351. [DOI] [PMC free article] [PubMed] [Google Scholar]
- 17.Agalioti T, Chen G, Thanos D. Deciphering the transcriptional histone acetylation code for a human gene. Cell. 2002;111:381–392. doi: 10.1016/s0092-8674(02)01077-2. [DOI] [PubMed] [Google Scholar]
- 18.Park CY, et al. A resource for the conditional ablation of microRNAs in the mouse. Cell Rep. 2012;1:385–391. doi: 10.1016/j.celrep.2012.02.008. [DOI] [PMC free article] [PubMed] [Google Scholar]
- 19.Ourthiague DR, et al. Limited specificity of IRF3 and ISGF3 in the transcriptional innate-immune response to double-stranded RNA. J Leukoc Biol. 2015;98:119–128. doi: 10.1189/jlb.4A1014-483RR. [DOI] [PMC free article] [PubMed] [Google Scholar]
- 20.Mancino A, et al. A dual cis-regulatory code links IRF8 to constitutive and inducible gene expression in macrophages. Genes Dev. 2015;29:394–408. doi: 10.1101/gad.257592.114. [DOI] [PMC free article] [PubMed] [Google Scholar]
- 21.Tong AJ, et al. A Stringent Systems Approach Uncovers Gene-Specific Mechanisms Regulating Inflammation. Cell. 2016;165:165–179. doi: 10.1016/j.cell.2016.01.020. [DOI] [PMC free article] [PubMed] [Google Scholar]
- 22.Garber M, et al. A high-throughput chromatin immunoprecipitation approach reveals principles of dynamic gene regulation in mammals. Mol Cell. 2012;47:810–822. doi: 10.1016/j.molcel.2012.07.030. [DOI] [PMC free article] [PubMed] [Google Scholar]
- 23.Cohen M, et al. Chronic exposure to TGFbeta1 regulates myeloid cell inflammatory response in an IRF7-dependent manner. EMBO J. 2014;33:2906–2921. doi: 10.15252/embj.201489293. [DOI] [PMC free article] [PubMed] [Google Scholar]
- 24.Langlais D, Barreiro LB, Gros P. The macrophage IRF8/IRF1 regulome is required for protection against infections and is associated with chronic inflammation. J Exp Med. 2016;213:585–603. doi: 10.1084/jem.20151764. [DOI] [PMC free article] [PubMed] [Google Scholar]
- 25.Ostuni R, et al. Latent enhancers activated by stimulation in differentiated cells. Cell. 2013;152:157–171. doi: 10.1016/j.cell.2012.12.018. [DOI] [PubMed] [Google Scholar]
- 26.Huang M, et al. Chromatin-remodelling factor BRG1 selectively activates a subset of interferon-alpha-inducible genes. Nat Cell Biol. 2002;4:774–781. doi: 10.1038/ncb855. [DOI] [PubMed] [Google Scholar]
- 27.Ni Z, et al. Apical role for BRG1 in cytokine-induced promoter assembly. Proc Natl Acad Sci U S A. 2005;102:14611–14616. doi: 10.1073/pnas.0503070102. [DOI] [PMC free article] [PubMed] [Google Scholar]
- 28.Levy MM, et al. SCCM/ESICM/ACCP/ATS/SIS International Sepsis Definitions Conference. Intensive Care Med. 2001;29:530–538. doi: 10.1007/s00134-003-1662-x. 2003. [DOI] [PubMed] [Google Scholar]
- 29.Kadoch C, et al. Proteomic and bioinformatic analysis of mammalian SWI/SNF complexes identifies extensive roles in human malignancy. Nat Genet. 2013;45:592–601. doi: 10.1038/ng.2628. [DOI] [PMC free article] [PubMed] [Google Scholar]
- 30.Bultman S, et al. A Brg1 null mutation in the mouse reveals functional differences among mammalian SWI/SNF complexes. Mol Cell. 2000;6:1287–1295. doi: 10.1016/s1097-2765(00)00127-1. [DOI] [PubMed] [Google Scholar]
- 31.Cheng SC, et al. Broad defects in the energy metabolism of leukocytes underlie immunoparalysis in sepsis. Nat Immunol. 2016;17:406–413. doi: 10.1038/ni.3398. [DOI] [PubMed] [Google Scholar]
- 32.Leentjens J, et al. Reversal of immunoparalysis in humans in vivo: a double-blind, placebo-controlled, randomized pilot study. Am J Respir Crit Care Med. 2012;186:838–845. doi: 10.1164/rccm.201204-0645OC. [DOI] [PubMed] [Google Scholar]
- 33.Docke WD, et al. Monocyte deactivation in septic patients: restoration by IFN-gamma treatment. Nat Med. 1997;3:678–681. doi: 10.1038/nm0697-678. [DOI] [PubMed] [Google Scholar]
- 34.Roberson SM, Walker WS. Immortalization of cloned mouse splenic macrophages with a retrovirus containing the v-raf/mil and v-myc oncogenes. Cell Immunol. 1988;116:341–351. doi: 10.1016/0008-8749(88)90236-5. [DOI] [PubMed] [Google Scholar]
- 35.Kertesz M, Iovino N, Unnerstall U, Gaul U, Segal E. The role of site accessibility in microRNA target recognition. Nat Genet. 2007;39:1278–1284. doi: 10.1038/ng2135. [DOI] [PubMed] [Google Scholar]
- 36.Griffiths-Jones S, Grocock RJ, van Dongen S, Bateman A, Enright AJ. miRBase: microRNA sequences, targets and gene nomenclature. Nucleic Acids Res. 2006;34:D140–144. doi: 10.1093/nar/gkj112. [DOI] [PMC free article] [PubMed] [Google Scholar]
- 37.Ran FA, et al. Genome engineering using the CRISPR-Cas9 system. Nat Protoc. 2013;8:2281–2308. doi: 10.1038/nprot.2013.143. [DOI] [PMC free article] [PubMed] [Google Scholar]
- 38.Afgan E, et al. The Galaxy platform for accessible, reproducible and collaborative biomedical analyses: 2016 update. Nucleic Acids Res. 2016;44:W3–W10. doi: 10.1093/nar/gkw343. [DOI] [PMC free article] [PubMed] [Google Scholar]
- 39.Bone RC, et al. Definitions for sepsis and organ failure and guidelines for the use of innovative therapies in sepsis. The ACCP/SCCM Consensus Conference Committee. American College of Chest Physicians/Society of Critical Care Medicine. Chest. 1992;101:1644–1655. doi: 10.1378/chest.101.6.1644. [DOI] [PubMed] [Google Scholar]
- 40.Moreau R, et al. Acute-on-chronic liver failure is a distinct syndrome that develops in patients with acute decompensation of cirrhosis. Gastroenterology. 2013;144:1426–1437. 1437 e1421–1429. doi: 10.1053/j.gastro.2013.02.042. [DOI] [PubMed] [Google Scholar]
- 41.Zambelli F, Pesole G, Pavesi G. Pscan: finding over-represented transcription factor binding site motifs in sequences from co-regulated or co-expressed genes. Nucleic Acids Res. 2009;37:W247–252. doi: 10.1093/nar/gkp464. [DOI] [PMC free article] [PubMed] [Google Scholar]
- 42.Rao P, et al. IkappaBbeta acts to inhibit and activate gene expression during the inflammatory response. Nature. 2010;466:1115–1119. doi: 10.1038/nature09283. [DOI] [PMC free article] [PubMed] [Google Scholar]
Associated Data
This section collects any data citations, data availability statements, or supplementary materials included in this article.
Data Availability Statement
RNA-sequencing data that support the findings of this study have been deposited in GEO with the accession code GSE89918 (https://www.ncbi.nlm.nih.gov/geo/).