Abstract
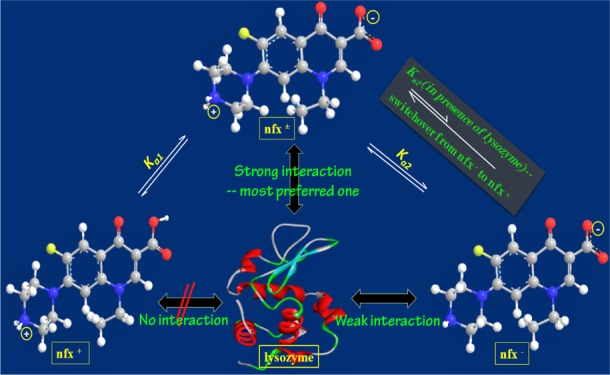
Herein, we report a comprehensive study on the interaction of three protomeric forms of the antibacterial drug norfloxacin (nfx) with the enzymatic protein human lysozyme (lyz). Norfloxacin, having the option for two-stage acid–base equilibria, converts from cationic (nfx+) to zwitterionic (nfx±) form, followed by an anionic (nfx–) species, with increasing pH. Among these protomeric forms, lysozyme binds nfx± most robustly, whereas nfx– has a weak association and nfx+ does not show any interaction. In lysozyme, the location of the drug was ascertained by competitive binding assay with 8-anilino-1-naphthalenesulfonate, and this was further examined with molecular docking simulation. The binding process was found to be primarily governed by hydrogen bonding and van der Waals interactions. The study has further revealed that preferential binding of nfx± by the protein over nfx– led to a switchover of nfx– to nfx±; and the resulting increased population of nfx± over the other is beneficial for the pharmacological activity of the drug in terms of its accumulation in the target bacterial cells. The present study accomplishes two important objectives. It holds significance regarding the differential interaction of multiprotomeric drugs with biomolecules, such as proteins, enzymes, lipid membranes, etc., and also on such biomolecule-assisted alteration of the acid–base equilibrium and consequent bioavailability of the drug. The findings are useful from the viewpoints of dispensation, distribution, and metabolism of any prototropic drug in living systems as they encounter several biomolecules in vivo. Another importance of this work stems from the study of comparative binding responses of lysozyme toward a drug existing in multiple forms depending on its protonation states or some other chemical processes.
1. Introduction
Norfloxacin (nfx), a fluoroquinolone class of drug, displays a wide range of antibacterial activity on both gram positive and gram negative bacteria by inhibiting the DNA synthesis and promoting cleavage of bacterial DNA in the DNA–enzyme complexes of DNA gyrase and type IV topoisomerase, and hence resulting in rapid bacterial death.1 It is widely used to treat several diseases like skin infection, urinary tract infection, prostatitis, sexually transmitted diseases, gastroenteritis, and some skin and soft tissue infections.1−4 Quinolone drugs get widely distributed throughout the body. Their penetration into prostatic fluid, saliva, bone, and cerebrospinal fluid is also good enough.5 Norfloxacin, having two acid–base equilibria, exhibits three prototropic forms depending on the pH of the immediate environment. In the case of such prototropic drugs, some specific ionized form of the molecule is very important for its action. It is known that the zwitterionic form of norfloxacin crosses the gastrointestinal and other lipid membranes by passive diffusion, presenting themselves as neutral molecules in antiparallely stacked arrangements.6 The interaction of drug molecules with relevant biomolecules like a protein has always been of great importance in the dynamic research discipline, specifically in dealing with important issues like drug dispensation, free concentration, pharmacokinetics, and metabolism of a drug in the blood stream. Fluoroquinolones being a crucial class of antibacterial drugs, their interaction with biological or biomimicking targets is an important issue relating to their mechanism of action in the animal body system. There are reports on the interaction of the norfloxacin with biomolecules like protein, DNA, and biomimicking agents like cell-membrane-mimicking liposomes and differently charged micelles.7−12 The reports on the interaction of norfloxacin with biomolecules are mostly focused on the binding of the drug molecule at physiological pH condition only (where it exists predominantly as a zwitterionic form). A recent study performed on the interaction of nfx with human serum albumin at physiological pH (only zwitterionic form of nfx was focused upon) shows that the drug undergoes a zwitterionic to cationic transformation.10 Here, we have explored a long acidic to alkaline pH range in obtaining a comprehensive idea on the interaction of all the three protomeric states of norfloxacin with lysozyme (lyz). Analyzing the spectral behavior of the drug in the presence of lyz, we also scrutinized if the acid–base equilibrium of the drug has been altered while interacting with the concerned protein. In the following section, we have briefly discussed the importance of lysozyme and the relevance of choosing the same as the host biomolecule for our present study.
Lysozyme, being an antimicrobial enzyme, is a part of the animal innate immune system and is found in various tissues and in some protecting secretions like tears, saliva, mucus, milk, etc. The enzymatic protein acts by damaging the bacterial cell walls via cleavage of the β-glycosidic linkage between N-acetylmuramic acid and N-acetylglucosamine in peptidoglycan and thereby protecting against bacterial infections.13,14 It is a single-chain globular protein consisting of 130 amino acid residues. The active site of the protein has a crevice that separates the protein into two domains connected by an α-helix.13 One domain consists mostly of β-sheet conformations (40–80 amino acids), whereas the other domain (89–99 amino acids) is more α-helical in nature.15 Lysozyme has widely been chosen as a model protein to study and understand folding and dynamics, structure–function relationships, and ligand–protein interactions due to its small size, high stability, and natural abundance.16,17 It is well known for its capability to reversibly bind a number of endogenous and exogenous compounds, including some important drug molecules.18 Regarding the drug binding properties of any biomolecule, it is an important aspect to know its binding selectivity when more than one species of a drug molecule are present there. In connection with the binding preference between two protomeric species of a particular ligand by the very well known carrier protein serum albumins, it has been extensively found that serum proteins have an inclination toward anionic or neutral species over their corresponding neutral or cationic protomers, respectively.19,20 There are very few reports where a comparison of the binding of the individual protomers of a ligand with lysozyme has been documented. Those studies were performed with drug molecules (all having pKa > 7) showing only one acid–base equilibrium with positively charged acid forms and neutral conjugate basic protomers.21 The common finding was that lysozyme has comparatively strong binding interaction with the neutral protomer over the cationic one. In our study, we have chosen the drug norfloxacin having three prototropic forms, namely, cationic, zwitterionic (neutral as a whole), and anionic. We intend to investigate a comparative binding when lysozyme is encountered by the three individual protomeric species of the guest drug, which are highly probable of interacting with the enzymatic protein in the blood stream as well as several tissues and other body fluids.
To get a detailed scenario regarding the individual binding affinity of the three prototropic forms of nfx with lysozyme as well as any effect of protein binding on the acid–base property of the drug, a dual-sided approach via monitoring of the fluorescence emission of the protein as well as of the drug were arranged separately. Synchronous fluorescence spectra (SFS) of the protein and the steady-state fluorescence anisotropy of the drug molecule were also probed, and the results are in good agreement with the fluorescence quenching result of lyz. Binding thermodynamics of the most preferred protomer of nfx with lysozyme was explored by the fluorimetric temperature variation method via the van’t Hoff equation. A most probable binding location of the drug inside the protein scaffold was modeled by a molecular blind-docking simulation. The result obtained from the docking simulation in terms of intermolecular energy also corroborates nicely with the experimental results.
2. Results and Discussion
2.1. pH-Dependent Spectral Features of Norfloxacin
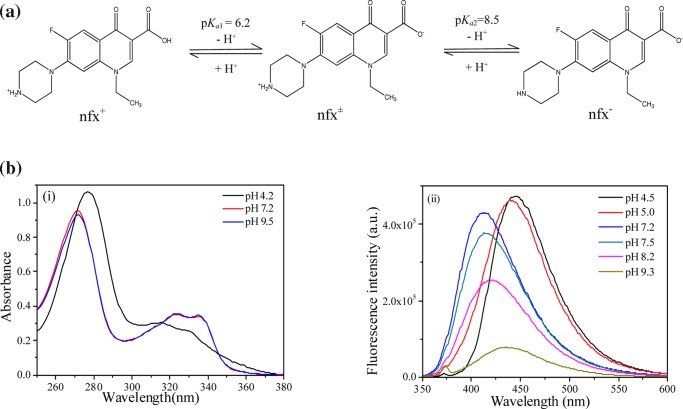
Norfloxacin exhibits acid–base equilibria in aqueous medium involving three protomeric forms in a pH range ∼5–9.2. It has two acid dissociation constants in aqueous medium and the corresponding pKa values are pKa1 = 6.2 and pKa2 = 8.5. When pH is below pKa1, it exists predominantly as a cationic form (nfx+) protonated at the piperzinyl nitrogen, and above pKa1, the deprotonation from the carboxylic group produces a zwitterionic form (nfx±). Further above pKa2, the anionic form (nfx–) arising out of deprotonation at both piperzinyl and carboxylic moiety prevails (Figure 1a). The representative pH-dependent absorbance and emission spectral profile of nfx at some selected pH is highlighted in Figure 1b. nfx+ shows a strong absorption peak at ∼276 nm along with two subpeaks at ∼316 and ∼330 nm. The other two forms, nfx± and nfx– have identical absorbance spectral profiles showing the strong absorption peak at ∼271 nm along with the two other subpeak positions at ∼322 and ∼335 nm. nfx+ has fluorescence emission maxima positioned at ∼442 nm. With increase in pH, the emission maxima shift toward shorter wavelength accompanied by a little decrease in the fluorescence intensity. The nfx±-form shows emission maxima at ∼414 nm. Then, with increasing pH, nfx± converts to nfx– with substantial lowering in emission intensity, along with a red shift in the emission maxima (emission maxima of nfx– comes at ∼435 nm, at pH 9.2), and beyond pH 10 the species becomes practically nonfluorescent.
Figure 1.
(a) Protonation–deprotonation equilibria of norfloxacin. (b) (i) Absorbance spectra and (ii) fluorescence emission spectra of norfloxacin in aqueous media at the indicated pH. λexc = 331 nm.
2.2. Fluorescence Emission Spectral Modulation of Norfloxacin in the Presence of Lysozyme
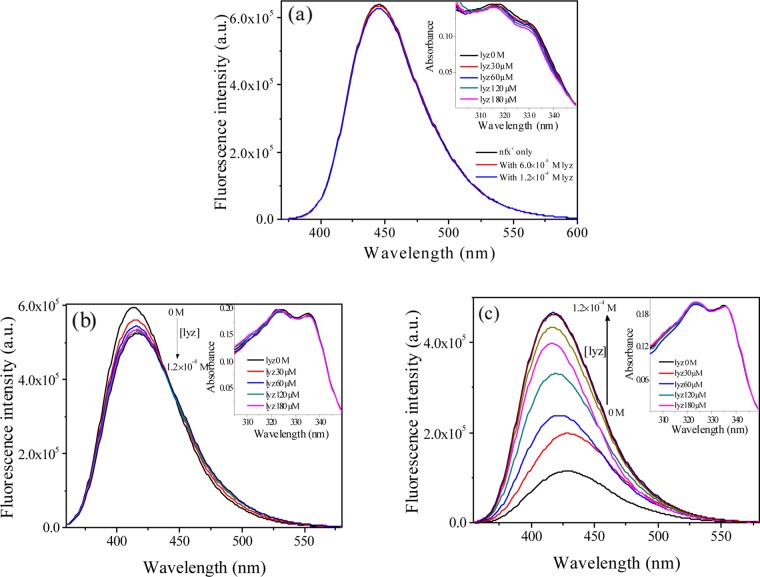
Monitoring of fluorescence emission spectra is a widely used tool to explore the protein–ligand interaction process. For our protein–ligand pair, the protein lyz and the drug nfx both are fluorescent. Here, we utilized fluorescence spectral properties of both the drug and the protein individually to obtain detailed information on the interaction process. In this section, we will discuss the emission spectral response of nfx to understand the behavior of the three distinct protomers of nfx in the presence of lysozyme. Emissions were measured at three selected pHs: 4.2, 7.2, and 9.2, where nfx exists predominantly as nfx+, nfx±, and nfx–, respectively. There was no alteration in the emission spectra of nfx+ (Figure 2a) in the presence of lyz, indicating no substantial interaction of this cationic form with the protein. This seems reasonable as lyz has net positive charge (as the isoelectric point of lyz is ∼11.35) at this acidic pH (4.2); hence, the positively charged cationic drug molecule is improbable of binding to the protein. On the other hand, the addition of lysozyme to nfx± (at pH 7.2, having emission peak λmax = 413 nm) resulted in a slight decrease in emission intensity, along with an isoemissive point near ∼440 nm, and a ∼4 nm red shift of the emission maxima (Figure 2b). Several models could be postulated to account for this observation at pH 7.2. One could be due to a switchover of nfx± to nfx+, as the cationic form has an emission maxima that is red-shifted compared to nfx± itself. Another possibility is a switchover of nfx± to nfx– with weaker emission in the red side of the spectrum. Otherwise, it might be due to a binding interaction of nfx± with the protein. The first possibility could be discarded as nfx+ has a stronger emission intensity compared to nfx±, whereas here, we see a little quenching in nfx± emission upon lyz addition. Moreover, from our earlier fluorescence emission spectral measurements, it is observed that the protein does not show any perceptible binding interaction toward nfx+. Fluorescence excitation and UV–vis spectral study also supported that as there was no alteration in the absorbance spectrum of nfx± (inset of Figure 2b). The second possibility (transformation of nfx± to nfx–) is also quite unlikely if we look into the pH-dependent emission spectra of nfx. In the aqueous medium, nfx (Figure 1b) does not show any isoemissive point, which should have been present as a characteristic during the transition from nfx± to nfx–. Absorbance spectra/excitation spectra or fluorescence lifetime data cannot be helpful for this case, as both these forms (nfx± or nfx–) have very similar spectral characteristics. The other possibility is that there might be a binding interaction with lyz, resulting in quenching of fluorescence of the drug. In that case, the appearance of the isoemissive point near 440 nm may arise out of equilibrium between the protein-bound and unbound forms of nfx±. Although the observation of a little quenching of emission intensity in the presence of protein is somewhat unusual, as in most of the cases, fluorescence enhancement of a ligand inside a protein is a familiar phenomenon,22,23 but there are instances where quenching rather than fluorescence enhancement has been reported, and those were attributed to be due to the operation of some hydrogen-bonding interaction or some nonspecific interaction within the host molecule.19,20,24 The emission of nfx– (at pH 9.2) was also studied upon lyz addition (Figure 2c).
Figure 2.
Fluorescence emission spectra of (a) nfx+ (at pH 4.2), (b) nfx± (at pH 7.2), and (c) nfx– (at pH 9.2) in presence of different lysozyme concentrations at 298 K. λexc = 331 nm. The corresponding absorption spectra are presented as inset figures. (The data shown here are difference absorption spectra obtained after subtracting the absorption spectral profile of lysozyme solution.)
The initial weak intensity emission of the anionic protomer progressively becomes intensified accompanied by a shift of the emission maxima from ∼430 to ∼417 nm upon addition of lyz. Again, two possibilities may be suggested for such fluorescence enhancement and blue shifting of emission maxima of nfx– with increasing lyz concentration. It might be due to the incorporation of nfx– in lyz because of strong binding interaction, as inside the protein pocket fluorescence enhancement and blue shift of emission spectrum are usual phenomena. The other possibility is a prototropic switchover from nfx– to nfx±, as the enhanced emission intensity as well as the emission maxima (changes from 430 to 417 nm) at highest lyz concentration are exactly similar to that of the nfx± form. Moreover, the fluorescence spectral pattern, with increasing lyz concentration, is also similar to that of the pH-dependent emission profile of nfx during conversion of nfx– to nfx± in neat aqueous media. Again, in this case also, the absorbance spectra or fluorescence lifetime decay data cannot provide any conclusion due to identical spectral features. The absorbance spectra of the three different forms of nfx in the presence of lysozyme have been shown in the insets of Figure 2. Because of the strong interference of lysozyme in the shorter wavelength region, the absorbance spectra are shown here in the longer wavelength region only. At this stage, to get a clear picture, an approach from the other side was adopted, where the fluorescence-quenching experiment of lysozyme in the presence of nfx was monitored at pHs 7.2 and 9.2 to explore the absolute binding efficacy of nfx± or nfx– with the protein. This information will also provide an idea if any of these two protomeric forms is getting converted to the other having a relatively higher binding affinity with lysozyme. In this counter study, utilizing the protein’s intrinsic fluorescence at those two pH, the two protomeric forms of the drug will be entirely in their respective protonation states (i.e., no possibility of prototropic switchover), as the concentration of lyz will be kept fixed there and the concentration of the drug will be altered.
2.3. Quenching of Lysozyme Fluorescence in the Presence of Norfloxacin
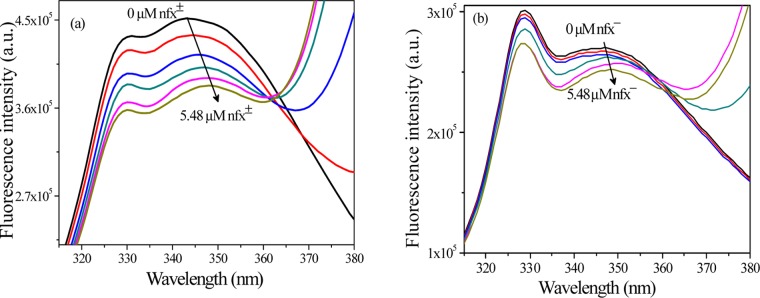
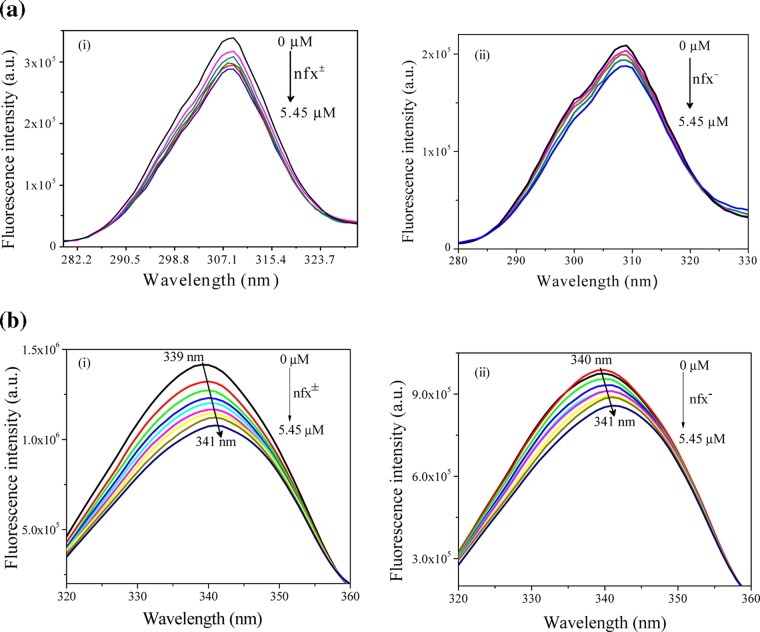
The intrinsic fluorophores inside protein are sensitive to their immediate microenvironment. So, any exogenous ligand-induced perturbation of the microenvironment leads to an alteration of the emission characteristics of the fluorophores. To get insight into the interaction of norfloxacin (nfx± and nfx–) with lysozyme, intrinsic tryptophan fluorescence of the protein was investigated at pHs 7.2 and 9.2 in the presence of the drug (Figure 3a,b, respectively). As evident from the previous section that the cationic form of the drug does not interact with the protein, the quenching study of lysozyme in the presence of nfx+ was not attempted. Before working with the tryptophan fluorescence of the protein in a range of pH, it is important to check if there is any conformational alteration of the protein with pH. Employing optical rotation measurements, previous studies in the literature have already shown that in the pH range (∼4 to ∼9) that we worked in, the conformation of lysozyme remains practically unaltered.21,25 Although this was investigated with the chicken egg variety of lysozyme, the behavior of the human lysozyme should be very similar to it, as both of them share a high percentage of sequence homology. Hence, the human variety of lysozyme is expected to have a very similar secondary structure.26 In this study also, the ellipticity values, as obtained from circular dichroism (CD) spectral data, show that there is hardly any conformational alteration with the change of pH (ellipticity values obtained at the two pHs 7.2 and 9.2 are 19.82 and 19.56 mdeg, respectively). On the other hand, we observed some variation in fluorescence spectra of lysozyme in the concerned pH range (Figure 4). In the human lysozyme, Trp64 and Trp109 are the most dominant contributors toward its overall tryptophan fluorescence.27 This figure shows that the two characteristic parameters, emission intensity and emission maxima of spectra, are nearly same in the pH range ∼4.4 to ∼8.0, whereas the emission intensity is quenched to some extent and the emission maxima is shifted toward longer wavelength by ∼3 nm (from ∼342 to ∼345 nm) on moving to pH 9.2. This spectral change at the alkaline pH well complements the previously reported studies,26 which accounted that the quenching and spectral shifts occur due to the ionization of the nearby tyrosine residue (Tyr63). Hence, it could be inferred that depending on the pH, there are changes in the ionization state of the amino acid side chains, which is reflected in the emission spectra of the intrinsic tryptophan fluorophores, whereas the conformation of the protein remains unaltered. Now, we discuss the exogenous ligand-induced (here, drug nfx) perturbation of lyz intrinsic fluorescence. The changes in the microenvironment around tryptophan due to ligand interaction may lead to alteration in its fluorescence spectral profile depending on the nature and strength of ligand binding. Here, nfx± and nfx– concentrations were varied keeping lyz concentration at 1.0 μM. Upon addition of nfx, it was found that both nfx± and nfx– have quenched the emission of lyz but the extent of quenching was different for the two forms.
Figure 3.
Fluorescence spectra of lyz (1 μM) upon addition of (a) nfx± (at pH 7.2) and (b) nfx– (at pH 9.2) at 298 K. λexc = 295 nm. Norfloxacin concentration was varied from 0 M to 5.48 μM (in figure: 0, 1, 2, 3, 4, 5.48 μM) for both of the cases. All data are not presented in the figure for clarity.
Figure 4.
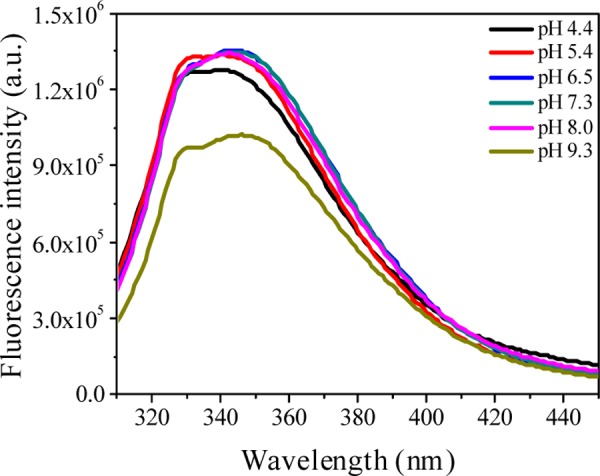
Fluorescence emission spectra of lysozyme as a function of pH.
In the presence of nfx±, a red shift of 5 nm (from 342 to 347 nm, at maximum added nfx± concentration) in the emission maxima of lyz was observed, whereas in the presence of nfx–, a red shift by 2 nm (emission maxima shifts from 346 to 348 nm, at maximum added nfx– concentration) was observed. The greater shifting of the emission maxima of lyz in presence of nfx± compared to that of nfx– indicates that the microenvironment of the lyz fluorophore (internal tryptophan) gets altered to a greater extent while interacting with nfx± than with nfx–. The extent of fluorescence quenching, which helps in estimating the interaction affinity of ligand with protein, is quantified by the well-known Stern–Volmer equation (eq 1)28
| 1 |
where F0 and F are the fluorescence intensities at emission maxima (here at λmax = 342 nm) without the quencher and in presence of different quencher concentrations ([Q]); kq, KSV, and ⟨τ⟩0 are the bimolecular quenching rate constant, the Stern–Volmer quenching constant, and average fluorescence lifetime of the fluorophore in the absence of any quencher, respectively. The representative Stern–Volmer plots at both the pHs 7.2 and 9.2 are provided in Figure 5. A very small quenching of the protein fluorescence for nfx– suggests a weak binding interaction between these two. The kq and KSV values obtained from the linear plots are shown in Table 1. The KSV estimated for both nfx± and nfx– binding to lyz clearly indicates that nfx± has a substantially stronger binding affinity for lysozyme (KSV is ∼2.5 times greater for nfx± compared to nfx–).
Figure 5.
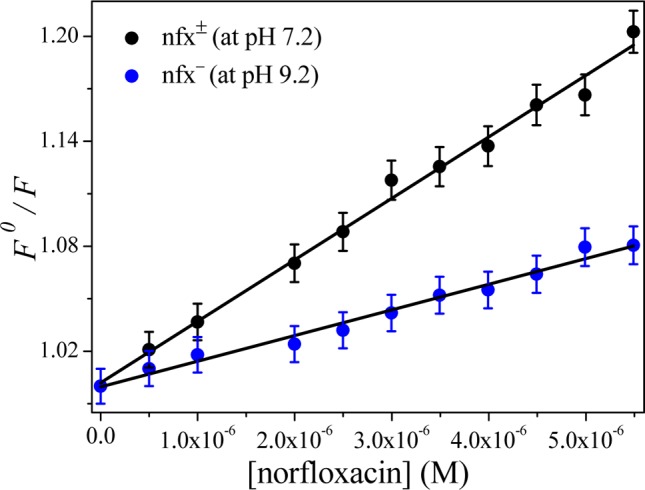
The Stern–Volmer plot for fluorescence quenching of lysozyme in the presence of nfx± (at pH 7.2) and nfx– (at pH 9.2) at 298 K.
Table 1. Fluorescence Quenching Data and Binding Parameters of nfx± (at pH 7.2) or nfx– (at pH 9.2) with Lysozyme at 298 K.
| system | KSV (L mol–1) | kq (L mol–1 s–1) | K (mol L–1) | n | ΔG° (kJ mol–1 K–1) |
|---|---|---|---|---|---|
| nfx±–lyz | (3.5 ± 0.03) × 104 | (4.08 ± 0.03) × 1013 | (1.73 ± 0.1) × 104 | (0.94 ± 0.02) | –24.18 |
| nfx––lyz | (1.4 ± 0.07) × 104 | (1.91 ± 0.07) × 1013 | (2.40 ± 0.3) × 103 | (0.86 ± 0.02) | –19.28 |
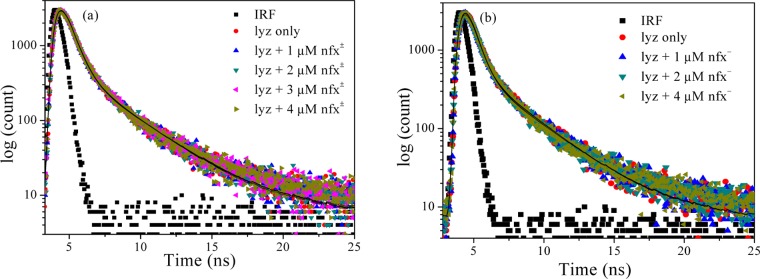
The linear nature of quenching with quencher concentration may arise due to the involvement of either static quenching or dynamic quenching mechanisms. Static quenching occurs when there is ground state dark complex formation between the fluorophore and the quencher, whereas dynamic or collisional quenching arises due to collision between the excited fluorophore and the ground state quencher.28 To explore the quenching mechanism operating in the present case, time-resolved fluorescence decay analysis was performed for lyz fluorescence in the absence and presence of the drug molecule, and the decay profiles are displayed in Figure 6. The corresponding decay parameters are shown in Table 2. The operation of the dynamic quenching mechanism should lower the average lifetime of the fluorophore with increasing quencher concentration, showing an increase of ⟨τ⟩0/⟨τ⟩q (⟨τ⟩q is the average lifetime of fluorophore at any quencher concentration, [Q]). On the other hand, the static quenching will keep ⟨τ⟩0/⟨τ⟩q nearly constant with the quencher concentration, as ⟨τ⟩q will hardly alter. The lifetime parameters listed in Table 2 show that there is almost no alteration in the average lifetime of lyz (at both the pH), and the individual decay components are also practically unchanged with the drug concentration. Hence, it can be inferred that the observed fluorescence quenching of lyz upon norfloxacin addition is static in nature, forming a ground state complex. Moreover, the bimolecular quenching rate constants, kq (= KSV/⟨τ⟩0; ⟨τ⟩0 of lyz obtained ∼0.860 ns) obtained from the Stern–Volmer plot (Table 1 and Figure 5) are in the order of ∼1013 M–1 s–1, and these are much higher than typical diffusion-controlled quenching rate constants29 observed (in the order of ∼1010 M–1 s–1) at room temperature in fluids. Hence, these findings also nullify the possibility of dynamic quenching.
Figure 6.
Fluorescence emission decay of lysozyme in presence of (a) nfx± (at pH 7.2) and (b) nfx– (at pH 9.2).
Table 2. Time-Resolved Emission Decay Parameters of lyz in the Absence and Presence of nfx± (at pH 7.2) or nfx– (at pH 9.2) at 298 Ka,b.
| system | [nfx±] or [nfx–] (μM) | τ1 (ns) | τ2 (ns) | α1 | α2 | ⟨τ⟩ (ns) | ⟨τ⟩0/⟨τ⟩q |
|---|---|---|---|---|---|---|---|
| nfx±–lyz | 0 | 0.599 | 3.22 | 0.90 | 0.10 | 0.861 | |
| 1 | 0.589 | 3.19 | 0.90 | 0.10 | 0.849 | 1.01 | |
| 2 | 0.605 | 3.16 | 0.90 | 0.10 | 0.860 | 1.00 | |
| 4 | 0.602 | 3.20 | 0.90 | 0.10 | 0.862 | 0.99 | |
| nfx––lyz | 0 | 0.505 | 3.03 | 0.90 | 0.10 | 0.756 | |
| 1 | 0.510 | 3.05 | 0.90 | 0.10 | 0.764 | 0.99 | |
| 2 | 0.508 | 3.06 | 0.90 | 0.10 | 0.763 | 0.99 | |
| 4 | 0.508 | 3.13 | 0.91 | 0.09 | 0.744 | 1.01 |
[lyz] = 1 μM.
Error in measuring/fitting of lifetime parameters is ∼5%.
2.4. Evaluation of Binding Parameters
To obtain a quantitative account on the binding interaction of nfx± or nfx– with the protein, the binding constants (K) as well as ΔG° values were estimated. Using fluorescence quenching data, eq 2 was employed30,31
| 2 |
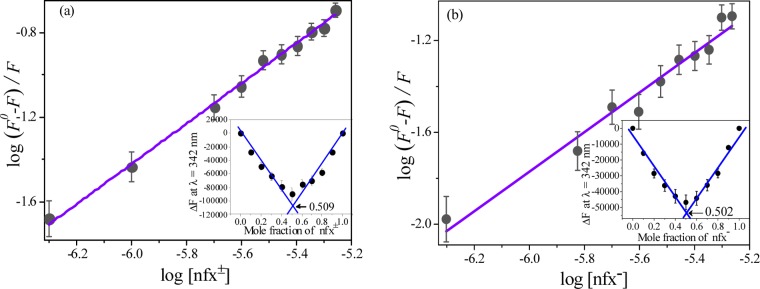
which yields binding constant (K) and number of binding sites (n) in cases that involve small molecules binding independently to a set of identical sites on a macromolecule.30,32 Representative plots using the eq 2 are shown in Figure 7a,b.
Figure 7.
Double logarithm plots for estimation of binding constants for complexation of (a) nfx±–lyz (at pH 7.2) and (b) nfx––lyz (at pH 9.2) at 298 K.
The binding parameters at 25 °C at both the pH are tabulated in Table 1. The linear nature of the plots gives the “n” values that are nearly “1” for both the cases, and it is the indicative of the involvement of one site binding and hence a 1:1 stoichiometry. Binding stoichiometry was also evaluated from the Job’s method33 of continuous variation (inset of Figure 7) which also supports the previously mentioned ∼1:1 stoichiometry. The higher magnitude of the binding constant (K) obtained for nfx± compared to that of nfx– clearly shows much stronger binding interaction in the case of nfx±. Consequently, the standard free energy change (ΔG°) is also higher in the case of nfx± (Table 1).
2.5. Synchronous Fluorescence Spectra of Lysozyme in the Presence of nfx± and nfx–
Synchronous fluorescence spectroscopy involves simultaneous scanning of the excitation and emission monochromators while maintaining a constant wavelength interval (Δλ).33 It can provide information about the change of molecular microenvironment in the vicinity of chromophores by measuring the shift in the emission maxima (λmax sfs), which depends on the change in the polarity around the chromophore microenvironment. Keeping Δλ at 15 and 60 nm, SFS can provide the characteristic information of amino acid residues tyrosine or tryptophan, respectively, inside protein environment. In this case, at Δλ = 15 nm, no perceptible shift in λmax sfs of lyz was observed in presence of both nfx± or nfx– (Figure 8a). Setting Δλ = 60 nm, addition of nfx± (at pH 7.2) to lysozyme results in a shifting of the λmax sfs by ∼2 nm to longer wavelength along with quenching of emission, whereas addition of nfx– (at pH 9.2) causes ∼1 nm shift in λmax sfs to the longer wavelength along with smaller quenching (Figure 8b). This observation is in accordance with the previous finding that lysozyme binds nfx± more strongly than nfx–, experiencing a bit more alteration in the microenvironment around the fluorophore. These red shifts in λmax sfs suggest that polarity around the tryptophan fluorophore has changed and it is experiencing a little more polar environment due to binding of the drug.
Figure 8.
(a) Synchronous fluorescence spectra of lysozyme at Δλ = 15 nm in the presence of (i) nfx± (at pH 7.2) and (ii) nfx– (at pH 9.2) at 298 K. (b) Synchronous fluorescence spectra of lysozyme at Δλ = 60 nm in the presence of (i) nfx± (at pH 7.2) and (ii) nfx– (at pH 9.2) at 298 K.
2.6. Steady-State Anisotropy of nfx± and nfx– in the Presence of Lysozyme
Steady-state fluorescence anisotropy measurements provide idea about the rotational restriction arising due to the rigidity of the surroundings of a fluorophore. Anisotropy (r) of both nfx± and nfx– were found to increase gradually with lyz concentration followed by saturation (Figure 9). Hence, for the bound drug molecule, lysozyme renders a motional restriction due to local environmental rigidity in the protein scaffold compared to that in bulk aqueous medium. The increase in the anisotropy (r), that is, increase in motional restriction of nfx± with increasing lyz concentration is higher than that of nfx–. Therefore, these results from steady-state anisotropy studies also suggest the stronger binding ability of lyz toward nfx±, corroborating the findings of fluorescence quenching data of lysozyme.
Figure 9.
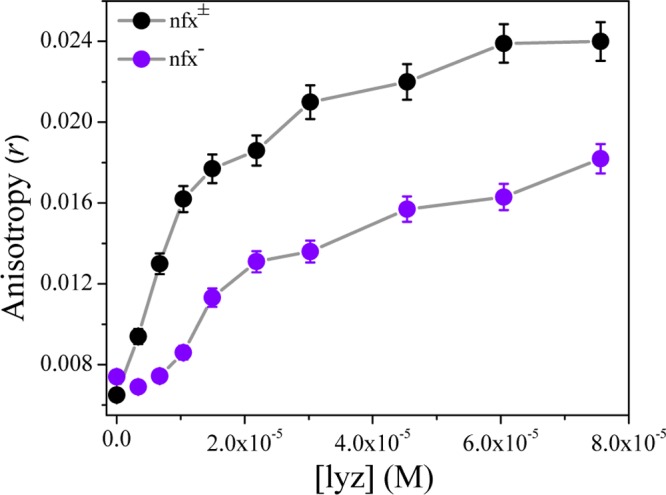
Variation of steady-state anisotropy of nfx± (at pH 7.2) and nfx– (at pH 9.2) in increasing lysozyme concentration, at 298 K. λexc = 331 nm and λem = 414 nm (for nfx±) and λem = 435 nm (for nfx–), at 298 K.
2.7. Thermodynamic Parameters of nfx± Binding to Lysozyme
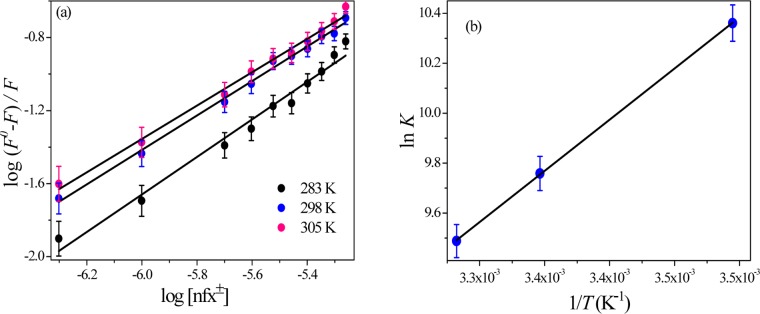
The thermodynamic parameters involved in the interaction of small organic molecules with biological macromolecule provide a simple way to get information about the nature of binding forces involved in the interaction process. Generally, the interaction forces between drug molecules and biomolecules are governed by electrostatic force, hydrogen bonding, van der Waals interaction, and hydrophobic interaction within the binding site.34 As in our case, the nfx±-form has the strongest binding with lysozyme, we opted for the determination of thermodynamic parameters for nfx±-lyz association by monitoring lyz fluorescence quenching by nfx± at three different temperatures. The thermodynamic analysis was avoided for nfx– as the binding efficacy was very weak, leading to a negligible quenching of emission of lyz, and this can indeed furnish erroneous results in a fluorescence-based temperature variation study. Assuming the standard enthalpy change (ΔH°) as almost unchanged in the studied temperature range, standard enthalpy change (ΔH°) and standard entropy change (ΔS°) could be estimated from the van’t Hoff equation (eq 3)34
| 3 |
where “K” is the binding constant at any particular temperature T, “R” is the universal gas constant. A representative double logarithm plot for binding constant estimations (using eq 2) at three different temperatures is shown in Figure 10a. The respective binding constants are tabulated in Table 3. The representative van’t Hoff plot using the eq 3 is displayed in Figure 10b. Next, by using the obtained ΔH° and ΔS°, the standard free energy change (ΔG°) of the interaction process was estimated with the eq 4
| 4 |
ΔG° along with ΔH° and ΔS° are also listed in Table 3.
Figure 10.
(a) Representative double logarithmic plot for binding constant estimation for nfx±–lyz association at three different temperatures and (b) the van’t Hoff plot for nfx±–lyz association.
Table 3. Thermodynamic Parameters of the nfx±–lyz Association Process (at pH 7.2).
| temperature (K) | K (mol L–1) | n | ΔH° (kJ mol–1) | ΔS° (J mol–1) | ΔG° (kJ mol–1 K–1) |
|---|---|---|---|---|---|
| 283 | (3.16 ± 0.2) × 104 | (1.02 ± 0.02) | –28.42 | –14.21 | –24.39 |
| 298 | (1.73 ± 0.1) × 104 | (0.94 ± 0.02) | –24.18 | ||
| 305 | (1.32 ± 0.1) × 104 | (0.92 ± 0.02) | –24.08 |
Ross and Subramanian have pointed out that the nature of interaction taking place in protein–ligand association processes could be determined from the sign and magnitude of thermodynamic parameters, and this is briefly summarized as:34 (i) ΔH° > 0 and ΔS° > 0 corresponds to hydrophobic force; (ii) ΔH° < 0 and ΔS0 < 0 corresponds to van der Waals interaction and hydrogen bonding; (iii) ΔH° < 0 and ΔS° > 0 corresponds to electrostatic interaction. The thermodynamic parameters presented in Table 3 show that both ΔH° and ΔS° are negative in the present case. The negative sign of ΔH° may arise if electrostatic interaction forces or hydrogen-bond interaction, van der Waals interaction forces are in operation. But here, ΔS° also being negative suggests major involvement of hydrogen-bond and van der Waals interaction forces in the association process of the drug with lysozyme. Considering the molecular structure of norfloxacin in its zwitterionic form, the positively charged −NH2 group with the hydrogens, one carboxylate group, and the carbonyl oxygen atom can participate in hydrogen-bonding interactions with the nearby amino acid residues of lysozyme. Although the major governing forces are van der Waals, and hydrogen-bonding interactions in the concerned binding process, the operation of electrostatic interaction is also expected to take place through the carboxylate moieties of nfx (for both the protomers) with the positively charged amino acid side chains of the protein, and via the positively charged piperzinyl moiety of nfx± with the negatively charged side chains of amino residues of lyz.
2.8. Circular Dichroism Spectra of Lysozyme in the Presence of nfx± or nfx–
The circular dichroism (CD) spectral study of a protein informs about its secondary structure. CD spectra of lysozyme have two negative peaks at 208 and 222 nm characteristics of n→π* transition in amide bond of α-helix.35 CD data is presented in terms of mean residual ellipticity (MRE) in deg cm2 dmol–1, according to eq 5,36 where “θ” is the observed ellipticity in mdegree, l is the path length of the cell, cp is molar concentration of the protein, and nr is the number of amino acid residues in the protein.
| 5 |
Then, the α-helix content of lyz is calculated from the MRE value at 208 nm, using eq 6.37
| 6 |
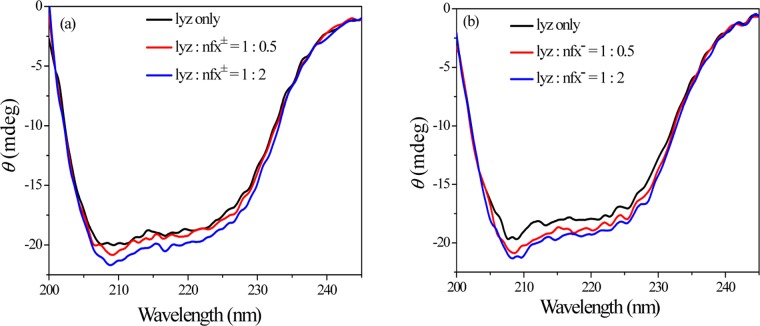
where MRE208 is the experimental MRE value of protein at 208 nm, 4000 is the MRE value of the β-form and random coil conformation at 208 nm, and 33 000 is the MRE value of a pure α-helix at 208 nm. In this case, the presence of both nfx± and nfx– increases the α-helix content of lysozyme to some extent (Figure 11). The estimated percentage α-helix content of lysozyme at pHs 7.2 and 9.2 in the absence and presence of nfx± or nfx– have been tabulated in Table 4. Such an increase in the helical content of lyz in presence of nfx± or nfx– suggests that the secondary structure of the protein is perturbed to some extent upon binding of the aforementioned protomeric forms of norfloxacin.
Figure 11.
Circular dichroism spectra of lysozyme in the presence of (a) nfx± (at pH 7.2) and (b) nfx– (at pH 9.2) at 298 K. [lyz] = 15 μM.
Table 4. Percentage α-Helix of lyz in the Absence and Presence of nfx± (at pH 7.2) or nfx– (at pH 9.2)a.
| system | [nfx±] or [nfx–] (μM) | α-helix (%) of lyz |
|---|---|---|
| nfx±–lyz | 0 | 21.23 |
| 7.6 | 22.62 | |
| 30 | 24.19 | |
| nfx––lyz | 0 | 20.72 |
| 7.6 | 22.97 | |
| 30 | 23.66 |
[lyz] = 15 μM.
2.9. Competitive Binding Assay with 8-Anilino-1-naphthalenesulfonate (ANS)
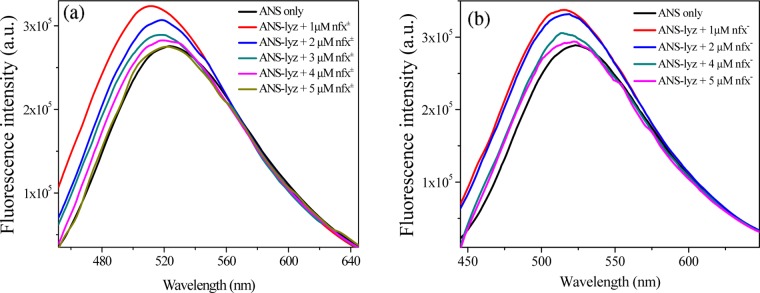
8-Anilino-1-naphthalenesulfonate (ANS) is a well-known fluorescent probe for sensing the changes in the hydrophobicity in its immediate microenvironment. ANS has been reported to strongly bind to the hydrophobic cleft of lysozyme, exhibiting enhancement in the fluorescence quantum yield with a blue shift in the emission maxima and hence has been chosen to follow the competitive binding with any other lysozyme-binding ligand.21,38 Here, we monitored the environment-sensitive fluorescence of ANS to probe the potential binding site of norfloxacin (nfx± and nfx–) in lysozyme. In this assay, ANS (2 μM) was initially allowed to bind with lyz (2 μM) in a 1:1 ratio. At pH 7.2, the emission intensity of ANS increases along with blue shift of the emission maxima from ∼524 to ∼512 nm (Figure 12a), which is due to partitioning of the probe from bulk aqueous phase to the hydrophobic pocket of lysozyme. Successive addition of nfx± to the lyz-bound ANS reduces the emission intensity of the probe and shifts the emission maxima to ∼521 nm at the maximum added nfx± concentration (Figure 12a). Similarly, at pH 9.2, the fluorescence intensity of ANS enhances upon binding with lyz, along with a shift of the emission maxima from ∼524 to ∼514 nm (Figure 12b). Later on, the addition of nfx– to the lysozyme-bound ANS reduces the emission intensity with a shift of the band, and here the emission maximum shifts to ∼520 nm at the maximum nfx– concentration (Figure 12b). Thus, the observations with protein-bound ANS fluorescence spectra upon addition of nfx± or nfx– clearly indicate that ANS gets displaced from the binding site of lyz and returns to the bulk aqueous medium; that is, nfx competes with ANS for the same binding site in lysozyme. The binding location is further inspected by molecular docking simulations, as discussed later.
Figure 12.
Variation of steady-state fluorescence spectra of ANS in the absence and presence of lyz, and upon subsequent addition of (a) nfx± (at pH 7.2) and (b) nfx– (at pH 9.2) at 298 K. λexc = 380 nm.
2.10. Molecular Docking Study
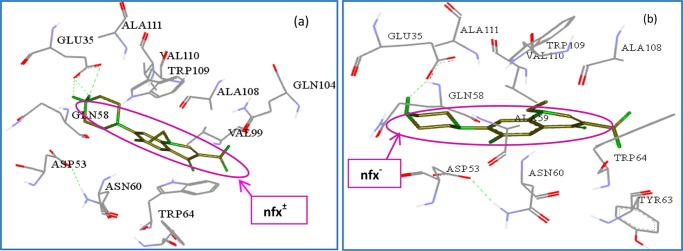
Finding out the location of the bound drug molecule inside the protein macromolecule is also very much important for a complete study of the concerned drug–protein interaction process. Herein, the most probable binding site for both nfx± and nfx– inside lyz was explored with AutoDock-based blind-docking simulation, as mentioned in detail in Section 4. Both the protomeric species of nfx were docked into the three-dimensional (3D) crystal of lyz. Several literatures are available regarding binding of different ligands and antigens to the active catalytic site of lyz.38−40 The energetically favorable docked conformation of both the protomers of nfx inside lyz are depicted in Figure 13. The amino acid residues in the close vicinity (within 4 Å) of nfx± are: Glu35, Asp53, Gln58, Asn60, Tyr63, Trp64, Val99, Gln104, Ala108, Trp109, Val110, and Ala111, and for nfx–, the involved residues are: Glu35, Asp53, Ala59, Gln58, Asn60, Tyr63, Trp64, Ala108, Trp109, Val110, and Ala111. These mentioned amino acid residues are located in the substrate binding region of lyz.13 Therefore, it could be inferred that both the protomers dock near the substrate binding site of the protein. The observed quenching of tryptophan fluorescence and shift in synchronous fluorescence maxima in lyz could be attributed to the interaction of the drug with Trp64 and Trp109 located in the binding region inside lyz. In a protein–ligand binding, depending on the nature of the amino acid residues present around the ligand, the side chains can offer different kinds of interaction forces. The associated intermolecular energy, as obtained from docking result, can provide some idea about involved binding forces. In this case, the associated intermolecular energy, as obtained from the docking result for nfx±–lyz association, was found to be −5.66 kcal mol–1, in which electrostatic interaction energy contributes −1.42 kcal mol–1 and van der Waals, hydrogen-bonding interaction energy contribute −4.24 kcal mol–1. Hence, the higher contribution is coming from the van der Waals, hydrogen-bonding interaction energy to the total intermolecular energy, and this corroborates very well with the previously discussed thermodynamic data obtained from fluorimetric temperature variation method for nfx± binding to lysozyme. As displayed in the docked pose, the −NH2+ moiety of nfx± is involved in hydrogen-bonding interaction with Glu35 of lyz. On the other hand, the intermolecular energy of docked nfx– in lysozyme was found to be −5.64 kcal mol–1, of which electrostatic interaction energy is −2.07 kcal mol–1 and van der Waals, hydrogen-bonding interaction energy is −3.57 kcal mol–1. Although these values are somewhat approximations, combining the tryptophan quenching and the fluorimetric thermodynamics studies, it could be inferred that it is the dominance of strong hydrogen-bonding interaction that makes the nfx±–lyz association more potent over the nfx±–lyz case.
Figure 13.
Interacting amino acid residues around (a) nfx± and (b) nfx– (within 4 Å) in the binding region of lysozyme. The hydrogen-bond formed with the amino acid residues are in dotted green color.
3. Summary and Conclusions
Considering all of the experimental results, here we discuss the key findings.
The previous studies on norfloxacin–protein binding focused on only one form of norfloxacin (zwitterionic species at pH ∼7.4). Here, we framed our work in a wide pH range to extract information on the interaction of all the three protomeric species of norfloxacin prevailing at different pH. For a denotative picture of the nfx–lyz interaction, fluorescence spectral characteristics of both the protein and the drug at different pH were examined along with the other spectroscopic measurements. The emission spectral features of the drug provide information on the fate of the drug inside the protein pocket. Modulation of spectral properties of the drug at any of its protomeric forms upon lyz addition should not be utilized to decipher specific binding affinity of the individual forms, as there might be shifting in any of the prototropic equilibria in the presence of the host protein. Whereas modulation in the fluorescence emission of the protein helps in determining the absolute binding affinity of the protein toward the individual species of the drug. The initial study, by monitoring the emission spectra of nfx at three different pH, suggested that the cationic from nfx+ does not show substantial interaction with lyz (at pH 4.2), whereas the other two protomeric species show interaction with the protein. This is most probably because the side chain amino groups remain protonated and provide lyz a high net positive charge at the acidic pH (4.2), and hence the cationic drug molecule is not allowed by the protein to approach and get hosted into it. Because of spectral similarity between the zwitterionic and the anionic form, no conclusive result was obtained on the binding of nfx± or nfx– with lyz by simply monitoring the emission spectra of the two concerned species. Then, to resolve the said issues and to get a clear quantitative idea on the interaction process of these two protomers with lyz, fluorescence quenching of the protein was further monitored. Therein, it was uncovered that lysozyme binds the zwitterionic form of norfloxacin with a much higher binding constant value compared to the anionic form which has a weak association. The competitive binding assay performed with ANS revealed that norfloxacin (nfx± and nfx–) binds the same binding region to that of ANS in the lyz matrix which is rather a hydrophobic region. Then, the binding site of nfx was further identified by molecular docking simulation that pointed a region in the catalytic active site of lyz. The analysis of the thermodynamic parameters from the temperature variation method as well as the molecular docking analysis of the association process of the most strongly binding nfx± to lyz shows major dominance of the van der Waals and hydrogen-bonding interactions. At this point, the observed little fluorescence quenching of nfx± by lyz is rationalized due to the operation of strong hydrogen bonding. Again, considering the much higher affinity of nfx± for lyz than that of the nfx–, it could be well justified to propose here that the observed emission feature of nfx– which became exactly similar to that of nfx± with increasing lyz concentration should be due to a switchover of the anionic form to its zwitterionic form. The pH inside the body system depends on the local environment, and it ranges from the acidic to alkaline in different body fluids, and it also varies in cases of normal and inflamed tissues. In alkaline pH, where norfloxacin is mostly present in its anionic form, encountering with lysozyme will eventually increase the population of the zwitterionic form. For the antimicrobial drugs such as fluoroquinolones, the target is the enzyme-DNA topoisomerase inside the bacterial cell. Therefore, prior to reaching the target, a fundamental requirement is to cross the bacterial cell membrane by these antimicrobial drugs. As mentioned previously, the fluoroquinolone drugs in their zwitterionic form can cross lipid bilayer membranes by passive diffusion in an antiparallely stacked arrangement so that their polarity and the electrostatic potential barrier of membrane penetration are minimized. Living bacteria have a pH gradient across the cytoplasmic membrane; where the cytoplasm pH is a bit acidic (e.g., Escherichia coli cytoplasmic pH ∼6.1) than external pH. The zwitterionic fluoroquinolone drug molecules enter through the membranes, and then they are converted into positively charged species (as intracellular pH is acidic), resulting in the effective entrapment of the drug molecules that reach a therapeutic level of drug accumulation inside bacterial cells. Hence, this lysozyme-induced switchover of anionic nfx– to zwitterionic nfx± is advantageous with respect to their membrane permeability.
Therefore, we find from the study that depending on the protonation state of a drug, which in turn depends on the local pH of the immediate environment, the drug may interact with differential affinity with relevant biomolecules present around. Additionally, such drugs having single or multistep acid–base equilibrium may get interconverted into any of their protomers that are preferred by the host biomolecule and consequently leads to an alteration in the prototropic equilibrium and hence drug pharmacokinetics also. We found from the current study that in dealing with comparative binding affinities of lysozyme with a drug (norfloxacin) having multiple protomeric forms, pH-dependent specific interaction of a particular form with specific charge and structural features dominate the binding process with the host protein. In a recent study, we found that lysozyme prefers the phenolate pyranine over its protonated acid form working at pH ∼7.41 Some other studies with drugs having single acid–base equilibrium with their cationic and neutral protomers reported about the preference of lysozyme (chicken variety) toward the neutral protomers. Also, there are reports showing that binding of a ligand (having only one form) with lysozyme is most effective at pH of around ∼7.4 (i.e., at physiological pH).42,43 Here, we find that lysozyme selectively prefers the zwitterionic norfloxacin over the cationic or anionic species. Therefore, this study suggests that depending on the ionic nature and structural features of the guest molecule, the host lysozyme decides its specificity for any particular protomer of the guest, which in turn depends on the specific interaction forces involved in the binding process. The environmental pH should also be another governing factor in this regard, as pH-dependant structural changes of the protein as well as the alteration of ionization states of involved amino acid side chains should have salient roles. Such findings, in turn, elevate the detailed consideration on the interaction of individual acid–base pair of any prototropic drug existing at different pH and interacting with some specific biomolecular targets of interest.
4. Experimental Section
4.1. Materials
Human lysozyme (>90%, recombinant, expressed in rice) and norfloxacin were purchased from Sigma-Aldrich and Sisco Research Laboratories Pvt. Ltd., India, respectively. 8-Anilinonaphthalene-1-sulfonate magnesium salt (ANS) was purchased from TCI chemicals, Japan. Other chemicals were of analytical grade. Phosphate buffer solutions of pH 4.2, 7.2, and 9.2 prepared for experiments, were of 5 mM strength. Ultrapure water was used for all solution preparations. pHs of buffer solutions were measured with a EUTECH pH 510 ion pH-meter.
4.2. Instrumentation and Methods
UV–vis absorption spectra were recorded on a Shimadzu UV-2450 absorption spectrophotometer against a solvent blank reference in the wavelength range of 250–350 nm.
All steady-state fluorescence emission and steady-state emission anisotropy measurements were taken on a Jobin Yvon Spex Fluorolog-3 spectrofluorometer, using a 1 cm path-length quartz cuvette. Norfloxacin concentration, for fluorescence emission measurements, was kept at 1.5 × 10⁻⁶ M. Norfloxacin was photoexcited at 331 nm; emission spectra were collected from 350 to 600 nm, keeping the excitation slit at 2.5 nm and emission slit at 2 nm. The lysozyme concentration used for its emission studies was 1 × 10⁻⁶ M, and its emission was monitored by exciting selectively its intrinsic tryptophan fluorophore at 295 nm, keeping the excitation slit at 5 nm and emission slit at 3 nm. A 2 × 10⁻⁶ M aqueous ANS solution was used for its emission spectral measurements, where the samples were excited at 380 nm, with excitation and emission slits at 6 and 5 nm, respectively. The experimentally measured fluorescence intensity was corrected according to the expression,28Fcor = (Fobs – Fb) × 10(Aex+Aem)/2, for any background fluorescence and inner filter effects. Here, Fcor is the corrected fluorescence intensity, Fobs is the experimentally measured fluorescence intensity, Fb is any significant background fluorescence intensity, and Aex and Aem are the absorbances of the sample at the excitation and emission wavelengths, respectively. The fluorescence spectra are all plotted with the corrected intensities (Fcor). The vertical bars with caps, used on the data points wherever present, represent the error bars.
Time-resolved fluorescence intensity decays were collected by using a time-correlated single-photon counting picosecond spectrophotometer (LifeSpec II; Edinburgh Instruments, U.K.). Samples were excited by a picosecond pulsed light-emitting diode (EPLED-290) centered at 296 nm, and emission signals were collected at the magic angle (54.7°), using a photomultiplier tube (H10720-01 photosensor module from Hamamatsu Photonics). The instrument response function was ∼800 ps. The decay analyses were performed by using F-900 software from Edinburgh Instruments.41
4.3. Molecular Docking
The crystal structure of human lysozyme (protein data bank (PDB) ID: 1IX0)44 was taken from the protein data bank for the docking study. Polar hydrogens were added, and water molecules were removed from the PDB file to prepare software specific files. Both the molecular structure of nfx± and nfx– were optimized by PM3 prescription using Gaussian 09 program package.45 These optimized structures of both nfx± and nfx– were docked into the 3D crystal structure of lyz using AutoDock 4.2-based blind-docking.9 It employs the Lamarckian genetic algorithm for searching the optimum binding site of small molecules in protein.46 AutoDock reports docked energy that includes a solvation-free energy term and intermolecular interaction energy of the ligand. To perform the blind-docking analysis, the grid center was set at 60, 60, and 60 along X, Y, and Z axes, respectively, with a grid spacing of 0.375 Å. The lowest energy conformation, out of 30 conformations, was taken as the most preferred binding position of both the nfx± and nfx– in lysozyme.
4.4. Circular Dichroism Spectra
Circular dichroism (CD) spectra were recorded on a Jasco-810 automatic recording spectropolarimeter in the wavelength range of 200–250 nm, with a scan speed 50 nm min–1, under constant nitrogen flushing, at 298 K. Two successive scans were accumulated for each spectrum with a quartz cell of path length 0.1 cm. Baselines were corrected with buffer solutions. A 20 μM lyz solution was used for measurements.
Acknowledgments
M.H. thanks DST-SERB, Govt. of India (Fund no. SB/S1/PC-041/2013), and IIT Kharagpur for financial supports. I.D. thanks IIT Kharagpur for her individual fellowship. We thank the anonymous reviewers for their evaluative comments and suggestions.
The authors declare no competing financial interest.
References
- Hooper D. C. Mode of action of fluoroquinolones. Drugs 1999, 58, 6–10. 10.2165/00003495-199958002-00002. [DOI] [PubMed] [Google Scholar]
- Appelbaum P. C.; Hunter P. A. The fluoroquinolone antibacterials: past, present and future perspectives. Int. J. Antimicrob. Agents 2000, 16, 5–15. 10.1016/S0924-8579(00)00192-8. [DOI] [PubMed] [Google Scholar]
- Ball P. Quinolone generations: natural history or natural selection?. J. Antimicrob. Chemother. 2000, 46, 17–24. 10.1093/oxfordjournals.jac.a020889. [DOI] [PubMed] [Google Scholar]
- Blandeau J. M. Expanded activity and utility of the new fluoroquinolones: a review. Clin. Ther. 1999, 21, 3–40. 10.1016/S0149-2918(00)88266-1. [DOI] [PubMed] [Google Scholar]
- Oliphant C. M.; Green G. M. Quinolones: a comprehensive review. Am. Fam. Physician 2002, 65, 455–464. [PubMed] [Google Scholar]
- Charifson P. S.; Walters W. P. Acidic and basic drugs in medicinal chemistry: A perspective. J. Med. Chem. 2014, 57, 9701–9717. 10.1021/jm501000a. [DOI] [PubMed] [Google Scholar]
- Lu Y.; Wang G.; Lu X.; Lv J.; Xu M.; Zhang W. Molecular mechanism of interaction between norfloxacin and trypsin studied by molecular spectroscopy and modeling. Spectrochim. Acta, Part A 2010, 75, 261–266. 10.1016/j.saa.2009.10.021. [DOI] [PubMed] [Google Scholar]
- Kamat B. P. Study of the interaction between fluoroquinolones and bovine serum albumin. J. Pharm. Biomed. Anal. 2005, 39, 1046–1050. 10.1016/j.jpba.2005.05.013. [DOI] [PubMed] [Google Scholar]
- Paul B. K.; Ghosh N.; Mukherjee S. Binding interaction of a prospective chemotherapeutic antibacterial drug with beta-lactoglobulin: results and challenges. Langmuir 2014, 30, 5921–5929. 10.1021/la501252x. [DOI] [PubMed] [Google Scholar]
- Paul B. K.; Ghosh N.; Mukherjee S. Interplay of multiple interaction forces: binding of norfloxacin to human serum albumin. J. Phys. Chem. B 2015, 119, 13093–13102. 10.1021/acs.jpcb.5b08147. [DOI] [PubMed] [Google Scholar]
- Son G. S.; Yeo J.-A.; Kim M.-S.; Kim S. K.; Holmén A.; Åkerman B.; Nordén B. Binding mode of norfloxacin to calf thymus DNA. J. Am. Chem. Soc. 1998, 120, 6451–6457. 10.1021/ja9734049. [DOI] [Google Scholar]
- Muniz G. S. V.; Teixeira L. R.; Louro S. R. W. Interaction of the antibiotic norfloxacin with ionic micelles: pH-dependent binding. Eur. Biophys. J. 2014, 43, 477–483. 10.1007/s00249-014-0978-5. [DOI] [PubMed] [Google Scholar]
- Blake C. C. F.; Koenig D. F.; Mair G. A.; North A. C. T.; Phillips D. C.; Sarma V. R. Structure of hen egg-white lysozyme: A 3-dimensional Fourier synthesis at 2 Å resolution. Nature 1965, 206, 757–761. 10.1038/206757a0. [DOI] [PubMed] [Google Scholar]
- Jollès P.; Jollès J. What’s new in lysozyme research? Always a model system, today as yesterday. Mol. Cell. Biochem. 1984, 63, 165–189. 10.1007/bf00285225. [DOI] [PubMed] [Google Scholar]
- Strynadka N. C. J.; James M. N. G. Lysozyme revisited: crystallographic evidence for distortion of an N-acetylmuramic acid residue bound in Site-D. J. Mol. Biol. 1991, 220, 401–424. 10.1016/0022-2836(91)90021-W. [DOI] [PubMed] [Google Scholar]
- Ghosh A.; Brinda K. V.; Vishveshwara S. Dynamics of lysozyme structure network: probing the process of unfolding. Biophys. J. 2007, 92, 2523–2535. 10.1529/biophysj.106.099903. [DOI] [PMC free article] [PubMed] [Google Scholar]
- Buck M.; Schwalbe H.; Dobson C. M. Characterization of conformational preferences in a partly folded protein by heteronuclear NMR-spectroscopy: assignment and secondary structure analysis of hen egg-white lysozyme in trifluoroethanol. Biochemistry 1995, 34, 13219–13232. 10.1021/bi00040a038. [DOI] [PubMed] [Google Scholar]
- Zhang Z.; Zheng Q.; Han J.; Gao G.; Liu J.; Gong T.; Gu Z.; Huang Y.; Sun X.; He Q. The targeting of 14-succinate triptolide-lysozyme conjugate to proximal renal tubular epithelial cells. Biomaterials 2009, 30, 1372–1381. 10.1016/j.biomaterials.2008.11.035. [DOI] [PubMed] [Google Scholar]
- Datta S.; Halder M. Detailed scrutiny of the anion receptor pocket in subdomain IIA of serum proteins toward individual response to specific ligands: HSA-pocket resembles flexible biological slide-wrench unlike BSA. J. Phys. Chem. B 2014, 118, 6071–6085. 10.1021/jp501547r. [DOI] [PubMed] [Google Scholar]
- Datta S.; Halder M. Effect of encapsulation in the anion receptor pocket of sub-domain IIA of human serum albumin on the modulation of pKa of warfarin and structurally similar acidic guests: A possible implication on biological activity. J. Photochem. Photobiol., B 2014, 130, 76–85. 10.1016/j.jphotobiol.2013.10.013. [DOI] [PubMed] [Google Scholar]
- Jash C.; Payghan P. V.; Ghoshal N.; Kumar G. S. Binding of the Iminium and Alkanolamine Forms of Sanguinarine to Lysozyme: Spectroscopic Analysis, Thermodynamics, and Molecular Modeling Studies. J. Phys. Chem. B 2014, 118, 13077–13091. 10.1021/jp5068704. [DOI] [PubMed] [Google Scholar]
- Maes V.; Engelborghs Y.; Hoebeke J.; Maras Y.; Vercruysse A. Fluorimetric analysis of the Binding of warfarin to human serum albumin. Equilibrium and kinetic study. Mol. Pharmacol. 1982, 21, 100–107. [PubMed] [Google Scholar]
- Hawe A.; Sutter M.; Jiskoot W. Extrinsic fluorescent dyes as tools for protein characterization. Pharm. Res. 2008, 25, 1487–1499. 10.1007/s11095-007-9516-9. [DOI] [PMC free article] [PubMed] [Google Scholar]
- Shaikh M.; Swamy Y. M.; Pal H. Supramolecular host–guest interaction of acridine dye with cyclodextrin macrocycles: photophysical, pKa shift and quenching study. J. Photochem. Photobiol., A 2013, 258, 41–50. 10.1016/j.jphotochem.2013.02.017. [DOI] [Google Scholar]
- Ogasahara K.; Hamaguchi K. Structure of lysozyme: XII. Effect of pH on stability of lysozyme. J. Biochem. 1967, 61, 199–210. 10.1093/oxfordjournals.jbchem.a128532. [DOI] [PubMed] [Google Scholar]
- Mulvey R. S.; Gaultieri R. J.; Beychok S. Spectral properties of human lysozyme and its inhibitor complexes. Fluorescence and difference spectra. Biochemistry 1973, 12, 2683–2690. 10.1021/bi00738a021. [DOI] [PubMed] [Google Scholar]
- Kuramitsu S.; Kurihara S.; Ikeda K.; Hamaguchi K. Fluorescence spectra of hen, turkey, and human lysozymes excited at 305 nm. J. Biochem. 1978, 83, 159–170. 10.1093/oxfordjournals.jbchem.a131887. [DOI] [PubMed] [Google Scholar]
- Lakowicz J. R.Principles of Fluorescence Spectroscopy, 3rd ed.; Springer: New York, 2006; pp 278–292. [Google Scholar]
- Turley W. D.; Offen H. W. Diffusion-controlled quenching in solutions at high-pressures. J. Phys. Chem. 1984, 88, 3605–3607. 10.1021/j150660a045. [DOI] [Google Scholar]
- Connors K. A.Binding Constants: The Measurements of Molecular Complex Stability; Wiley: New York, 1987. [Google Scholar]
- Klotz I. M. Physicochemical aspects of drug–protein interactions: general perspective. Ann. N. Y. Acad. Sci. 1973, 226, 18–35. 10.1111/j.1749-6632.1973.tb20465.x. [DOI] [PubMed] [Google Scholar]
- Uversky V. N.Methods in Protein Structure and Stability Analysis: Conformational Stability, Size, Shape and Surface of Protein Molecules; Nova Publishers: New York, 2007. [Google Scholar]
- Datta S.; Mahapatra N.; Halder M. pH-insensitive electrostatic interaction of carmoisine with two serum proteins: A possible caution on its uses in food and pharmaceutical industry. J. Photochem. Photobiol., B 2013, 124, 50–62. 10.1016/j.jphotobiol.2013.04.004. [DOI] [PubMed] [Google Scholar]
- Ross P. D.; Subramanian S. Thermodynamics of protein association reactions: forces contributing to stability. Biochemistry 1981, 20, 3096–3102. 10.1021/bi00514a017. [DOI] [PubMed] [Google Scholar]
- Halper J. P.; Latovitzki N.; Bernstein H.; Beychok S. Optical activity of human lysozyme. Proc. Natl. Acad. Sci. U.S.A. 1971, 68, 517–522. 10.1073/pnas.68.3.517. [DOI] [PMC free article] [PubMed] [Google Scholar]
- Barbosa L. R. S.; Ortore M. G.; Spinozzi F.; Mariani P.; Bernstorff S.; Itri R. The importance of protein–protein interactions on the pH-induced conformational changes of bovine serum albumin: a small-angle X-ray scattering study. Biophys. J. 2010, 98, 147–157. 10.1016/j.bpj.2009.09.056. [DOI] [PMC free article] [PubMed] [Google Scholar]
- Greenfield N. J.; Fasman G. D. Computed circular dichroism spectra for evaluation of protein conformation. Biochemistry 1969, 8, 4108–4116. 10.1021/bi00838a031. [DOI] [PubMed] [Google Scholar]
- Panja S.; Halder M. Exploration of electrostatic interaction in the hydrophobic pocket of lysozyme: importance of ligand-induced perturbation of the secondary structure on the mode of binding of exogenous ligand and possible consequences. J. Photochem. Photobiol., B 2016, 161, 253–265. 10.1016/j.jphotobiol.2016.05.007. [DOI] [PubMed] [Google Scholar]
- Vocadlo D. J.; Davies G. J.; Laine R.; Withers S. G. Catalysis by hen egg-white lysozyme proceeds via a covalent intermediate. Nature 2001, 412, 835–838. 10.1038/35090602. [DOI] [PubMed] [Google Scholar]
- Muraki M.; Harata K.; Sugita N.; Sato K.-i. Origin of carbohydrate recognition specificity of human lysozyme revealed by affinity labeling. Biochemistry 1996, 35, 13562–13567. 10.1021/bi9613180. [DOI] [PubMed] [Google Scholar]
- Das I.; Panja S.; Halder M. Modulation and salt-induced reverse modulation of the excited-state proton-transfer process of lysozymized pyranine: the contrasting scenario of the ground-state acid–base equilibrium of the photoacid. J. Phys. Chem. B 2016, 120, 7076–7087. 10.1021/acs.jpcb.6b04111. [DOI] [PubMed] [Google Scholar]
- Li D.; Zhang T.; Ji B. Influences of pH, urea and metal ions on the interaction of sinomenine with lysozyme by steady state fluorescence spectroscopy. Spectrochim. Acta, Part A 2014, 130, 440–446. 10.1016/j.saa.2014.04.054. [DOI] [PubMed] [Google Scholar]
- Li S.; Li D. Investigation on the pH-dependent binding of benzocaine and lysozyme by fluorescence and absorbance. Spectrochim. Acta, Part A 2011, 82, 396–405. 10.1016/j.saa.2011.07.069. [DOI] [PubMed] [Google Scholar]
- Takano K.; Yamagata Y.; Yutani K. Buried water molecules contribute to the conformational stability of a protein. Protein Eng. 2003, 16, 5–9. 10.1093/proeng/gzg001. [DOI] [PubMed] [Google Scholar]
- Frisch M. J.; Trucks G. W.; Schlegel H. B.; Scuseria G. E.; Robb M. A.; Cheeseman J. R.; Scalmani G.; Barone V.; Mennucci B.; Petersson G. A.; et al. Gaussian 09, revision C.01; Gaussian, Inc.: Wallingford, CT, 2010.
- Morris G. M.; Goodsell D. S.; Halliday R. S.; Huey R.; Hart W. E.; Belew R. K.; Olson A. J. Automated docking using a Lamarckian genetic algorithm and an empirical binding free energy function. J. Comput. Chem. 1998, 19, 1639–1662. . [DOI] [Google Scholar]


