

Abstract
Ligand docking into homology models of G-protein-coupled receptors (GPCRs) is a widely used approach in computational compound screening. The generation of “double-hypothetical” models of ligand–target complexes has intrinsic accuracy limitations that further complicate compound ranking and selection compared to those of X-ray structures. Given these uncertainties, we have explored “fuzzy 3D similarity” between hypothetical binding modes of known ligands in homology models and docking poses of database compounds as an alternative to conventional scoring schemes. Therefore, GPCR homology models at varying accuracy levels were generated and used for docking. Increases in recall performance were observed for fuzzy 3D similarity ranking using single or multiple ligand poses compared to that of conventional scoring functions and interaction fingerprints. Fuzzy similarity ranking was also successfully applied to docking into an external model of a GPCR for which no experimental structure is currently available. Taken together, our results indicate that the use of putative ligand poses, albeit approximate at best, increases the odds of identifying active compounds in docking screens of GPCR homology models.
1. Introduction
Docking of small molecules into binding sites of target proteins continues to be the major approach to computational ligand identification.1,2 Although high-resolution X-ray structures are generally preferred as docking templates, homology models are also frequently used in the absence of experimental structures.3−5 Although protein models are less accurate than X-ray structures from which they are derived, they are also capable of enriching active compounds in database rankings from docking screens and identifying new active compounds in prospective applications.6
G-protein-coupled receptors (GPCRs) are a growth area for molecular docking, due to stellar advances in the structural biology of these highly complex membrane receptor systems over the past decade.7−9 The increasing number of experimentally determined GPCR structures has deepened our understanding of binding-site features and provided unprecedented opportunities for structure-based compound screening and ligand design.10 At the same time, structural coverage across the GPCR superfamily is still sparse compared to that of other popular therapeutic targets. Accordingly, homology models of GPCRs continue to play an important role for docking,11,12 yielding impressive results in some applications.6 In fact, with each new GPCR X-ray structure that is becoming available, the knowledge base for homology modeling further increases compared to that of earlier days when the X-ray structure of bovine rhodopsin was for long the only available template for GPCR modeling.13,14
Despite incremental advances made over the years, force field-based scoring of ligand poses still represents a major limitation of hit identification via docking.15−17 Difficulties in reliably ranking active compounds on the basis of force field energy functions have triggered the exploration of alternative scoring approaches tailored toward different targets or families, including GPCRs.18−20 In this context, synergies between docking and ligand-based computational screening methods can also be taken into consideration,21,22 for example, the inclusion of molecular similarity23 in evaluating docking poses. However, only few studies have so far attempted to combine ligand-based similarity assessment and docking, for example, through sequential calculations24,25 or data fusion.26
As a step toward integration of molecular similarity and docking calculations, we have previously reported a methodology combining the generation of docking poses with 3D similarity comparison to experimentally determined ligand-binding modes.27 Accordingly, instead of applying scoring functions, docking poses and reference ligands were compared and 3D similarity values calculated to generate database rankings, which frequently yielded significant improvements in compound recall over conventional scoring or the use of protein–ligand interaction fingerprints (PLIFs) for pose prioritization.27,28 In addition to other targets, the utility of this approach was also demonstrated for GPCRs.28 However, given the dependence of the 3D similarity-based approach on crystallographic ligand binding modes, its application was principally limited to targets for which complex X-ray structures were available.
Herein, we explored 3D similarity-based compound ranking for docking into homology models of GPCRs, which continue to be widely used in virtual screening. This might appear to be counterintuitive at a first glance because 3D similarity ranking was conceptually based on crystallographic ligand-binding modes. The probability to correctly prioritize docking poses was expected to increase with the increase in the accuracy of the reference information. However, given that docking into homology models yields “double-hypothetical” ligand–target complexes29 with principally limited accuracy, we were interested in investigating whether “fuzzy similarity” between the modeled reference and database compounds might also suffice to guide compound selection. Therefore, different strategies were evaluated for ranking on the basis of fuzzy similarity, including single or multiple reference poses. As reported herein, these strategies produced higher compound recall for GPCR homology models than force field energy scoring or PLIFs, thus further extending the potential of model-based compound selection.
2. Methods and Materials
2.1. Receptor Structures and New Homology Models
An X-ray structure of the β2 adrenergic (β2) receptor bound to the antagonist carazolol (PDB code 2RH1(30)) was taken from the Protein Data Bank. The structure was prepared for docking using Molecular Operating Environment (MOE) 2014.09.31 Bound ions, organic solvent, and water molecules were removed from the receptor ligand-binding domain used as a template for docking. Other preparation steps included the addition of hydrogen atoms, computation of protonation states and tautomers (calculated at pH 7), assignment of partial charges, and limited energy minimization (structural relaxation) using the Amber10 force field until a root mean square (RMS) gradient of 0.1 kcal/mol/Å2 was reached.
Two homology models of the β2 receptor were built using the structure of β1 adrenergic (β1) receptor (PDB code 4BVN)32 from turkey (Meleagris gallopavo) and human adenosine A2A (A2A) receptor (PDB code 4EIY)33 as templates, respectively. In addition, a homology model of the A2A receptor was generated using the β2 receptor, 2RH1, as a template. The modeling protocol detailed in the following was consistently applied.
Initial sequence alignments were generated with Clustal Omega.34 For homology modeling, the alignments were manually edited to appropriately place insertions and deletions in variable regions. In each case, MODELLER version 9.1735 was used to build 500 initial models, and the one with the most favorable DOPE energy score was selected. Selected models were prepared for docking as described above for the X-ray structure. A known antagonist was flexibly docked into the binding site of each selected model to refine binding site coordinates and provide a reference binding mode. Ligands included ZM24138533 (for A2A) and carazolol30 (for β2). To adjust side chain positions of the residues in the modeled binding sites in a ligand-assisted manner, the induced-fit docking protocol of MOE31 was applied, permitting side chain flexibility within 6 Å of the placed ligand. In each case, 100 of 100 000 initially generated docking poses were retained and scored with the GBVI/WSA dG function implemented in MOE using default parameter settings. As a reference for RMSD calculations, crystallographic binding modes of reference ligands were transferred into the models following α carbon atom superposition of the X-ray structures and corresponding models.
2.2. External GPCR Model
A homology model of the 5-hydroxytryptamine 6 (5-HT6) receptor was extracted from the GPCRdb.36 This database includes various models of human GPCRs generated by fragment assembly from different templates for backbone construction combined with position-specific rotamer side chain modeling.37 The 5-HT6 receptor model was prepared for docking as described above.
2.3. Compound Sets
A benchmark set for the A2A receptor was extracted from the DEKOIS 2.0.38 The selected data set included 37 antagonists and 1100 corresponding decoys. To focus the study on the ranking of antagonists, the only three known agonists (BDB50085666, BDB50085668, and BDB50309479) present in the benchmark set were removed together with 100 decoys selected by the developers of the DEKOIS database to match physicochemical properties of these agonists. Activity annotations were confirmed on the basis of the corresponding BindingDB39 records. For β2, no functional designation (agonist or antagonist) was provided for a number of ligands in DEKOIS. Therefore, 23 known antagonists were taken from the IUPHAR/BPS Guide to Pharmacology database (GtoPdb).40 These compounds were found to correspond to 15 different Bemis–Murcko (BM) scaffolds, indicating structural diversity. For these antagonists, 1150 decoys were generated via the DUD-E web server.41 For the external GPCR model, a set of 35 5-HT6 antagonists (containing 32 unique BM scaffolds) was extracted from GtoPdb40 and 2350 decoys were generated using DUD-E.41
For each compound, an initial low-energy conformation was generated with MOE and protonation states and partial charges were assigned on the basis of its AM1-BCC implementation following a previously reported protocol,42 which was also applied to prepare crystallographic ligands for docking.
2.4. Docking and Scoring
All docking trials were carried out using the Dock module of MOE.31 The triangle matcher function was used to generate 1000 docking poses for each ligand, and the top 30 poses on the basis of the London dG scoring function were preselected and further refined by rescoring using the GBVI/WSA dG scoring function to produce final ranking. In previous studies,27,28 this combination of the London dG and GBVI/WSA dG functions was the consistently best performing force field-based scoring scheme.
2.5. Similarity Calculations
Similarity to reference binding modes was quantified using a property density function-based 3D similarity measure43 that was consistently applied in our previous studies for 3D similarity evaluation of docking poses.27,28 In addition, interaction similarity was assessed on the basis of the PLIF implementation of MOE.31 In the former case, normalized overlap of property density functions (ranging from 0 to 1) was calculated as a measure of 3D similarity.43 Accordingly, both conformational and translational differences (e.g., different orientations in a binding site and/or positional displacements) were taken into account. In the latter case, receptor–ligand contacts were assigned to six categories of interactions including side chain-mediated hydrogen bonds (donor and acceptor), backbone-mediated hydrogen bonds (donor and acceptor), ionic interactions, and surface interactions. PLIFs were calculated with default settings and compared using the Tanimoto coefficient.44 For each similarity measure, compound rankings were calculated.
The reference ligands used for similarity calculations were overall characterized by relatively low similarity to the docked antagonists. Only one to two antagonists in each data set had a two-dimensional (2D) similarity value of greater than 0.8 calculated using MACCS fingerprint compared to that of the reference compounds.
2.6. Performance Evaluation
Receiver operator characteristic (ROC) plots were generated to evaluate compound rankings. ROC curves monitor the percentage of known active compounds retrieved at each position of the ranking. The area under the ROC curve (AUC) was calculated as a measure of the enrichment of active compounds in a ranking applying the composite trapezoidal rule. AUC values of 0.5 correspond to the random distribution of active compounds and decoys in rankings, whereas increasing AUC values greater than 0.5 further indicate increasing enrichment of active compounds at high-rank positions. Accordingly, an AUC value of 1 would be produced by a ranking in which all active compounds would be ranked higher than the best scoring decoys. In addition, to specifically assess early enrichment of active compounds, the enrichment factor for 10% of the ranked database (Ef10%) was also computed.45 The maximum theoretical Ef10% for all three data sets was 10.
For the external homology model, the performance was also assessed by calculating Ef1% values. The maximum theoretical Ef1% for this data set was 68.6. Furthermore, Rocker46 was used to calculate BEDROC47 values with α = 20.0.
3. Results and Discussion
3.1. Study Concept
Previously, we have ranked docking poses on the basis of 3D similarity to crystallographic ligand-binding modes as an alternative to conventional force field scoring.27,28 These were the first attempts to calculate 3D similarity for compound ranking from docking screens, which represents, by definition, a knowledge-based approach. The ability of 3D similarity calculations to enrich active compounds at high-rank positions was attributed to the use of well-defined experimental ligand-binding modes as references that many active compounds were anticipated to resemble. In fact, core fragments of crystallographic ligands were in some instances already sufficient to effectively guide compound ranking.28 Herein, we have investigated the question whether approximate ligand poses might also be useful. For example, in cases in which no complex structures are available, known active compounds might be docked into X-ray structures of targets to provide reference poses. If modeled poses would at least be approximately correct, they might serve as a surrogate or alternative for scoring. We also reasoned that the use of approximate ligand-binding modes might be particularly suitable if the docking template itself was approximate, that is, a computational model instead of a refined X-ray structure. Hence, we essentially asked the question whether the odds of docking into approximate models might be further improved by adding one or more hypothetical compound-binding modes as a basis for compound ranking. However, propagating inaccuracies resulting from modeling of targets and complexes might also compromise similarity-based ranking. In any event, the use of double-hypothetical models inevitable introduces fuzziness into 3D similarity assessment, which is not due to the similarity calculations (which are the same as for crystallographic references) but rather to the use of approximate reference states. Fuzziness of these calculations might be further increased by using alternative binding poses instead of a single one. Because the assessment of fuzzy similarity for compound ranking was the main motivation for our current study, the analysis was deliberately focused on homology models of GPCRs, which continue to be popular docking targets. Owing to advances in GPCR crystallography, homology modeling of GPCRs has experienced a renaissance in recent years.
3.2. Docking into the X-ray Structure of the β2 Receptor
As a reference calculation, 3D similarity scoring was initially applied to the X-ray structure of the β2 receptor complexed to the antagonist carazolol. Three alternative rankings were generated on the basis of 3D similarity to the bound antagonist carazolol, PLIF-based similarity, and the preferred scoring function. The results are summarized in Table 1 and graphically represented in Figure 1A. Both scoring and 3D similarity calculations resulted in a high enrichment of known antagonists with an AUC of 0.80 and 0.83, respectively, and an Ef10% of 6.09 for both methods. By contrast, PLIF-based similarity only resulted in an AUC of 0.62. Figure 2 shows that PLIF-based ranking was very sensitive to correct posing. When docked antagonists departed from the binding of carazolol, even if only in part, ligand–receptor interaction details were modulated, thereby reducing PLIF similarity and leading to low ranks. In contrast, 3D similarity calculations were much more robust and yielded comparably high ranks for antagonists as long as the docking poses were at least approximate and parts of ligands correctly aligned. Importantly, 3D similarity calculations quantify whole-molecule resemblance by comparing atomic property density functions but are insensitive to interaction differences, which provided an advantage in this case. For the A2A receptor in which ligand–receptor key interactions were mainly formed by a large rigid aromatic ring system, posing was more stable than observed for the β2 receptor herein and central interactions often conserved, leading to more successful PLIF-based ranking of known antagonists A2A.28 In the presence of approximate poses, 3D similarity assessment was clearly more effective.
Table 1. Docking Screen of the β2 Receptor Structurea.
| protocol | reference pose | AUC | Ef10% |
|---|---|---|---|
| FF scoring | none | 0.80 | 6.09 |
| 3D similarity | X-ray | 0.83 | 6.09 |
| PLIF similarity | X-ray | 0.62 | 4.35 |
Compounds were docked into the β2 receptor structure (PDB code 2RH1) and ranked on the basis of force field (FF) energy scoring and 3D similarity as well as the PLIF similarity to the X-ray structure of a bound ligand. Recall of active compounds is reported. Results for the best performing methods are in bold.
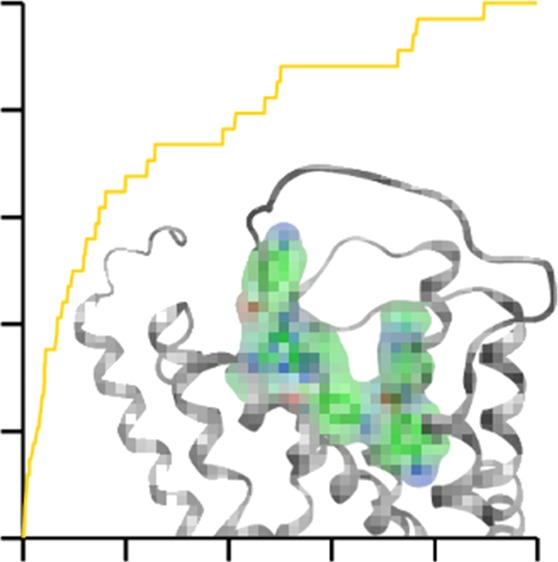
Figure 1.

ROC plots for alternative ranking schemes. Orange curves represent the results for the London dG scoring function and yellow curves for 3D similarity to the crystallographic binding mode of carazolol (panel A), a docking pose of carazolol (panels B and C), or a docking pose of a fragment of ZM241385 (consisting of the triazolotriazine core and the furan ring) (panel D). Green curves represent the results for PLIF-based compound ranking by using the same reference poses as before, and the blue lines provide a reference for random compound selection.
Figure 2.

3D similarity vs PLIFs. Superposition of co-crystallized carazolol (green) and four representative docked antagonists (magenta) are shown. In panel A, propranolol essentially matches all structural features of carazolol and hence forms comparable interactions with the receptor. In panel B, NIP also aligns well with carazolol, but the protonated amine is too far away from Asp113 for forming a salt bridge. In panel C, a salt bridge between CGP 12177 and Asp113 is present, but the hydroxyl group is displaced and the aromatic ring system is found in a head-to-tail orientation compared to that of carazolol. In panel D, metoprolol only partly overlaps with carazolol and does not form well-defined interactions. For each antagonist, 3D similarity scores and percentage rank positions (in parentheses) are reported.
3.3. Docking into Homology Models
For the next step, three homology models were built, including two of the β2 and one of the A2A receptor (Table 2). The two β2 models were constructed to represent different accuracy levels. The first model was built using the structure of the β1 adrenergic (β1) receptor from turkey as a template. This model is referred to as β2(β1). The β1 template and β2 receptors shared high sequence identity and conserved binding site residues, yielding an overall accurate model (RMSD 1.72 Å; magenta in Figure 3A). The alternative model was obtained using the structure of the human A2A receptor as a template, referred to as β2(A2A). Although β1, β2, and A2A belonged to class A (rhodopsin-like) GPCRs, β2 shared much lower sequence identity with A2A than with β1 (Table 2). The β2(A2A) model was thus overall less accurate (RMSD of 3.06 Å; orange in Figure 3A), including the ligand binding that was only partly conserved in β1 and A2A (Figure 3B). In addition, an approximate homology model of the A2A receptor was also generated using the β2 receptor as a template, referred to as A2A(β2) (RMSD 3.62 Å; pink in Figure 3C). Overall, A2A(β2) was the least accurate homology model, and binding site accuracy of this model was also only limited (Figure 3D), as expected.
Table 2. In-House Homology Modelsa.
| model | template | sequence identity (%) | template PDB code | template resol. (Å) | model RMSD (Å) | pocket RMSD (Å) | docked ligand RMSD (Å) | DOPE score |
|---|---|---|---|---|---|---|---|---|
| β2 | β1 | 52.9 | 4BVN | 2.1 | 1.7 | 0.5 | 1.2 | –41 854.8 |
| β2 | A2A | 30.4 | 4EIY | 1.8 | 3.1 | 2.3 | 5.7 | –39 094.1 |
| A2A | β2 | 30.4 | 2RH1 | 2.4 | 3.6 | 3.6 | 1.8 | –38 530.9 |
For two GPCRs with known X-ray structures, homology models were generated using different templates. All template structures were from Homo sapiens, except β1, which was from M. gallopavo. For templates and targets, sequence identity is reported. For template structures, the crystallographic resolution is also given. In addition, RMSD values are provided for comparison of each model with the corresponding X-ray structure, residues forming the binding pocket, and docked ligands and their crystallographic binding modes (after superposition of the model and X-ray structure). DOPE scores computed by MODELLER to assess model quality are also reported.
Figure 3.

Structures and binding modes. Panel A shows the superposition of the X-ray structure of the β2 receptor (green) and two homology models based on the β1 (magenta) and the A2A (orange) receptor, respectively. In panel B, binding site details are displayed including co-crystallized carazolol (green) and modeled binding modes. Panel C shows the superposition of the X-ray structure of the A2A receptor (cyan) and the β2 receptor-based model (pink). In panel D, binding site details are shown including co-crystallized ZM241385 (cyan) and modeled binding modes. Panel E shows the homology model of the 5-HT6 receptor from GPCRdb. In panel F, binding site details are displayed including three different docking poses of Ro 04-6790.
Induced-fit docking was used to generate reference binding modes of carazolol for the β2 models and of ZM241385 for the A2A models. For β2, the accuracy of the modeled binding modes of carazolol correlated with the accuracy of the models. Thus, in β2(β1), the pose was close to the experimental binding mode (RSMD 1.2 Å; magenta in Figure 3B), whereas the pose was displaced in β2(A2A) with only partial structural overlap (RMSD 5.7 Å; orange in Figure 3B). For ZM241385A, a pose was obtained that also displayed a partial displacement but was overall well aligned with the experimental binding mode (RMSD 1.8 Å; Figure 3D). In the case of β2(β1) and β2(A2A), the pose with the lowest RMSD value generated by the induced-fit docking protocol did not correspond to the one with the best score that was selected as a reference. A pose with an RMSD value of 0.5 Å was obtained for β2(β1) and another with an RMSD of 3.5 Å for β2(A2A). For consistency with our validation study, these poses were not selected as a reference.
For the three homology models, docking screens were carried out using specifically assembled sets of antagonists and decoys. For β2(β1) and β2(A2A), AUC values of 0.69 and 0.61 were obtained, respectively (Table 3), whereas for A2A(β2), the least accurate model, the recall of known antagonists on the basis of scoring, was close to a random selection (Table 3). Hence, compound recall for homology models was lower than for the corresponding X-ray structure and dependent on the accuracy of the models, consistent with our expectation.
Table 3. Docking Screens of In-House Homology Modelsa.
| AUC |
Ef10% |
||||||
|---|---|---|---|---|---|---|---|
| protocol | reference pose | β2(β1) | β2(A2A) | A2A(β2) | β2(β1) | β2(A2A) | A2A(β2) |
| FF scoring | none | 0.69 | 0.61 | 0.49 | 3.48 | 1.74 | 1.08 |
| 3D similarity | Ind. Fit | 0.70 | 0.79 | 0.65 | 5.22 | 4.35 | 2.97 |
| Top 3 S. | 0.69 | 0.79 | 0.50 | 5.00 | 4.09 | 0.83 | |
| Top 3 Dif. | 0.82 | 0.76 | 0.76 | 5.45 | 3.18 | 4.72 | |
| PLIF similarity | Ind. Fit | 0.63 | 0.47 | 0.40 | 3.92 | 1.74 | 0.27 |
| Top 3 S. | 0.60 | 0.43 | 0.52 | 3.18 | 1.36 | 1.94 | |
| Top 3 Dif. | 0.62 | 0.50 | 0.53 | 1.82 | 2.73 | 1.67 | |
Reported is the recall performance for docking into different homology models using alternative ranking schemes. For 3D and PLIF similarity, three different reference pose schemes are evaluated. “Ind. Fit” stands for induced fit, “Top 3 S.” refers to the three top-scoring ligand docking poses, and “Top 3 Dif.” to three dissimilar docking poses. Results for the best performing methods are in bold.
Next, docking trials were carried out using the induced-fit docking poses of carazolol and ZM241385 described above as reference binding modes. In the case of ZM241385, only the core fragment composed by the triazolotriazine core and furan ring was considered, which dominated the 3D similarity calculations on X-ray templates.28 For all three models, an increase in compound recall and early enrichment was observed for 3D similarity ranking compared to that of scoring, as reported in Figure 1B–D and Table 3.
For the β2(β1) and β2(A2A) models, the use of induced-fit docking poses as a reference for 3D similarity calculations resulted in AUC values of 0.70 and 0.79, respectively, and even for A2A(β2) a value of 0.65, although scoring was in this case not better than random selection. By contrast, PLIF scoring only produced an enrichment for β2(β1), with an AUC value of 0.63, but was below random selection in the other cases, which further illustrated the difficulties to score approximate interactions; a ranking strategy we consider unsuitable for models. In contrast, 3D similarity calculations were successful. Even ligands displaced in homology models relative to their crystallographic binding modes, as shown in Figure 2, were sufficient to guide compound selection on the basis of 3D similarity and achieve better enrichment than energy scoring. Thus, as long as the orientation of a reference ligand within the binding site was at least approximately correct, 3D similarity calculations were robust and tolerant to limited inaccuracies when using homology models and hypothetical complexes.
3.4. Multiple Reference Poses
In light of the positive results obtained for individual ligand poses, we also asked the question whether the use of multiple poses might further improve compound ranking. Taking inherent accuracy limitations into account, multiple poses further increase the degree of fuzziness underlying similarity calculations. If multiple poses were used, it would be possible to select for each docked compound the pose yielding the highest 3D similarity values and use this value for compound ranking. This scenario corresponded to a nearest-neighbor (1-NN) search in the pose space. Accordingly, it might be possible to balance inaccuracies associated with single putative binding modes.
To test this hypothesis, preferred binding modes were collected for the reference ligands carazolol and ZM241385 using rigid receptor docking into the models and two alternative sets of three poses each were assembled as references for 1-NN calculations. The first set consisted of the three best-scoring binding modes (Top 3 S.), regardless of their structural relationships, and the second set consisted of the three poses with the largest RMSD values among the precomputed binding modes (Top 3 Dif.) The idea underlying the generation of the second set was further increasing binding site coverage with poses for 1-NN calculations.
Ranking by 3D similarity to these pose sets produced different results. Whereas the use of the Top 3 S. sets did not lead to a further improvement in compound ranking compared to that of the individual ligand-binding modes, the use of Top 3 Dif. sets resulted in a notable improvement for β2(β1) and A2A(β2), as reported in Figure 1A–C and Table 3. For β2(A2A), recall performance remained essentially constant when using single or multiple ligand poses. For β2(β1) and A2A(β2), large AUC values of 0.82 and 0.76 were obtained, respectively, together with large early enrichment factors (5.45 and 4.72, respectively). Hence, overall, the use of Top 3 Dif. pose sets was the preferred strategy for compound ranking.
These results suggest that an enhanced conformational sampling of reference poses may be beneficial for compound ranking. A potential extension of this approach may include the generation of reference poses via molecular dynamics or Monte Carlo simulations. This would also enable sampling different conformations of both the ligand and the receptor, thus partly accounting for protein flexibility.
3.5. Docking Screen of an External Model
To further assess the use of multiple ligand-binding modes for compound ranking, we also applied the preferred Top 3 Dif. strategy to an externally derived homology model of a GPCR. For this purpose, a model of the 5-HT6 receptor was selected (Figure 3E), another topical drug target.48,49 Structures of two other subtypes of the 5-HT receptor, including 5-HT1B and 5-HT2B, were reported in complex with agonists,50,51 but the structure of 5-HT6 is currently unknown. In addition, compared with our in-house homology models, the 5-HT6 model was generated from multiple templates using a different computational protocol.37 Given the absence of an X-ray structure, the accuracy of this model remained unknown.
For 5-HT6, a set of 35 antagonists and 2350 decoys was assembled and used for docking into the putative binding pocket of the model. Reference binding modes were obtained by generating Top 3 Dif. docking poses of the known antagonist, Ro 04-6790 (Figure 3F), one of the first 5-HT6 selective antagonists that was discovered.52 Three-dimensional similarity-based ranking resulted in an AUC of 0.75 and Ef10% of 3.53 (Table 4). As a control, force field-based scoring performed surprisingly well for this model (in fact, better than that observed for the other GPCR models), with an AUC of 0.77 and Ef10% of 3.14, hence yielding overall comparable results (Table 4). This trend was reflected by the equivalent BEDROC values measured for the two approaches (Table 4). Nonetheless, 3D similarity calculations resulted in higher enrichment of known antagonists within the first third of the ranking (Figure 4D).
Table 4. Docking Screen of the External Homology Model of the 5-HT6 Receptora.
| protocol | reference pose | AUC | Ef1% | Ef10% | BEDROC |
|---|---|---|---|---|---|
| FF scoring | none | 0.77 | 5.71 | 3.14 | 0.22 |
| 3D similarity | Top 3 Dif. | 0.75 | 5.88 | 3.53 | 0.22 |
Recall performance is compared for docking into the homology model of the 5-HT6 receptor on the basis of best force field energy scoring and the preferred “Top 3 Dif.” 3D similarity pose strategy. Ef1% and BEDROC (α = 20.0) are reported as an additional performance assessment. Results for the best performing methods are in bold.
Figure 4.

ROC plots for ranking based on similarity to three different docking poses. Yellow curves represent the results for compound ranking on the basis of 3D similarity calculations relative to three different docking poses of carazolol (panels A and B), a fragment of ZM241385 (consisting of the triazolotriazine core and the furan ring; panel C), or Ro 04-6790 (panel D). For comparison, green curves represent the results for PLIF-based compound ranking by using the same reference poses as before and orange curves the results for the London dG scoring function. The blue lines provide a reference for random compound selection.
3.6. Control Calculations
As additional control calculations, each of the 23 antagonists in the β2 data set was docked into the β2 X-ray structure and homology models and used as a reference for single-pose 3D similarity calculations. A consistent enrichment of active compounds was observed, with average AUC values over all of the 23 trials ranging from 0.60 for β2(β1) to 0.78 for β2 X-ray structure. Thus, these calculations demonstrated that 3D similarity calculations did not depend on individual antagonists used as references. However, inverting the orientations of reference binding modes within the binding site in a “head-to-tail” manner by 180° mostly abolished the enrichment of active compounds, demonstrating that at least approximately correct ligand orientations were essential for fuzzy 3D similarity calculations.
A correlation analysis was carried out between the 3D similarity measured for all of the compounds docked into the β2 X-ray structure by taking the crystallographic binding mode of carazolol as reference and 2D similarity to the same ligand on the basis of ECFP4 fingerprints. A low correlation coefficient (r = 0.29) was obtained. This finding was consistent with previous studies, indicating frequent low correlation of 3D and 2D ligand similarities.27,43
4. Conclusions
Scoring and compound ranking continue to be limiting factors of docking screens. While docking algorithms have become increasingly effective over the years, it continues to be difficult to separate active from inactive compounds in rankings. As a consequence, potential alternatives to force field energy scoring are considered. Among these is the calculation of 3D similarity of test compounds relative to binding modes of known ligands, for which proof-of-principle has been established previously. Although this approach has been firmly rooted in X-ray crystallography to provide reference binding modes, we have investigated herein whether it might be further extendable to docking tasks wherein accuracy is principally limited, that is, when homology models are used as docking templates. Despite accuracy limitations, the use of homology models is relevant for the practice of structure-based virtual screening, especially when GPCRs are targeted. Perhaps provocatively, we have asked the question whether putative reference binding modes placed into homology models might be useful to guide compound ranking and designed a study to investigate this question in detail. Therefore, the approach reported herein deliberately introduced fuzziness into 3D similarity assessment at the level of modeled binding modes. Success or failure of such calculations was essentially unpredictable. However, for different GPCR models, our analysis revealed that fuzzy 3D similarity calculations were indeed capable of further enriching active compounds at high-ranking positions compared to that of other scoring schemes, as long as modeled binding modes and orientations were at least approximately correct. Moreover, ensembles of multiple structurally diverse poses in combination with the nearest-neighbor similarity calculations were overall more effective in compound ranking than single binding modes, which further increased the fuzziness of the approach. Taken together, the findings reported herein indicate that fuzzy binding mode resemblance can be successfully exploited in docking screens, even in instances in which no crystallographic information is available, and suggest the use of pose ensembles for compound selection from GPCR homology models as an alternative to scoring.
Acknowledgments
We thank the OpenEye Scientific Software, Inc., for providing a free academic license of the OpenEye toolkit and Chemical Computing Group, Inc., for academic teaching licenses of the Molecular operating Environment.
Author Contributions
The study was carried out and the manuscript written with contributions of all authors. All authors have approved the final version of the manuscript.
The authors declare no competing financial interest.
References
- Irwin J. J.; Shoichet B. K. Docking Screens for Novel Ligands Conferring New Biology. J. Med. Chem. 2016, 59, 4103–4120. 10.1021/acs.jmedchem.5b02008. [DOI] [PMC free article] [PubMed] [Google Scholar]
- Lavecchia A.; Di Giovanni C. Virtual Screening Strategies in Drug Discovery: A Critical Review. Curr. Med. Chem. 2013, 20, 2839–2860. 10.2174/09298673113209990001. [DOI] [PubMed] [Google Scholar]
- Kairys V.; Fernandes M. X.; Gilson M. Screening Drug-Like Compounds by Docking to Homology Models: a systematic Study. J. Chem. Inf. Model. 2006, 46, 365–379. 10.1021/ci050238c. [DOI] [PubMed] [Google Scholar]
- Ferrara P.; Jacoby E. Evaluation of the Utility of Homology Models in High Throughput Docking. J. Mol. Model. 2007, 13, 897–905. 10.1007/s00894-007-0207-6. [DOI] [PubMed] [Google Scholar]
- Fan H.; Irwin J. J.; Webb B. M.; Klebe G.; Shoichet B. K.; Sali A. Molecular Docking Screens Using Comparative Models of Proteins. J. Chem. Inf. Model. 2009, 49, 2512–2527. 10.1021/ci9003706. [DOI] [PMC free article] [PubMed] [Google Scholar]
- Kobilka B. K. G. Protein Coupled Receptor Structure and Activation. Biochim. Biophys. Acta, Biomembr. 2007, 1768, 794–807. 10.1016/j.bbamem.2006.10.021. [DOI] [PMC free article] [PubMed] [Google Scholar]
- Kobilka B. K.; Schertler G. F. X. New G-Protein-Coupled Receptor Crystal Structures: Insights and Limitations. Trends Pharmacol. Sci. 2008, 29, 79–83. 10.1016/j.tips.2007.11.009. [DOI] [PubMed] [Google Scholar]
- Rosenbaum D. M.; Rasmussen S. G.; Kobilka B. K. The Structure and Function of G-Protein-Coupled Receptors. Nature 2009, 459, 356–363. 10.1038/nature08144. [DOI] [PMC free article] [PubMed] [Google Scholar]
- Tautermann C. S. GPCR Structures in Drug Design, Emerging Opportunities with New Structures. Bioorg. Med. Chem. Lett. 2014, 24, 4073–4079. 10.1016/j.bmcl.2014.07.009. [DOI] [PubMed] [Google Scholar]
- Weil T.; Renner S. Homology Model-Based Virtual Screening for GPCR Ligands Using Docking and Target-Biased Scoring. J. Chem. Inf. Model. 2008, 48, 1104–1117. 10.1021/ci8000265. [DOI] [PubMed] [Google Scholar]
- Shoichet B. K.; Kobilka B. K. Structure-Based Drug Screening for G-Protein-Coupled Receptors. Trends Pharmacol. Sci. 2012, 33, 268–272. 10.1016/j.tips.2012.03.007. [DOI] [PMC free article] [PubMed] [Google Scholar]
- Carlsson J.; Coleman R. G.; Setola V.; Irwin J. J.; Fan H.; Schlessinger A.; Sali A.; Roth B. L.; Shoichet B. K. Ligand Discovery from a Dopamine D3 Receptor Homology Model and Crystal Structure. Nat. Chem. Biol. 2011, 7, 769–778. 10.1038/nchembio.662. [DOI] [PMC free article] [PubMed] [Google Scholar]
- Becker O. M.; Shacham S.; Marantz Y.; Noiman S. Modeling the 3D Structure of GPCRs: Advances and Application to Drug Discovery. Curr. Opin. Drug Discovery Dev. 2003, 6, 353–361. [PubMed] [Google Scholar]
- Costanzi S. On the Applicability of GPCR Homology Models to Computer-Aided Drug Discovery: A Comparison between in Silico and Crystal structures of the β2-Adrenergic Receptor. J. Med. Chem. 2008, 51, 2907–2914. 10.1021/jm800044k. [DOI] [PMC free article] [PubMed] [Google Scholar]
- Kitchen D. B.; Decornez H.; Furr J. R.; Bajorath J. Docking and Scoring in Virtual Screening for Drug Discovery: Methods and Applications. Nat. Rev. Drug Discovery 2004, 3, 935–949. 10.1038/nrd1549. [DOI] [PubMed] [Google Scholar]
- Moitessier N.; Englebienne P.; Lee D.; Lawandi J.; Corbeil A. C. Towards the Development of Universal, Fast and Highly Accurate Docking/Scoring Methods: A Long Way to Go. Br. J. Pharmacol. 2008, 153, S7–S26. 10.1038/sj.bjp.0707515. [DOI] [PMC free article] [PubMed] [Google Scholar]
- Huang S.-Y.; Grinter S. Z.; Zou X. Scoring Functions and Their Evaluation Methods for Protein–ligand Docking: Recent Advances and Future Directions. Phys. Chem. Chem. Phys. 2010, 12, 12899–12908. 10.1039/c0cp00151a. [DOI] [PMC free article] [PubMed] [Google Scholar]
- Wang J. C.; Lin J. H. Scoring Functions for Prediction of Protein-Ligand Interactions. Curr. Pharm. Des. 2013, 19, 2174–2182. 10.2174/1381612811319120005. [DOI] [PubMed] [Google Scholar]
- Cleves A. E.; Jain A. N. Knowledge-Guided Docking: Accurate Prospective Prediction of Bound Configurations of Novel Ligands Using Surflex-Dock. J. Comput-Aided Mol. Des. 2015, 29, 485–509. 10.1007/s10822-015-9846-3. [DOI] [PMC free article] [PubMed] [Google Scholar]
- Kooistra A. J.; Vischer H. F.; McNaught-Flores D.; Leurs R.; De Esch I. J.; De Graaf C. Function-Specific Virtual Screening for GPCR Ligands Using a Combined Scoring Method. Sci. Rep. 2016, 6, 28288 10.1038/srep28288. [DOI] [PMC free article] [PubMed] [Google Scholar]
- Drwal M. N.; Griffith R. Combination of Ligand- and Structure-Based Methods in Virtual Screening. Drug Discovery Today: Technol. 2013, 10, e395 10.1016/j.ddtec.2013.02.002. [DOI] [PubMed] [Google Scholar]
- Broccatelli F.; Brown N. Best of Both Worlds: On the Complementarity of Ligand-Based and Structure-Based Virtual Screening. J. Chem. Inf. Model. 2014, 54, 1634–1641. 10.1021/ci5001604. [DOI] [PMC free article] [PubMed] [Google Scholar]
- Maggiora G.; Vogt M.; Stumpfe D.; Bajorath J. Molecular Similarity in Medicinal Chemistry. J. Med. Chem. 2014, 57, 3186–3204. 10.1021/jm401411z. [DOI] [PubMed] [Google Scholar]
- Chen Z.; Tian G.; Wang Z.; Jiang H.; Shen J.; Zhu W. Multiple Pharmacophore Models Combined with Molecular Docking: A Reliable Way for Efficiently Identifying Novel PDE4 Inhibitors with High Structural Diversity. J. Chem. Inf. Model. 2010, 50, 615–625. 10.1021/ci9004173. [DOI] [PubMed] [Google Scholar]
- Pappalardo M.; Shachaf N.; Basile L.; Milardi D.; Zeidan M.; Raiyn J.; Guccione S.; Rayan A. Sequential Application of Ligand and Structure Based Modeling Approaches to Index Chemicals for Their hH4R Antagonism. PLoS One 2014, 9, e109340 10.1371/journal.pone.0109340. [DOI] [PMC free article] [PubMed] [Google Scholar]
- Sastry G. M.; Inakollu V. S. S.; Sherman W. Boosting Virtual Screening Enrichments with Data Fusion: Coalescing Hits from Two-Dimensional Fingerprints, Shape, and Docking. J. Chem. Inf. Model. 2013, 53, 1531–1542. 10.1021/ci300463g. [DOI] [PubMed] [Google Scholar]
- Anighoro A.; Bajorath J. Three-Dimensional Similarity in Molecular Docking: Prioritizing Ligand Poses on the Basis of Experimental Binding Modes. J. Chem. Inf. Model. 2016, 56, 580–587. 10.1021/acs.jcim.5b00745. [DOI] [PubMed] [Google Scholar]
- Anighoro A.; Bajorath J. Binding Mode Similarity Measures for Ranking of Docking Poses: A Case Study on the Adenosine A2A Receptor. J. Comput-Aided Mol. Des. 2016, 30, 447–456. 10.1007/s10822-016-9918-z. [DOI] [PubMed] [Google Scholar]
- Bajorath J. Pushing the Boundaries of Computational Approaches: Special Focus Issue on Computational Chemistry and Computer-Aided Drug Discovery. Future Med. Chem. 2015, 7, 2415–2417. 10.4155/fmc.15.157. [DOI] [PubMed] [Google Scholar]
- Cherezov V.; Rosenbaum D. M.; Hanson M. A.; Rasmussen S. G. F.; Thian F. S.; Kobilka T. S.; Choi H.-J.; Kuhn P.; Weis W. I.; Kobilka B. K.; Stevens R. C. High-Resolution Crystal Structure of an Engineered Human beta2-Adrenergic G Protein-Coupled Receptor. Science 2007, 318, 1258–1265. 10.1126/science.1150577. [DOI] [PMC free article] [PubMed] [Google Scholar]
- Molecular Operating Environment, version 2014.09; Chemical Computing Group, Inc.
- Miller-Gallacher J. L.; Nehmé R.; Warne T.; Edwards P. C.; Schertler G. F. X.; Leslie A. G. W.; Tate C. G. The 2.1 Å Resolution Structure of Cyanopindolol-Bound β1-Adrenoceptor Identifies an Intramembrane Na+ Ion That Stabilises the Ligand-Free Receptor. PLoS One 2014, 9, e92727 10.1371/journal.pone.0092727. [DOI] [PMC free article] [PubMed] [Google Scholar]
- Liu W.; Chun E.; Thompson A. A.; Chubukov P.; Xu F.; Katritch V.; Han G. W.; Roth C. B.; Heitman L. H.; IJzerman A. P.; Cherezov V.; Stevens R. C. Structural Basis for Allosteric Regulation of GPCRs by Sodium Ions. Science 2012, 337, 232–236. 10.1126/science.1219218. [DOI] [PMC free article] [PubMed] [Google Scholar]
- Sievers F.; Wilm A.; Dineen D.; Gibson T. J.; Karplus K.; Li W.; Lopez R.; McWilliam H.; Remmert M.; Söding J.; Thompson J. D.; Higgins D. G. Fast, Scalable Generation of High-Quality Protein Multiple Sequence Alignments Using Clustal Omega. Mol. Syst. Biol. 2011, 7, 539. 10.1038/msb.2011.75. [DOI] [PMC free article] [PubMed] [Google Scholar]
- Sali A.; Blundell T. L. Comparative Protein Modelling by Satisfaction of Spatial Restraints. J. Mol. Biol. 1993, 234, 779–815. 10.1006/jmbi.1993.1626. [DOI] [PubMed] [Google Scholar]
- Isberg V.; Mordalski S.; Munk C.; Rataj K.; Harpsøe K.; Hauser A. S.; Vroling B.; Bojarski A. J.; Vriend G.; Gloriam D. E. GPCRdb: An Information System for G Protein-Coupled Receptors. Nucleic Acids Res. 2016, 44, D356–D364. 10.1093/nar/gkv1178. [DOI] [PMC free article] [PubMed] [Google Scholar]
- Kufareva I.; Katritch V.; et al. Participants of GPCR Dock 2013; Stevens, R. C.; Abagyan, R. Advances in GPCR Modeling Evaluated by the GPCR Dock 2013 Assessment: Meeting New Challenges. Structure 2014, 22, 1120–1139. 10.1016/j.str.2014.06.012. [DOI] [PMC free article] [PubMed] [Google Scholar]
- Bauer M. R.; Ibrahim T. M.; Vogel S. M.; Boeckler F. M. Evaluation and Optimization of Virtual Screening Workflows with DEKOIS 2.0 – A Public Library of Challenging Docking Benchmark Sets. J. Chem. Inf. Model. 2013, 53, 1447–1462. 10.1021/ci400115b. [DOI] [PubMed] [Google Scholar]
- Liu T.; Lin Y.; Wen X.; Jorissen R. N.; Gilson M. K. BindingDB: A Web-Accessible Database of Experimentally Determined Protein–ligand Binding Affinities. Nucleic Acids Res. 2007, 35, D198–D201. 10.1093/nar/gkl999. [DOI] [PMC free article] [PubMed] [Google Scholar]
- Southan C.; Sharman J. L.; Benson H. E.; Faccenda E.; Pawson A. J.; Alexander S. P. H.; Buneman O. P.; Davenport A. P.; McGrath J. C.; Peters J. A.; Spedding M.; Catterall W. A.; Fabbro D.; Davies J. A. NC-IUPHAR. The IUPHAR/BPS Guide to PHARMACOLOGY in 2016: Towards Curated Quantitative Interactions between 1300 Protein Targets and 6000 Ligands. Nucleic Acids Res. 2016, 44, D1054–1068. 10.1093/nar/gkv1037. [DOI] [PMC free article] [PubMed] [Google Scholar]
- Mysinger M. M.; Carchia M.; Irwin J. J.; Shoichet B. K. Directory of Useful Decoys, Enhanced (DUD-E): Better Ligands and Decoys for Better Benchmarking. J. Med. Chem. 2012, 55, 6582–6594. 10.1021/jm300687e. [DOI] [PMC free article] [PubMed] [Google Scholar]
- Anighoro A.; Rastelli G. Enrichment Factor Analyses on G-Protein Coupled Receptors with Known Crystal Structure. J. Chem. Inf. Model. 2013, 53, 739–743. 10.1021/ci4000745. [DOI] [PubMed] [Google Scholar]
- Peltason L.; Bajorath J. Molecular Similarity Analysis Uncovers Heterogeneous Structure-Activity Relationships and Variable Activity Landscapes. Chem. Biol. 2007, 14, 489–497. 10.1016/j.chembiol.2007.03.011. [DOI] [PubMed] [Google Scholar]
- Willett P.; Barnard J. M.; Downs G. M. Chemical Similarity Searching. J. Chem. Inf. Model. 1998, 38, 983–996. 10.1021/ci9800211. [DOI] [Google Scholar]
- Bender A.; Glen R. C. A Discussion of Measures of Enrichment in Virtual Screening: Comparing the Information Content of Descriptors with Increasing Levels of Sophistication. J. Chem. Inf. Model. 2005, 45, 1369–1375. 10.1021/ci0500177. [DOI] [PubMed] [Google Scholar]
- Lätti S.; Niinivehmas S.; Pentikäinen O. T. Rocker: Open Source, Easy-to-use Tool for AUC and Enrichment Calculations and ROC Visualization. J. Cheminform. 2016, 8, 45. 10.1186/s13321-016-0158-y. [DOI] [PMC free article] [PubMed] [Google Scholar]
- Truchon J.-F.; Bayly C. I. Evaluating Virtual Screening Methods: Good and Bad Metrics for the “Early Recognition” Problem. J. Chem. Inf. Model. 2007, 47, 488–508. 10.1021/ci600426e. [DOI] [PubMed] [Google Scholar]
- Ramírez M. J. 5-HT6 Receptors and Alzheimer’s Disease. Alzheimer’s Res. Ther. 2013, 5, 15. 10.1186/alzrt169. [DOI] [PMC free article] [PubMed] [Google Scholar]
- Karila D.; Freret T.; Bouet V.; Boulouard M.; Dallemagne P.; Rochais C. Therapeutic Potential of 5-HT6 Receptor Agonists. J. Med. Chem. 2015, 58, 7901–7912. 10.1021/acs.jmedchem.5b00179. [DOI] [PubMed] [Google Scholar]
- Wang C.; Jiang Y.; Ma J.; Wu H.; Wacker D.; Katritch V.; Han G. W.; Liu W.; Huang X.-P.; Vardy E.; McCorvy J. D.; Gao X.; Zhou X. E.; Melcher K.; Zhang C.; Bai F.; Yang H.; Yang L.; Jiang H.; Roth B. L.; Cherezov V.; Stevens R. C.; Xu H. E. Structural Basis for Molecular Recognition at Serotonin Receptors. Science 2013, 340, 610–614. 10.1126/science.1232807. [DOI] [PMC free article] [PubMed] [Google Scholar]
- Liu W.; Wacker D.; Gati C.; Han G. W.; James D.; Wang D.; Nelson G.; Weierstall U.; Katritch V.; Barty A.; Zatsepin N. A.; Li D.; Messerschmidt M.; Boutet S.; Williams G. J.; Koglin J. E.; Seibert M. M.; Wang C.; Shah S. T. A.; Basu S.; Fromme R.; Kupitz C.; Rendek K. N.; Grotjohann I.; Fromme P.; Kirian R. A.; Beyerlein K. R.; White T. A.; Chapman H. N.; Caffrey M.; Spence J. C. H.; Stevens R. C.; Cherezov V. Serial Femtosecond Crystallography of G Protein-Coupled Receptors. Science 2013, 342, 1521–1524. 10.1126/science.1244142. [DOI] [PMC free article] [PubMed] [Google Scholar]
- Sleight A. J.; Boess F. G.; Bös M.; Levet-Trafit B.; Riemer C.; Bourson A. Characterization of Ro 04-6790 and Ro 63-0563: Potent and Selective Antagonists at Human and Rat 5-HT6 Receptors. Br. J. Pharmacol. 1998, 124, 556–562. 10.1038/sj.bjp.0701851. [DOI] [PMC free article] [PubMed] [Google Scholar]