Abstract
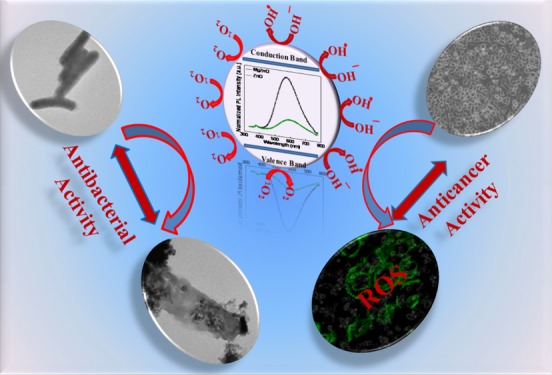
Mg-substituted ZnO nanoparticles (MgZnO NPs) were synthesized by a soft chemical approach and were well-characterized by X-ray diffraction, transmission electron microscopy, UV–visible spectroscopy, and photoluminescence spectroscopy. The absorption and photoluminescence spectra show that substitution of Mg ions results in the widening of the band gap and a significant enhancement in the concentration of defects in ZnO NPs. A systemic study of generation of reactive oxygen species (ROS) under dark, daylight, and visible light conditions suggests that the aqueous suspension of MgZnO NPs generates a higher level of ROS because of the surface defects (oxygen vacancies). This capability of MgZnO NPs makes them a more promising candidate for the inhibition of bacterial growth and for killing of cancer cells as compared to pure ZnO NPs, possibly because of the enhanced interaction and accumulation of MgZnO NPs in the cytoplasm or cell membrane in the presence of both Zn2+ and Mg2+ ions. Further, MgZnO NPs exhibit excellent selective killing of nasopharyngeal carcinoma cells (KB) and cervical cancer cells (HeLa) with minimal toxicity to normal fibroblast cells (L929). The results suggest that the generation of ROS and Zn2+ ions are possibly responsible for the higher activity toward the depolarization of cell membrane potential, the lipid peroxidation in bacterial cells, depolarization of the mitochondrial membrane, and cell cycle arrest in the S phase in cancer cells.
1. Introduction
Uniqueness of metal oxide nanomaterials due to their boosted optical properties finds interesting research areas. These nanomaterials possess potential for a wide range of applications such as optoelectronics, solar energy, sensors, and biomedical fields.1−9 Several metal oxides such as ZnO, TiO2, and Fe2O3 are exploited in a variety of areas, especially for photocatalytic degradation of organic pollutants, inhibition of bacteria, and killing of cancer cells.10−13 Amongst semiconductor materials, ZnO is found to be more versatile and is considered to be a potential material for next-generation biomedicine as an antibacterial and anticancer agent.4−6 Its high redox potential, chemical stability, and higher surface reactivity make it more attractive for a wide range of applications, especially for biomedical applications.1,8 Li et al. proved that ZnO and TiO2 nanoparticles (NPs) are more effective for bacterial growth inhibition in comparison to other oxides NPs.14 They also showed that ZnO and TiO2 NPs are more prone to generate reactive oxygen species than other oxide nanomaterials. Recent studies demonstrate that ZnO is not only effectively used as the antibacterial agent for various microorganisms but also widely explored as an anticancer agent for cancer theranostics both in the absence and in the presence of UV and visible light.4,9,13,15−21 A general perception about ZnO is that it gets easily internalized with the cells via electrostatic interaction and generates enough reactive oxygen species (ROS) causing cell death.22−24 ROS is effective even in dark conditions.22,25,26 Another reason attributed to its antibacterial and anticancer activities is the release of Zn2+ ions, which penetrate the cells and damage cellular components such as DNA and proteins and hence are toxic to the cells causing cell death. Lipovsky et al. and Xu et al. reported the ROS generation, even in the dark, as evident by electron spin resonance (ESR) spectroscopy. They suggested that the surface defects played a vital role in the generation of ROS in the presence as well as in the absence of light.25,26 Recently, Prasanna and Vijayaraghavan also reported the generation of ROS in the aqueous suspension of ZnO in dark.27 However, the factors responsible for ROS generation in ZnO in the dark condition and release of Zn2+ ions are still unknown. Very few studies reported the effect of defects on the generation of ROS and their role in the antibacterial and anticancer properties.28−30 Herein, we propose the mechanism of ROS generation and dissolution of Zn2+ using Mg ions as substituents in ZnO NPs. Mg is an essential element for biological systems, which regulates various biochemical reactions in the body through its role as enzyme cofactors. Its deficiency is carcinogenic. A high level of magnesium inhibits carcinogenesis in the case of solid tumors.31 Also, magnesium and its alloys are widely used as temporary implants, such as orthopedic implants and cardiovascular stents, suggesting its biocompatible nature.32 Therefore, we synthesized Mg-substituted ZnO NPs by a soft chemical approach, which are henceforth referred in the text as MgZnO NPs. The consequence of substitution of Mg ions on the optical and photochemical properties is discussed. Specifically, we have explored the defect concentration in MgZnO NPs and its effect on the generation of ROS under dark, daylight, and visible light at ambient condition and its potential outcome on bacterial inhibition as well as cancer therapy. For antibacterial study, we used Escherichia coli as model bacteria, whereas for the anticancer study, three different cell lines, namely, normal fibroblast cell (L929), cervical cancer cell (HeLa), and nasopharyngeal carcinoma cell (KB) lines were chosen. MgZnO NPs exhibit a defect-mediated ROS generation and toxicity for bacteria and cancer cells.
2. Results and Discussion
2.1. Structural and Microstructural Analysis of ZnO and MgZnO NPs
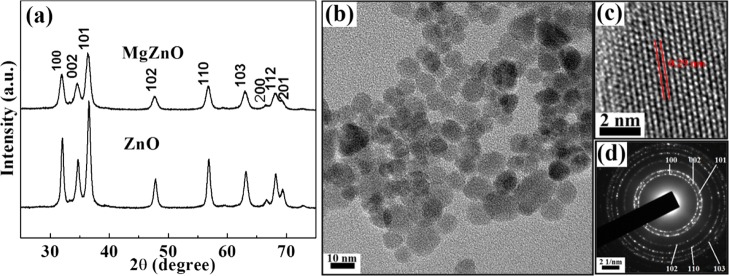
Figure 1a shows the X-ray diffraction (XRD) patterns of ZnO and MgZnO NPs, which exhibit a single-phase hexagonal wurtzite structure without any additional peaks. MgZnO NPs show slightly shifted peaks toward lower angles, indicating the expansion of the unit cell on the substitution of Mg2+ into the ZnO matrix at the Zn2+ site. The intensities of all diffraction peaks decrease and slightly broaden. From this broadening, the estimated average crystallite size is found to be 10 and 7 nm (σ = 10%) for ZnO and MgZnO NPs, respectively, using Debye–Scherrer formula. The decrease in the crystallite size is mainly attributed to the presence of Mg ions, which hinders the growth of crystal grains.29 The shifting and broadening of XRD lines in ZnO NPs on Mg ion substitution strongly suggest that Mg ions are successfully substituted into the ZnO structure at the Zn2+ site. The presence of Mg ions in ZnO is also analyzed by inductively coupled plasma-atomic emission spectroscopy (ICP-AES) and energy-dispersive X-ray analysis, which also confirm the existence of Mg in the ZnO matrix (Table S1, Supporting Information). Furthermore, the crystallite size and lattice strain for different crystallographic orientations (101), (002), and (100) were calculated and are depicted in Table 1.
Figure 1.
(a) XRD patterns of ZnO and MgZnO NPs, TEM micrographs (b) Normal mode, (c) Higher resolution mode, and (d) diffraction pattern of MgZnO NPs.
Table 1. Crystallite Size (nm) and Lattice Strain (%) of Different Crystallographic Orientations of ZnO and MgZnO NPs.
| crystallite
size (nm) |
lattice
strain (%) |
|||||
|---|---|---|---|---|---|---|
| sample name | (101) | (002) | (100) | (101) | (002) | (100) |
| ZnO | 11.7 | 8.0 | 11.4 | 1.18 | 1.56 | 1.06 |
| MgZnO | 8.1 | 7.0 | 8.3 | 1.49 | 1.77 | 1.29 |
As said earlier, the crystallite sizes of ZnO and MgZnO NPs are estimated as 10 and 7 nm (σ = ±10%), respectively. To support this, transmission electron microscopy (TEM) was performed to find the actual visual size of MgZnO NPs. Figure 1b shows the TEM micrograph, whereas Figure 1c gives the high-resolution TEM (high-resolution mode) image for MgZnO NPs. Spherical particles with an average size of about 7–8 nm are observed, indicating that the size of NPs is slightly affected by the substitution of Mg ions. TEM micrographs of ZnO are provided in Figure S1 (Supporting Information). The average interfringe distances of ZnO and MgZnO NPs are measured to be ∼0.26 and 0.29 nm, respectively.
2.2. Absorption and Photoluminescence Spectra of MgZnO NPs
Figure 2a shows the absorption spectra of ZnO and MgZnO NPs. The absorption edge shifted toward lower wavelengths (blue shift) with the incorporation of Mg2+ ions in ZnO. The band gap energies of the ZnO and MgZnO NPs were estimated to be 3.32 and 3.44 eV, respectively. It reveals that the substitution of Mg2+ ions in ZnO can enhance the absorption spectral range and alter the band gap of ZnO. This blue shift in the absorption in MgZnO NPs can be ascribed to the Moss–Burstein band filling effect.28,33 The Fermi level of ZnO is located inside the conduction band, whereas in the case of MgZnO NPs, it gets shifted toward the higher level of the conduction band. This increase may lift the Fermi level into the conduction band and result in a widening of the band gap.
Figure 2.
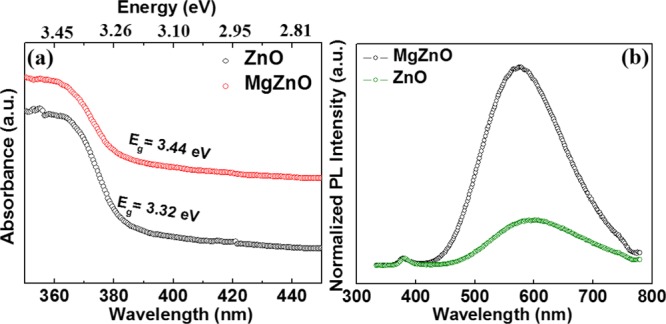
(a) UV–visible absorption and (b) PL spectra of ZnO and MgZnO NPs at room temperature.
Figure 2b shows the photoluminescence (PL) results of ZnO and MgZnO NPs. Two bands were observed in both ZnO and MgZnO NPs. The first band in the UV region is known as near band emission (NBE), and the other band in the visible region is known as defect emission band. The PL spectra exhibit a broad emission peak with a maximum intensity in the yellow emission centered around 590 and 570 nm for ZnO and MgZnO NPs, respectively. It is believed that the yellow-orange emission is related to the defects consisting of oxygen vacancies and zinc interstitials.34,35 This broad emission band partly extends into green and mostly in the yellow and red spectral regions. This could be attributed to the transition of excited photoelectrons from the defect level to the valence level. These emissions are usually due to the presence of structural defects and impurities. As Mg ions are incorporated in ZnO, the NBE peak shifts to a lower region. This blue shift of NBE could be understood on the basis of Burstein–Moss effect. This was also observed in other semiconductors such as silicon- and germanium-doped GaN, Al-doped ZnO, and iodine-doped PbTe.33,36,37 PL spectroscopy also provides sufficient information about the recombination of photoinduced charge carriers, charge carrier trapping, their recombination kinetics, and surface states.38 Previously, it was reported that the intensity of defect emission strongly influences the photocatalytic activity of ZnO.38−40 The shift in the NBE of MgZnO NPs as compared to ZnO is ascribed to the efficient charge separation between charge carriers due to the band gap widening.
2.3. Detection of ROS in MgZnO NPs
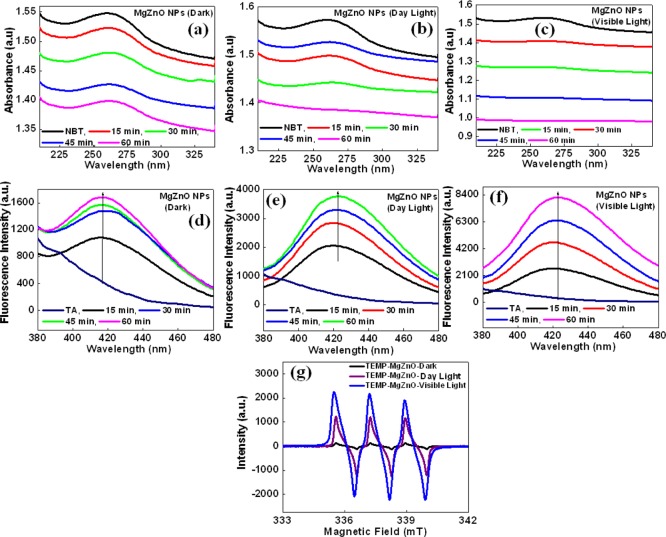
It was reported previously that the surface defects such as oxygen vacancies (oxygen vacancies and interstitial oxygen defects) are the main factors responsible for ROS generation.25,27 Xu et al. and Guo et al. suggested that oxygen vacancies on the surface of ZnO help to generate ROS.26,41 Similarly, Krishnamoorthy et al. reported the generation of ROS in MgO due to the presence of defects or oxygen vacancies at the surface of NPs.42 It was observed from the PL spectra that the surface defects are more in MgZnO NPs as compared to ZnO, and therefore, MgZnO NPs exhibit higher active sites, leading to higher ROS. Therefore, ROS level in MgZnO NPs in aqueous suspension was estimated by fluorescence and absorbance spectroscopies and ESR using terephthalic acid as a hydroxyl radical probe, nitro blue tetrazolium (NBT) as a superoxide radical probe, and spin probe 2,2,6,6-tetramethylpiperidine (TEMP) as a singlet oxygen probe.6,43 These results show that MgZnO NPs are able to generate a higher level of ROS in dark, daylight, and visible light at ambient condition (Figure 3), which makes MgZnO NPs more promising materials for biological applications, especially for the inhibition of microorganisms and cancer therapy. Figure 3a–c shows the UV–visible absorbance spectra of NBT in the aqueous suspension of MgZnO NPs under dark, daylight, and visible light at ambient condition with different time intervals. It was observed that the characteristic absorption peak of NBT at 259 nm shows a slight decrease with time in dark conditions. On the other hand, the peak at 259 nm decreases and its decrease further increases in visible light irradiation with time. The degradation of NBT suggests that MgZnO NPs are able to generate a sufficient amount of •O2– radicals under ambient condition and its amount increases with the irradiation of light. Again, •OH radicals were also detected by fluorescence spectroscopy. Figure 3 shows the typical fluorescence spectra of TAOH under (d) dark condition, (e) daylight, and (f) visible light irradiation at ambient condition. The fluorescence results indicate a significant increase in the fluorescence intensity within 15 min, even in the dark condition (Figure 3d), depicting the spontaneous production of hydroxyl radicals. Further increase in the fluorescence intensity is observed under daylight (room light) and visible light at ambient condition, suggesting the increment in the production of more hydroxyl radicals (Figure 3e,f). Similarly, generation of singlet oxygen was also observed in the ESR spectra of TEMP with MgZnO NPs (Figure 3g). The ROS detection results suggest that MgZnO NPs are capable of producing hydroxyl radicals, superoxide radicals, and singlet oxygen.
Figure 3.
UV–visible absorption spectra of NBT and fluorescence spectra of hydroxyl terephthalic acid in the presence of MgZnO NPs under (a,d) dark and (b,e) daylight (room light) and (c,f) in aqueous suspensions of MgZnO NPs at ambient condition and (g) ESR spectra of TEMP with MgZnO NPs under dark, daylight, and visible light at ambient condition.
2.4. Antibacterial Activity of ZnO and MgZnO NPs
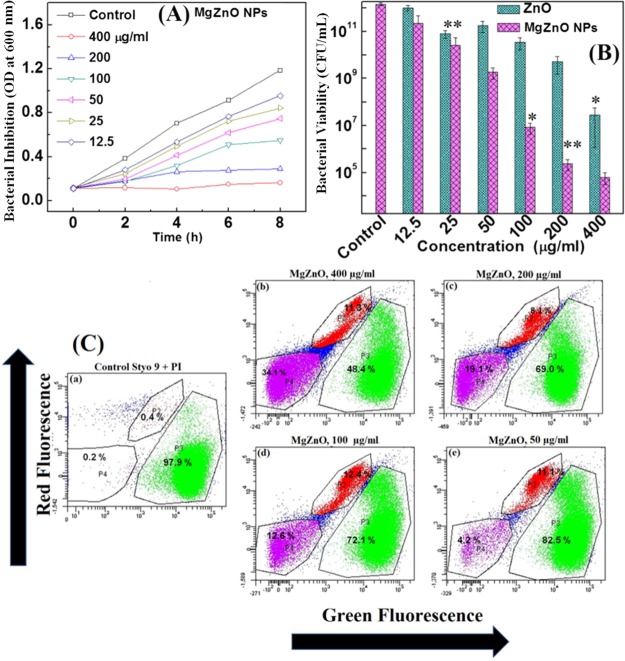
The antibacterial effect of ZnO and MgZnO NPs was investigated by using culture turbidity as a qualitative measure of cell growth, plate counting assay, and FACS analysis. Figure 4A shows the growth inhibition curve of E. coli on treatment with different concentrations of MgZnO NPs. It was observed that with increasing concentrations of MgZnO NPs, the bacterial growth is suppressed as compared to the untreated bacterial cells. The growth of E. coli is completely inhibited on treatment with 400 μg/mL MgZnO NPs, which is known as minimum bacterial concentration. The minimum inhibitory concentration for MgZnO NPs was found to be 12.5 μg/mL. Similarly, the antibacterial effect of ZnO and MgZnO NPs is also evident by the reduction in viability of E. coli in nutrient broth on treatment with the different concentrations of ZnO and MgZnO NPs for 2 h by plate counting assay and shown in Figure 4B.
Figure 4.
(A) Growth inhibition curve of E. coli in the presence of MgZnO NPs, (B) bacterial viability on treatment with ZnO and MgZnO NPs in nutrient broth media, and (C) flow cytometric analysis of E. coli control and treated with 400 and 50 μg/mL MgZnO NPs for 2 h. E. coli was stained with a mixture of SYTO 9 and PI.
Further, the antibacterial behavior of MgZnO NPs is further assessed by the FACS analysis of bacterial cells treated with NPs and stained with SYTO 9 and propidium iodide (PI) as a nucleic acid stain. The former gives green fluorescence, whereas the latter gives red fluorescence. Both dyes have different spectral characteristics and have different penetration abilities to healthy bacterial cells. More specifically, SYTO 9 generally stains all bacteria with intact membranes and with damaged membranes. In contrast to this, PI penetrates only damaged bacterial cell membranes. Therefore, fluorescence of SYTO 9 reduces when both dyes are present. Figure 4C shows the flow cytometric analysis of E. coli (a) control and (b–e) treated with 400 to 50 μg/mL MgZnO NPs for 2 h. The flow cytometric results show the decrease in the green fluorescence (82.5−48.4%) with the increase of the red fluorescence (17.5–51.6%) as the concentration of MgZnO NPs varies from 50 to 400 μg/mL. This suggests that bacterial cells are present more in the dead phase on treatment with MgZnO NPs.
2.5. ROS Detection by 2′,7′-Dichlorodihydrofluorescein diacetate and TBARS Assay
Toxicity of both ZnO and MgZnO NPs may arise because of the generation of ROS and release of Zn2+ ions. The generation of ROS is mainly due to the strong interaction between NPs and cells and higher defect concentration. Figure S2 (Supporting Information) shows the (a) ROS generation and (b) Malondialdehyde (MDA) equivalent after treatment with different concentrations of ZnO and MgZnO NPs. This result suggests that MgZnO NPs generate more ROS as compared to ZnO NPs. To confirm the ROS-mediated antibacterial effect of these NPs, the growth patterns of E. coli on treatment with 400 μg/mL MgZnO NPs in the presence of antioxidants were analyzed. It was thought that the ROS is generated due to the strong interaction of MgZnO NPs with E. coli, which could be scavenged by the antioxidants and release of Zn2+ ions. In this regard, we studied the effect of Zn2+ ions and N-acetylcysteine (NAC) toward the inhibition of antibacterial activity of MgZnO NPs. NAC is a well-known scavenger of hydroxyl radicals and singlet oxygen. The inhibition of the bacterial growth was studied with an equivalent amount of Zn2+ ions present in 400 μg of MgZnO NPs with different concentrations of NAC in culture medium (Figure S3a,b, Supporting Information). This study suggests that the antibacterial activity is due to the release of Zn2+ from MgZnO NPs when they come in contact with the cell membranes. The cell membrane having negative charge mutually attracts positively charged Zn2+ which penetrates into the cell membrane. Another reason is the generation of a higher amount of ROS, which is reflected in the inhibition in the growth curve with the increase in the concentration of NAC from 1 to 8 mg/mL. Growth inhibition of E coli was not much observed with increasing concentration of NAC, suggesting the scavenging of ROS generated during interaction of NPs with bacterial cells in culture media.
2.6. TEM Analysis of E. coli
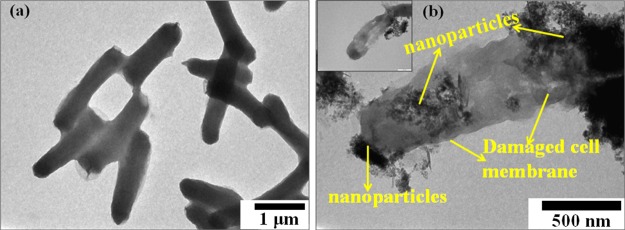
Further, to analyze the interaction of NPs and their impact on the cell membrane potential, TEM analysis was performed and changes in the cell membrane potential were investigated. Figure 5 shows the TEM image of E. coli (a) without treatment and (b) after treatment with MgZnO NPs. The TEM micrographs clearly show the strong interaction and internalization of NPs on the surface of E. coli and inside the bacterial cells. This might damage the cell membrane and make it porous for internalization of NPs in cells, which is also observed as a change in the membrane potential (Figure S4, Supporting Information). This strong interaction between the NPs and the cell wall of E. coli is due to the negatively charged lipopolysaccharides and positively charged Mg2+ and Zn2+ ions, which may allow the NPs to enter inside the cells and enable the breakdown of the cell wall of E. coli.
Figure 5.
TEM images of E. coli: (a) control and (b) after treatment with MgZnO NPs for 4 h (scale bar: (a) 1 μm and (b) 500 nm).
2.7. Anticancer Behavior of ZnO and MgZnO NPs
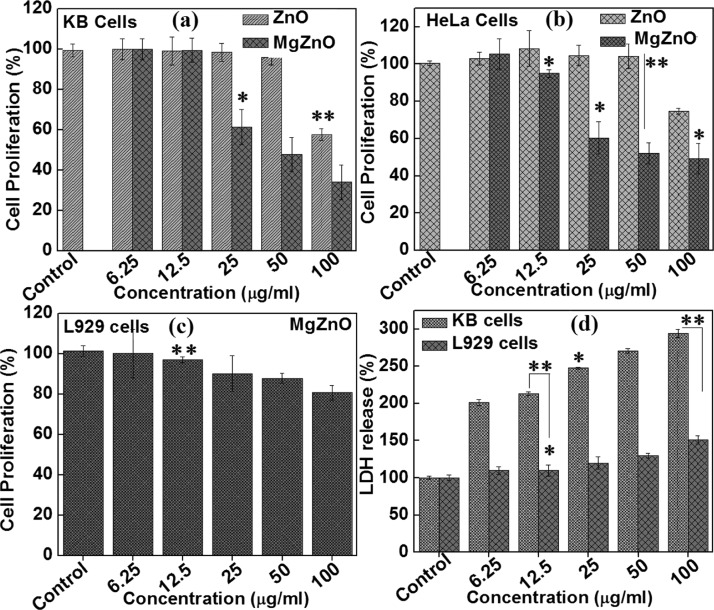
Having seen a strong antibacterial activity of MgZnO NPs, it was thought worthwhile to investigate the anticancer activity, which was explored using KB, HeLa, and L929 cells by performing SRB and lactate dehydrogenase (LDH) assays. A study on the mechanistic toxicity of ZnO and MgZnO NPs against cancer cells and normal cells reveals some unusual features of these materials. Figure 6 displays the cytotoxicity of ZnO and MgZnO NPs against cancer cells and normal cells. No obvious toxicity of ZnO and MgZnO NPs against normal fibroblast cells (L929) is observed, even at higher concentrations of ZnO (100 μg/mL), as shown in Figure 6c. However, these are more sensitive to the cancerous cells, as is evident from the cytotoxicity study in KB and HeLa cells, shown in Figure 6a,b. The IC50 values of MgZnO NPs against HeLa and KB cells were found to be 25 and 50 μg/mL, respectively, after 24 h of exposure. Further, investigating the interaction of particles with the plasma membrane permeability through LDH assay gives the basic mechanistic difference between the toxicity of MgZnO NPs toward cancer cells versus normal cells. Basically, LDH leakage is related to disruption of the plasma membrane. Figure 6d shows the level of LDH leakage from normal cells (L929) and cancer cells (KB) treated with different concentrations of MgZnO NPs. However, after 24 h, the cancer cells release about 2–4 times more LDH as compared to normal cells. It was observed that L929 cells remained intact with no significant leakage of LDH. The morphological changes and loss in membrane integrity on treatment with MgZnO NPs are clearly seen by optical microscopy. Figure S5a–d (Supporting Information) shows the phase contrast images of L929 and KB cells treated with 50 μg/mL MgZnO NPs for 24 h. It can be seen that L929 treated with MgZnO NPs retained normal morphology before and after the treatment (Figure S5a,b, Supporting Information). On the other hand, KB cells exhibit a stressed rounded morphology with a granular cytoplasm and loss among cells at a similar concentration of MgZnO NPs (Figure S5d, Supporting Information).
Figure 6.
Cytotoxicity of (a) KB cells, (b) HeLa cells, and (c) L929 cells and (d) LDH release by KB and L929 cells in culture medium after treatment with MgZnO NPs for 24 h.
2.8. ROS Detection in KB Cells
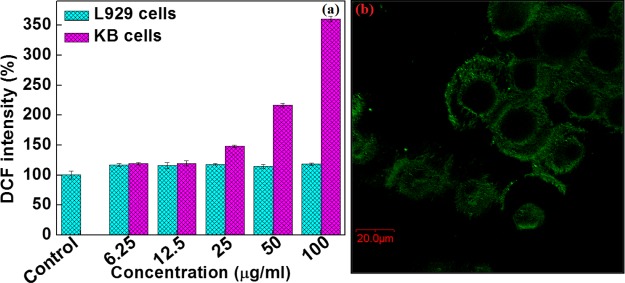
As mentioned above, the NPs show toxicity toward biological systems by their ability to excite the generation of ROS, which develops the oxidative stress and finally leads to cell death. To determine the ROS, 2′,7′-dichlorodihydrofluorescein diacetate (DCFH-DA) assay and confocal microscopy were performed. Figure 7a,b shows the generation of ROS using DCFH-DA dye by fluorescence spectroscopy and confocal image of KB cells. The ROS generation in L929 cells is much less as compared to that in KB cells. From the confocal images, the presence of the green fluorescence in the cells shows intracellular ROS due to the formation of 2′,7′-dichlorofluorescein (DCF). This might be attributed to the interaction and internalization of NPs, which is higher in the KB cells as compared to the L929 cells. The cell walls of cancer cells are more permeable and get disintegrated as compared to the L929 cells, which helps to enhance the particle internalization.
Figure 7.
(a) Intracellular ROS generation in L929 and KB cells and (b) corresponding confocal image of KB cells.
2.9. Apoptotic Cell Analysis of L929 and KB Cells
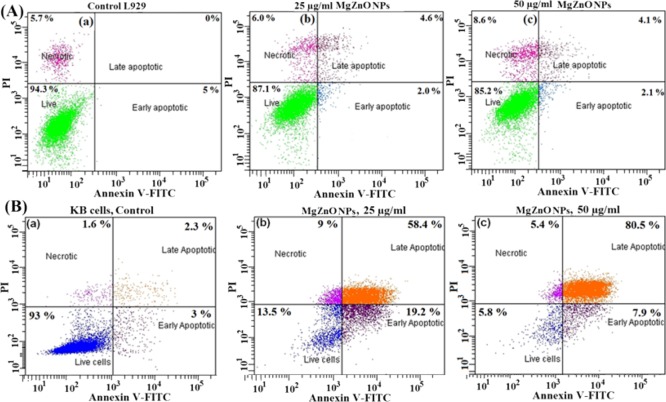
Apoptotic cells are analyzed by FACS analysis using FITC-Annexin and PI staining after treatment with MgZnO NPs. Figure 8A shows FACS analysis of L929 cells: (a) control cells without any treatment and (b,c) cells treated with 25 and 50 μg/mL MgZnO NPs. The FACS results show that only 6.2% cells undergo the apoptotic state on treatment with 50 μg/mL MgZnO NPs and 85.2% cells are alive. L929 cells without any treatment show that 94.3% cells are alive and only 5% cells are in the early apoptotic state. On the other hand, KB cells on treatment with the same concentration shows that ∼88.4% cells are in the apoptotic state and only 5.8% cells are alive, as shown in Figure 8B(a–c). These results show that KB cells are more prone to apoptosis as compared to L929 cells after 24 h of exposure.
Figure 8.
(A) Flow cytogram representing apoptosis assay based on Annexin V-FITC and PI staining of cells. (a) Control and (b,c) L929 cells were treated with 25 and 50 μg/mL MgZnO NPs, respectively, for 24 h. (B) Flow cytogram representing apoptosis assay based on Annexin V-FITC and PI staining of cells: (a) control and (b,c) KB cells treated with 25 and 50 μg/mL MgZnO NPs, respectively, for 24 h.
2.10. Effect of MgZnO NPs on the Mitochondrial Membrane Potential of KB and L929 Cells
Apoptotic cells are further investigated by measuring the mitochondrial membrane potential (MMP) of L929 cells and KB cells after treatment with MgZnO NPs using a JC-10 dye and analyzed by FACS, fluorescence spectroscopy, and confocal microspectroscopy. Figure S6a,b (Supporting Information) shows the mitochondrial membrane potential of L929 cells using JC-10 dye. For L929 cells, even after treatment with 50 μg/mL MgZnO NPs for 24 h, ∼ 94.5% cells (P2 region) retained MMP (Figure S6a, Supporting Information), whereas in the case of cancer cells, ∼ 82.3% cells (P3 region) showed depolarized mitochondria with the same concentration of MgZnO NPs (Figure 9b). Similarly, depolarization of mitochondria on treatment with MgZnO NPs is also confirmed by fluorescence spectroscopy. The marked decrease in MMP is evident by a shift in JC-10 fluorescence from red to green. It was observed that 66.7% of cells undergo a change to a depolarized state on treatment with 25 μg/mL MgZnO NPs as compared to the control cells (Figure 9c). Control cells show red fluorescence of JC-10 aggregates, whereas the apoptotic cells show green fluorescence of JC-10 monomers. Thus, the cells treated with MgZnO NPs exhibit an increase in the bright green fluorescence with a marked decrease in the red fluorescence, indicating a loss of MMP. Similarly, Figure S7A (Supporting Information) shows the confocal image of control KB cells without any treatment, which exhibit only red fluorescence with very small green fluorescence. Figure S7B (Supporting Information) shows the confocal images of KB cells after treatment with 50 μg/mL MgZnO NPs: (a) bright field, (b) red fluorescence, and (c) green fluorescence images. On treatment with MgZnO NPs, the confocal image of KB cells shows the depolarized membrane potential and more green fluorescence with very less red fluorescence. However, no such effect was observed in the control KB cells. This, therefore, suggests that MgZnO NPs destabilize the MMP in cancer cells because of the generation of ROS and release of Zn2+ ions.44−46 Further, the dissolution of ZnO and MgZnO NPs at two different pHs (5.4 and 7.4) incubated at 37 °C for 24 h was analyzed by ICP-AES analysis (Figure S8, Supporting Information). The dissolution assay of ZnO and MgZnO NPs revealed ∼80 and 100% of Zn2+ ions at pH 5.4, whereas ∼17 and 40% of Zn2+ ions were observed at a normal pH of 7.4 for ZnO and MgZnO NPs. These results suggest that both MgZnO and ZnO NPs released Zn2+ ions. However, release of Zn2+ ions is more in MgZnO NPs as compared to ZnO NPs. Metal ion dissolution, in the present case, is more prominent because of the high surface reactivity of the NPs. Thus, MgZnO NPs change the membrane potential of cancer cells and force them to undergo apoptosis.
Figure 9.
Flow cytogram and red/green fluorescence depicting the changes in MMP (ζ) of KB cells (a,b) treated with 0 and 25 μg/mL MgZnO NPs for 24 h. In the flow cytogram, P2 scatter region (red dots) indicates cells with polarized mitochondrial membrane, whereas P3 scatter region (green dots) denotes cells with depolarized mitochondrial membrane. (c) Change in red/green ratio on treatment with different concentrations of ZnO and MgZnO NPs.
2.11. Cell Cycle Analysis of L929 and KB Cells
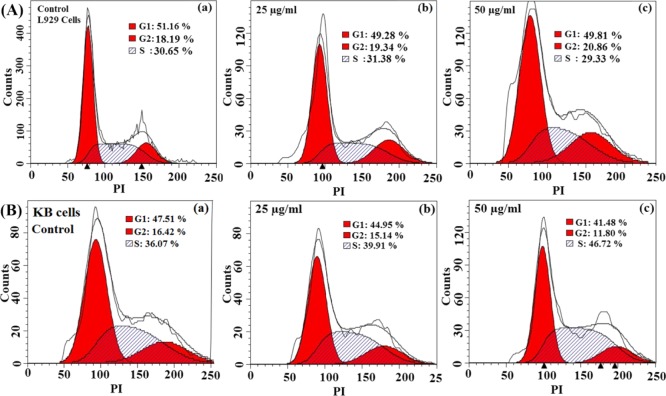
Cell cycle progression of KB and L929 cells was analyzed by the DNA contents after treatment with MgZnO NPs. Cell cycle is usually divided into to three main parts: gap1 (G1), S phase, and the G2 phase. Thus, the toxic effect of MgZnO NPs was further obvious for the cell cycle analysis to find out cell cycle arrest and DNA damage. The influence of MgZnO NPs on the cell cycle was analyzed by flow cytometry. Figure 10A shows the cell cycle analysis of L929 cells: (a) control, (b) treated with 25 and (c) 50 μg/mL MgZnO NPs. Cell cycle of L929 cells is not much affected by MgZnO NPs. Figure 10B shows the cell cycle of KB cells (a) control without any treatment and on treatment with two different concentrations (b) 25 and (c) 50 μg/mL MgZnO NPs for 24 h. From the cell cycle analysis, it was observed that cell population in the S phase increases as compared to the control in KB cells, showing a concentration-dependent S phase arrest. However, the major cell population is observed in the G1 phase in the KB controls, whereas a decrease in G1 population accompanied by an increase in the S phase population is detected in MgZnO NP-treated KB cells. The proportion of cells in the G2/M phase is less affected as compared to the S phase population. On the other hand, no such effect has been observed in the L929 cells after the treatment with the same composition, concentration, and time. Specifically, MgZnO NPs strongly interact with the cancer cells and produce oxidative stress due to the generation of ROS and depolarization of the mitochondrial membrane, leading to apoptosis. The present study suggests that the presence of defect states/surface oxygen vacancies on the surface of MgZnO NPs is responsible for the overall mechanism of cell death in bacteria and cancer cells.
Figure 10.
(A) Effect of MgZnO NPs on the cell cycle of L929 cells: (a) control L929 cells without any treatment and (b,c) L929 cells treated with 25 to 50 μg/mL MgZnO NPs for 24 h, respectively. (B) MgZnO NPs inducing cell cycle arrest in the S phase in KB cells: (a) control KB cells without any treatment and (b,c) KB cells treated with 25–50 μg/mL MgZnO NPs for 24 h, respectively.
3. Summary
Defect-enriched MgZnO NPs were demonstrated here as an antibacterial and anticancer agent. Characterization results from PL and ROS detection indicate the existence of defects in MgZnO NPs, leading to the more ROS generation. Moreover, the high surface defects of MgZnO NPs exhibit more surface-active sites for higher ROS generation and are responsible for the inhibition of bacterial growth and killing of cancer cells as compared to ZnO NPs. The antibacterial studies show that MgZnO NPs interact strongly with the cell wall of E. coli, make the cell membrane permeable, and oxidize the membrane lipid. It was also observed that MgZnO NPs are more toxic to cancer cells than to normal cells.
4. Materials and Methods
MgZnO NPs were synthesized by refluxing 50 mM zinc acetate dehydrate and NaOH. After the competition of the reaction, the solution was cooled down to room temperature, and the resulting precipitates were washed several times with Milli-Q water and acetone. The samples were dried at 80 °C for further characterizations. Details of all experimental procedures are described in the Supporting Information.
Acknowledgments
J.G. acknowledges SERB, India, for the award of a National Post-Doctoral Fellowship. The financial support by the Nano Mission of DST, Government of India, is gratefully acknowledged. The authors are thankful to the Centre for Research in Nanotechnology & Science (CRNTS) Central Facility, IIT Bombay, for TEM analysis.
Supporting Information Available
The Supporting Information is available free of charge on the ACS Publications website at DOI: 10.1021/acsomega.7b01953.
Details of experimental procedures, TEM micrographs, ROS generation and bacterial inhibition, FACS data, optical micrographs of treated cells, FACS and confocal images depicting changes in MMP of cells, and release of Zn ions at different pHs (PDF)
Author Present Address
† Chemistry Division, Bhabha Atomic Research Centre, Mumbai 400085, India (J.G.).
The authors declare no competing financial interest.
Supplementary Material
References
- Pradel K. C.; Ding Y.; Wu W.; Bando Y.; Fukata N.; Wang Z. L. Optoelectronic Properties of Solution Grown ZnO n-p or p-n Core–Shell Nanowire Arrays. ACS Appl. Mater. Interfaces 2016, 8, 4287–4291. 10.1021/acsami.5b11034. [DOI] [PubMed] [Google Scholar]
- Scheunemann D.; Wilken S.; Parisi J.; Borchert H. Charge carrier loss mechanisms in CuInS2/ZnO nanocrystal solar cells. Phys. Chem. Chem. Phys. 2016, 18, 16258–16265. 10.1039/c6cp01015f. [DOI] [PubMed] [Google Scholar]
- Yoo R.; Cho S.; Song M.-J.; Lee W. Highly sensitive gas sensor based on Al-doped ZnO nanoparticles for detection of dimethyl methylphosphonate as a chemical warfare agent simulant. Sens. Actuators, B 2015, 221, 217–223. 10.1016/j.snb.2015.06.076. [DOI] [Google Scholar]
- Singh S.; Barick K. C.; Bahadur D. Shape-controlled hierarchical ZnO architectures: photocatalytic and antibacterial activities. CrystEngComm 2013, 15, 4631–4639. 10.1039/c3ce27084j. [DOI] [Google Scholar]
- Sasidharan A.; Chandran P.; Menon D.; Raman S.; Nair S.; Koyakutty M. Rapid dissolution of ZnO nanocrystals in acidic cancer microenvironment leading to preferential apoptosis. Nanoscale 2011, 3, 3657–3669. 10.1039/c1nr10272a. [DOI] [PubMed] [Google Scholar]
- Gupta J.; Bhargava P.; Bahadur D. Fluorescent ZnO for imaging and induction of DNA fragmentation and ROS-mediated apoptosis in cancer cells. J. Mater. Chem. B 2015, 3, 1968–1978. 10.1039/c4tb01661k. [DOI] [PubMed] [Google Scholar]
- Gupta J.; Barick K. C.; Bahadur D. Defect mediated photocatalytic activity in shape-controlled ZnO nanostructures. J. Alloys Compd. 2011, 509, 6725–6730. 10.1016/j.jallcom.2011.03.157. [DOI] [Google Scholar]
- Becker J.; Raghupathi K. R.; Pierre J. S.; Zhao D.; Koodali R. T. Tuning of the Crystallite and Particle Sizes of ZnO Nanocrystalline Materials in Solvothermal Synthesis and Their Photocatalytic Activity for Dye Degradation. J. Phys. Chem. C 2011, 115, 13844–13850. 10.1021/jp2038653. [DOI] [Google Scholar]
- Punnoose A.; Dodge K.; Rasmussen J. W.; Chess J.; Wingett D.; Anders C. Cytotoxicity of ZnO Nanoparticles Can Be Tailored by Modifying Their Surface Structure: A Green Chemistry Approach for Safer Nanomaterials. ACS Sustainable Chem. Eng. 2014, 2, 1666–1673. 10.1021/sc500140x. [DOI] [PMC free article] [PubMed] [Google Scholar]
- Rozhkova E. A.; Ulasov I.; Lai B.; Dimitrijevic N. M.; Lesniak M. S.; Rajh T. A High-Performance Nanobio Photocatalyst for Targeted Brain Cancer Therapy. Nano Lett. 2009, 9, 3337–3342. 10.1021/nl901610f. [DOI] [PMC free article] [PubMed] [Google Scholar]
- Dimitrijevic N. M.; Rozhkova E.; Rajh T. Dynamics of Localized Charges in Dopamine-Modified TiO2 and their Effect on the Formation of Reactive Oxygen Species. J. Am. Chem. Soc. 2009, 131, 2893–2899. 10.1021/ja807654k. [DOI] [PubMed] [Google Scholar]
- An Q.; Sun C.; Li D.; Xu K.; Guo J.; Wang C. Peroxidase-Like Activity of Fe3O4@Carbon Nanoparticles Enhances Ascorbic Acid-Induced Oxidative Stress and Selective Damage to PC-3 Prostate Cancer Cells. ACS Appl. Mater. Interfaces 2013, 5, 13248–13257. 10.1021/am4042367. [DOI] [PubMed] [Google Scholar]
- Lee S.-F.; Zhu X.-M.; Wang Y.-X. J.; Xuan S.-H.; You Q.; Chan W.-H.; Wong C.-H.; Wang F.; Yu J. C.; Cheng C. H. K.; Leung K. C.-F. Ultrasound, pH, and Magnetically Responsive Crown-Ether-Coated Core/Shell Nanoparticles as Drug Encapsulation and Release Systems. ACS Appl. Mater. Interfaces 2013, 5, 1566–1574. 10.1021/am4004705. [DOI] [PubMed] [Google Scholar]
- Li Y.; Zhang W.; Niu J.; Chen Y. Mechanism of Photogenerated Reactive Oxygen Species and Correlation with the Antibacterial Properties of Engineered Metal-Oxide Nanoparticles. ACS Nano 2012, 6, 5164–5173. 10.1021/nn300934k. [DOI] [PubMed] [Google Scholar]
- Nair S.; Sasidharan A.; Rani V. V. D.; Menon D.; Nair S.; Manzoor K.; Raina S. Role of size scale of ZnO nanoparticles and microparticles on toxicity toward bacteria and osteoblast cancer cells. J. Mater. Sci.: Mater. Med. 2009, 20, 235–241. 10.1007/s10856-008-3548-5. [DOI] [PubMed] [Google Scholar]
- Dutta R. K.; Nenavathu B. P.; Gangishetty M. K.; Reddy A. V. R. Antibacterial effect of chronic exposure of low concentration ZnO nanoparticles on E. coli. J. Environ. Sci. Health, Part A: Toxic/Hazard. Subst. Environ. Eng. 2013, 48, 871–878. 10.1080/10934529.2013.761489. [DOI] [PubMed] [Google Scholar]
- Premanathan M.; Karthikeyan K.; Jeyasubramanian K.; Manivannan G. Selective toxicity of ZnO nanoparticles toward Gram-positive bacteria and cancer cells by apoptosis through lipid peroxidation. Nanomedicine 2011, 7, 184–192. 10.1016/j.nano.2010.10.001. [DOI] [PubMed] [Google Scholar]
- Hui A.; Liu J.; Ma J. Synthesis and morphology-dependent antimicrobial activity of cerium doped flower-shaped ZnO crystallites under visible light irradiation. Colloids Surf., A 2016, 506, 519–525. 10.1016/j.colsurfa.2016.07.016. [DOI] [Google Scholar]
- Sehmi S. K.; Noimark S.; Pike S. D.; Bear J. C.; Peveler W. J.; Williams C. K.; Shaffer M. S. P.; Allan E.; Parkin I. P.; MacRobert A. J. Enhancing the Antibacterial Activity of Light-Activated Surfaces Containing Crystal Violet and ZnO Nanoparticles: Investigation of Nanoparticle Size, Capping Ligand, and Dopants. ACS Omega 2016, 1, 334–343. 10.1021/acsomega.6b00017. [DOI] [PMC free article] [PubMed] [Google Scholar]
- Ismail A. F. M.; Ali M. M.; Ismail L. F. M. Photodynamic therapy mediated antiproliferative activity of some metal-doped ZnO nanoparticles in human liver adenocarcinoma HepG2 cells under UV irradiation. J. Photochem. Photobiol., B 2014, 138, 99–108. 10.1016/j.jphotobiol.2014.04.006. [DOI] [PubMed] [Google Scholar]
- Demir E.; Akça H.; Kaya B.; Burgucu D.; Tokgün O.; Turna F.; Aksakal S.; Vales G.; Creus A.; Marcos R. Zinc oxide nanoparticles: Genotoxicity, interactions with UV-light and cell-transforming potential. J. Hazard. Mater. 2014, 264, 420–429. 10.1016/j.jhazmat.2013.11.043. [DOI] [PubMed] [Google Scholar]
- Shoeb M.; Singh B. R.; Khan J. A.; Khan W.; Singh B. N.; Singh H. B.; Naqvi A. H. ROS-dependent anticandidal activity of zinc oxide nanoparticles synthesized by using egg albumen as a biotemplate. Adv. Nat. Sci.: Nanosci. Nanotechnol. 2013, 4, 035015. 10.1088/2043-6262/4/3/035015. [DOI] [Google Scholar]
- Li J.-h.; Liu X.-r.; Zhang Y.; Tian F.-f.; Zhao G.-y.; Yu Q.-l.-y.; Jiang F.-l.; Liu Y. Toxicity of nano zinc oxide to mitochondria. Toxicol. Res. 2012, 1, 137–144. 10.1039/c2tx20016c. [DOI] [Google Scholar]
- Daniels W. M. U.; Hendricks J.; Salie R.; van Rensburg S. J. A mechanism for zinc toxicity in neuroblastoma cells. Metab. Brain Dis. 2004, 19, 79–88. 10.1023/b:mebr.0000027419.79032.bd. [DOI] [PubMed] [Google Scholar]
- Lipovsky A.; Tzitrinovich Z.; Friedmann H.; Applerot G.; Gedanken A.; Lubart R. EPR Study of Visible Light-Induced ROS Generation by Nanoparticles of ZnO. J. Phys. Chem. C 2009, 113, 15997–16001. 10.1021/jp904864g. [DOI] [Google Scholar]
- Xu X.; Chen D.; Yi Z.; Jiang M.; Wang L.; Zhou Z.; Fan X.; Wang Y.; Hui D. Antimicrobial mechanism based on H2O2 generation at oxygen vacancies in ZnO crystals. Langmuir 2013, 29, 5573–5580. 10.1021/la400378t. [DOI] [PubMed] [Google Scholar]
- Prasanna V. L.; Vijayaraghavan R. Insight into the Mechanism of Antibacterial Activity of ZnO: Surface Defects Mediated Reactive Oxygen Species Even in the Dark. Langmuir 2015, 31, 9155–9162. 10.1021/acs.langmuir.5b02266. [DOI] [PubMed] [Google Scholar]
- Etacheri V.; Roshan R.; Kumar V. Mg-Doped ZnO Nanoparticles for Efficient Sunlight-Driven Photocatalysis. ACS Appl. Mater. Interfaces 2012, 4, 2717–2725. 10.1021/am300359h. [DOI] [PubMed] [Google Scholar]
- Iqbal J.; Jan T.; Ismail M.; Ahmad N.; Arif A.; Khan M.; Adil M.; Sami-ul-Haq; Arshad A. Influence of Mg doping level on morphology, optical, electrical properties and antibacterial activity of ZnO nanostructures. Ceram. Int. 2014, 40, 7487–7493. 10.1016/j.ceramint.2013.12.099. [DOI] [Google Scholar]
- Qiu X.; Li L.; Zheng J.; Liu J.; Sun X.; Li G. Origin of the Enhanced Photocatalytic Activities of Semiconductors: A Case Study of ZnO Doped with Mg2+. J. Phys. Chem. C 2008, 112, 12242–12248. 10.1021/jp803129e. [DOI] [Google Scholar]
- Durlach J.; Bara M.; Guiet-Bara A.; Collery P. Relationship between magnesium, cancer and carcinogenic or anticancer metals. Anticancer Res. 1986, 6, 1353–1361. [PubMed] [Google Scholar]
- Persaud-Sharma D.; McGoron A. Biodegradable Magnesium Alloys: A Review of Material Development and Applications. J. Biomimetics, Biomater., Tissue Eng. 2012, 12, 25–39. 10.4028/www.scientific.net/jbbte.12.25. [DOI] [PMC free article] [PubMed] [Google Scholar]
- Feneberg M.; Osterburg S.; Lange K.; Lidig C.; Garke B.; Goldhahn R.; Richter E.; Netzel C.; Neumann M. D.; Esser N.; Fritze S.; Witte H.; Bläsing J.; Dadgar A.; Krost A. Band gap renormalization and Burstein-Moss effect in silicon- and germanium-doped wurtzite GaN up to 1020 cm–3. Phys. Rev. B: Condens. Matter Mater. Phys. 2014, 90, 075203. 10.1103/physrevb.90.075203. [DOI] [Google Scholar]
- Panigrahy B.; Aslam M.; Misra D. S.; Bahadur D. Polymer-mediated shape-selective synthesis of ZnO nanostructures using a single-step aqueous approach. CrystEngComm 2009, 11, 1920–1925. 10.1039/b904833m. [DOI] [Google Scholar]
- Shalish I.; Temkin H.; Narayanamurti V. Size-dependent surface luminescence in ZnO nanowires. Phys. Rev. B: Condens. Matter Mater. Phys. 2004, 69, 245401. 10.1103/physrevb.69.245401. [DOI] [Google Scholar]
- Sernelius B. E.; Berggren K.-F.; Jin Z.-C.; Hamberg I.; Granqvist C. G. Band-gap tailoring of ZnO by means of heavy Al doping. Phys. Rev. B: Condens. Matter Mater. Phys. 1988, 37, 10244–10248. 10.1103/physrevb.37.10244. [DOI] [PubMed] [Google Scholar]
- Gibbs Z. M.; LaLonde A.; Snyder G. J. Optical band gap and the Burstein–Moss effect in iodine doped PbTe using diffuse reflectance infrared Fourier transform spectroscopy. New J. Phys. 2013, 15, 075020. 10.1088/1367-2630/15/7/075020. [DOI] [Google Scholar]
- Liqiang J.; Yichun Q.; Baiqi W.; Shudan L.; Baojiang J.; Libin Y.; Wei F.; Honggang F.; Jiazhong S. Review of photoluminescence performance of nano-sized semiconductor materials and its relationships with photocatalytic activity. Sol. Energy Mater. Sol. Cells 2006, 90, 1773–1787. 10.1016/j.solmat.2005.11.007. [DOI] [Google Scholar]
- Wang J.; Liu P.; Fu X.; Li Z.; Han W.; Wang X. Relationship between Oxygen Defects and the Photocatalytic Property of ZnO Nanocrystals in Nafion Membranes. Langmuir 2009, 25, 1218–1223. 10.1021/la803370z. [DOI] [PubMed] [Google Scholar]
- Zheng Y.; Chen C.; Zhan Y.; Lin X.; Zheng Q.; Wei K.; Zhu J.; Zhu Y. Luminescence and Photocatalytic Activity of ZnO Nanocrystals: Correlation between Structure and Property. Inorg. Chem. 2007, 46, 6675–6682. 10.1021/ic062394m. [DOI] [PubMed] [Google Scholar]
- Guo M. Y.; Ng A. M. C.; Liu F.; Djurišić A. B.; Chan W. K.; Su H.; Wong K. S. Effect of Native Defects on Photocatalytic Properties of ZnO. J. Phys. Chem. C 2011, 115, 11095–11101. 10.1021/jp200926u. [DOI] [Google Scholar]
- Krishnamoorthy K.; Manivannan G.; Kim S. J.; Jeyasubramanian K.; Premanathan M. Antibacterial activity of MgO nanoparticles based on lipid peroxidation by oxygen vacancy. J. Nanopart. Res. 2012, 14, 1063. 10.1007/s11051-012-1063-6. [DOI] [Google Scholar]
- Gupta J.; Bahadur D. Visible Light Sensitive Mesoporous Cu-Substituted ZnO Nanoassembly for Enhanced Photocatalysis, Bacterial Inhibition, and Noninvasive Tumor Regression. ACS Sustainable Chem. Eng. 2017, 5, 8702–8709. 10.1021/acssuschemeng.7b01433. [DOI] [Google Scholar]
- Gilbert B.; Fakra S. C.; Xia T.; Pokhrel S.; Mädler L.; Nel A. E. The Fate of ZnO Nanoparticles Administered to Human Bronchial Epithelial Cells. ACS Nano 2012, 6, 4921–4930. 10.1021/nn300425a. [DOI] [PMC free article] [PubMed] [Google Scholar]
- Ivask A.; Scheckel K. G.; Kapruwan P.; Stone V.; Yin H.; Voelcker N. H.; Lombi E. Complete transformation of ZnO and CuO nanoparticles in culture medium and lymphocyte cells during toxicity testing. Nanotoxicology 2017, 11, 150–156. 10.1080/17435390.2017.1282049. [DOI] [PMC free article] [PubMed] [Google Scholar]
- Shen C.; James S. A.; de Jonge M. D.; Turney T. W.; Wright P. F. A.; Feltis B. N. Relating Cytotoxicity, Zinc Ions, and Reactive Oxygen in ZnO Nanoparticle–Exposed Human Immune Cells. Toxicol. Sci. 2013, 136, 120–130. 10.1093/toxsci/kft187. [DOI] [PubMed] [Google Scholar]
Associated Data
This section collects any data citations, data availability statements, or supplementary materials included in this article.


