Abstract
This article describes an unsupervised machine learning method for computing distributed vector representation of molecular fragments. These vectors encode fragment features in a continuous high-dimensional space and enable similarity computation between individual fragments, even for small fragments with only two heavy atoms. The method is based on a word embedding algorithm borrowed from natural language processing field, and approximately 6 million unlabeled PubChem chemicals were used for training. The resulting dense fragment vectors are in contrast to the traditional sparse “one-hot” fragment representation and capture rich relational structure in the fragment space. The vectors of small linear fragments were averaged to yield distributed vectors of bigger fragments and molecules, which were used for different tasks, e.g., clustering, ligand recall, and quantitative structure–activity relationship modeling. The distributed vectors were found to be better at clustering ring systems and recall of kinase ligands as compared to standard binary fingerprints. This work demonstrates unsupervised learning of fragment chemistry from large sets of unlabeled chemical structures and subsequent application to supervised training on relatively small data sets of labeled chemicals.
1. Introduction
Chemical fragments are building blocks of chemical structures and useful in modeling biological or physicochemical properties of chemicals.1 Fragments can be generated algorithmically, and they are intuitive to medicinal chemists and useful in understanding target selectivity and activity prediction.2 Because of their extensive use in cheminformatics, finding better computational representation of molecular fragments is important. Traditionally, fragments were handled as discrete symbols,3,4 e.g., as arbitrary indices in a list of unique fragments. Essentially, the ith fragment is an N-dimensional “one-hot” vector, where N is the number of unique fragments in the fragment vocabulary. Only the ith element of the vector would be nonzero (Figure 1a). However, such a representation provides no clue about possible relationship between individual fragments themselves, for example, there is no simple way to calculate similarity between the fragments −CH2–Br and −CH2–Cl. In other words, molecules can be compared to each other by counting fragments that are common between them, but it is not straightforward to do the same for the fragments themselves.
Figure 1.
Two different representations of molecular fragments: (a) traditional sparse and one-hot representation and (b) distributed and dense representation developed in the present work. N = size of fragment vocabulary; k = number of elements in the fragment vectors (adjustable, e.g., 100 in the current work).
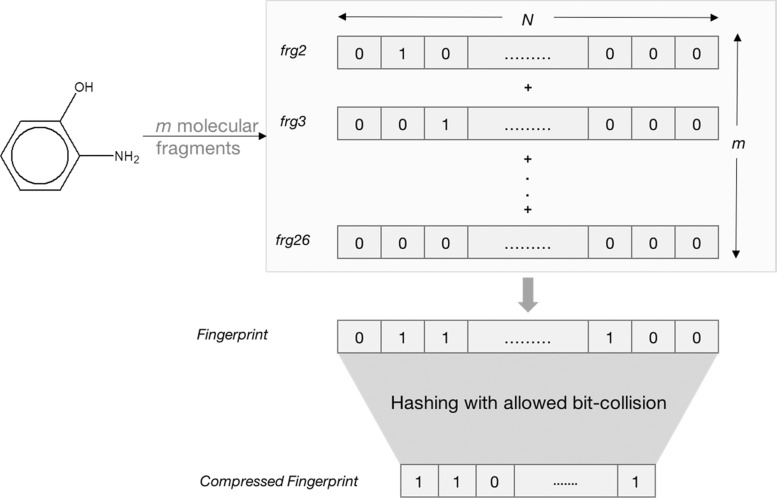
One-hot representation of fragments are traditionally used for building fingerprints (FPs) that encode chemical structures.3,4 Such fingerprints are usually composed of a series of binary digits (bits) indicating the presence/absence of certain fragments in the molecule, as shown in Figure 2. Similarity between two molecules can be computed using Tanimoto similarity measure. However, the number of unique fragments (fragment vocabulary size) from a set of chemicals is usually large and the fingerprints are much smaller (128, 256, 512 bits, etc.), resulting in more than one fragments competing for the same bin; this is called bit collision. A combination of hashing and random number generation is used to determine the bit position for a fragment; therefore, fragments that are chemically different can end up in the same bin.
Figure 2.
Computation of molecular fingerprints using traditional one-hot fragment representations. N = size of fragment vocabulary; m = number of fragments generated by breaking up the molecule in question.
The one-hot fragment representation is responsible for certain issues associated with the fragment-based quantitative structure–activity relationships (QSARs) and group contribution models,1,5 in which fragment counts of training chemicals are used as descriptors. The X matrix of the training data becomes sparse and quite large, imposing restrictions on the domain applicability of test chemicals. The number of a test chemical’s neighbors that are more similar to a chosen cutoff becomes fewer, restricting the model’s applicability domain. This problem becomes particularly serious for smaller training sets.5
Distributed representations, on the other hand, characterize symbols in a continuous high-dimensional vector space, where similar symbols are positioned near each other. Distributed representations are widely used in natural language processing (NLP) applications6 and referred to as word embeddings. The vectors are learned automatically by a neural network with training on a large corpus of actual text while being tasked to predict the next word in the sequence from the context of earlier words.7−9 The hypothesis that words sharing similar contexts have similar meaning is central to this process and it is driven by an unsupervised training, i.e., the input data are unlabeled. In addition, it does not require any prior expert knowledge. Success of the distributed representations was replicated in other fields, e.g., in bioinformatics, notably Asgari and Mofrad’s10 application of word embeddings for biomolecular sequences.
Within the context of distributed representation of symbols, the present work has two main objectives: (1) to explore the possibility of extending the word embedding methodology of NLP to the analysis of fragments of organic molecules and (2) to compare distributed vector representations of molecules with standard binary fingerprints. Principles of linguistics have been applied on organic molecules in past, e.g., Cadeddu et al.11 showed that linguistics-based analysis is well suited to the analysis of structural and reactivity patterns of organic molecules, and a natural language and organic chemistry have the same structure in terms of the frequency of text fragments and molecular fragments. Another study by Jaeger et al.12 based on a similar concept appeared after submission of the present work for publication. It differs in the employed molecule fragmentation scheme and in the empirical and comparative analyses presented. Both the present work and that of Jaeger et al. demonstrate the usefulness of the linguistics-based analysis in chemistry.
This paper consists of the following parts:
-
i.
Computation of distributed representations for 2-, 3-, and 4-atom linear fragments. These simple fragments were treated as building blocks for bigger, more complex fragments and molecules.
-
ii.
Display of various physicochemical and chemical properties of the fragments on two-dimensional (2D) t-distributed stochastic neighbor embedding (t-SNE) plots to determine if the vectors captured meaningful features of the fragments.
-
iii.
Computing distributed vectors for bigger fragments, e.g., ring systems, and comparison with traditional bit-based binary fingerprints.
-
iv.
Computing distributed vectors for molecules and using them for QSAR modeling and screening of bioactive chemicals and comparing with traditional binary fingerprints.
2. Results and Discussion
2.1. Evaluating Distributed Vectors of the 2-, 3-, and 4-Atom Linear Fragments
The Word2vec9 algorithm was used to compute fragment vectors, as described in the Materials and Methods section. The algorithm had no access to atom-type makeup of the input fragments; therefore, it is important to determine if the resulting vectors captured meaningful information related to the fragments’ atoms. The following exercises were performed in this respect:
-
i.
Similarity search among the 2- to 4-atom linear fragments and visual inspection of the results.
-
ii.
Displaying fragments with selected atom types on t-SNE plots.
-
iii.
Quantitative evaluation of the distribution of log P and molar refractivity (MR) values of fragments in vector space.
2.1.1. Fragment Similarity
Every simple fragment was searched against all other fragments with same heavy atom count, and cosine similarity values were computed for each pair. A visual inspection of the results revealed that fragments with high cosine similarity (>0.7) also appear to be chemically similar. For instance, Table 1 lists five closest neighbors for three query fragments. Most similar fragments to N3–C3H2–C3H2–Cl, as listed in Table 1, show that the algorithm correctly identified the equivalency between Cl, F, Br, and I atoms. Computing similarity between such fragments with traditional binary fingerprints using Tanimoto measure is meaningless because they are already too small and simple, and their fingerprints will have too few bits turned “on”. Distributed fragment vectors, on the other hand, are dense and yield meaningful similarity values.
Table 1. Results of Similarity Search for Three Example Query Fragmentsa.
| N3–C3H2–C3H2–Cl (query fragment) |
[n+]:cH:[c.] (query fragment) |
C2H–Br (query fragment) |
|||
|---|---|---|---|---|---|
| closest fragments | similarity | closest fragments | similarity | closest fragments | similarity |
| N3–C3H2–C3H2–F | 0.731 | cH:[n+]:[c.] | 0.756 | Cl–C2H | 0.799 |
| N3–C3H2–C3H2–Br | 0.718 | [n+]:c:[c.] | 0.752 | I–C2H | 0.635 |
| N3–C3H2–C3H2–I | 0.682 | cH:[n+]:cH | 0.722 | F–C2H | 0.587 |
| N3–C3H2–C3H2–N3 | 0.656 | cH:cH:[n+] | 0.702 | I–C2 | 0.578 |
| OH–C3H2–C3H2–N3 | 0.646 | C3H3–c:[n+] | 0.686 | C2H–C1 | 0.565 |
N3 - sp3 nitrogen; C3 - sp3 carbon; C2 - sp2 carbon; C1 - sp carbon; [c.] - aromatic carbon at a ring joint; H2 - two hydrogens.
2.1.2. t-SNE Visualization of Fragments with Selected Atom Types
The 4-atom linear fragments were selected for this purpose because they pose more challenge than the 2- or 3-atom fragments. Vectors of these fragments were subjected to t-SNE projection to two dimensions, and fragments with the following atom types were highlighted on the resulting 2D plot:
-
i.
Fragments with one or more aromatic nitrogen, aromatic oxygen, or aromatic sulfur atoms.
-
ii.
Fragments with metalloid atoms (B, Si, As, Te, Ge, and Sb).
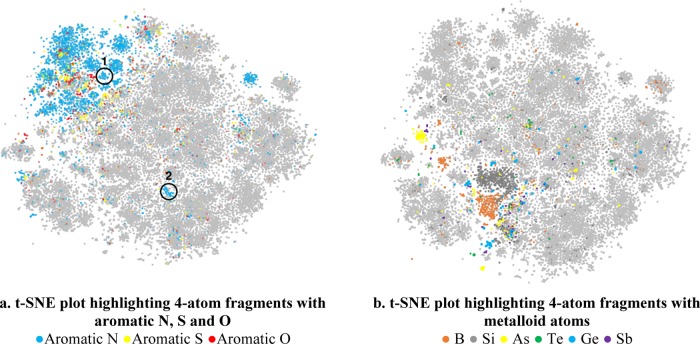
The plots are shown in Figure 3. Clusters for each class of fragments can be seen in each plot. t-SNE projection preserves relational structure that exists in the high-dimensional fragment vector space. Majority of the aromatic nitrogen-, oxygen-, and sulfur-containing fragments are located in the upper left part of the plot (Figure 3a). However, fragments with substantially different chemistries are located away from the main group. For example, fragments of cluster #1 (highlighted in Figure 3a) contain a secondary aliphatic nitrogen (−N3H) bonded with the aromatic nitrogen and for cluster #2, the aromatic nitrogen is bonded with a carbon in a three-membered ring (−[C3^H]), as listed in Table 2. Fragments with metalloids also exhibit similar clustering behavior as shown in Figure 3b.
Figure 3.
t-SNE plots highlighted with 4-atom fragments with (a) aromatic N, S and O (b) metalloid atoms. Each plot contains 37013 fragments. A sampling of the fragments of the clusters #1 and 2 in (a) is shown in Table 2.
Table 2. Some of the Aromatic Nitrogen-Containing Fragments from the Clusters #1 and 2 from Figure 3aa.
| fragments of cluster #1 | fragments of cluster #2 |
|---|---|
| N3H-n:cH:n | C3H2-c:n-[C3^H] |
| cH:n-N3H–C2 | cH:n-[C3^H]–[C3^] |
| n-N3H–C2-c | n:cH:n-[C3^H] |
| O=C2–N3H-n | n-C3H2–[C3^]–[C3^H2] |
| N3H-n:c-C3H3 | cH:n-[C3^H]–[C3^H2] |
| N3H-n:c:cH | cH:n-C3H2–[C3^] |
| n-N3H–C2–C3H2 | n-[C3^H]–[C3^H]–[C3^H] |
| N3H2-c:n-N3H | [C3^H]–[C3^H]-n:[c.] |
| N3H-n:[c.]:[c.] | [C3^]–[C3^H]-n:[c.] |
| N3H-n:n:n | n-[C3^H]–[C3^H]–C3H2 |
N3 - sp3 nitrogen; C3 - sp3 carbon; C2 - sp2 carbon; C1 - sp carbon; [c.] - aromatic carbon at a ring joint; [C3^] - sp3 carbon in a three- or four-membered ring; H2 - two hydrogens.
2.1.3. Distribution of Physicochemical Properties in Fragment Vector Space
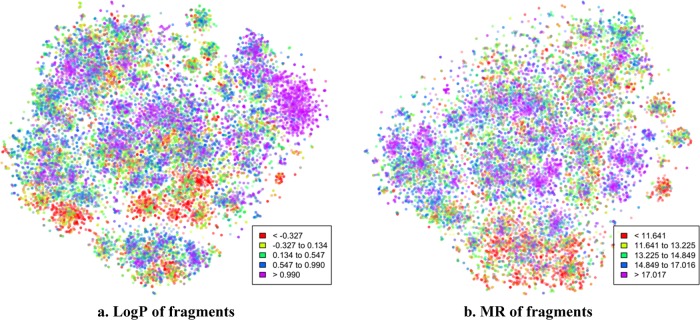
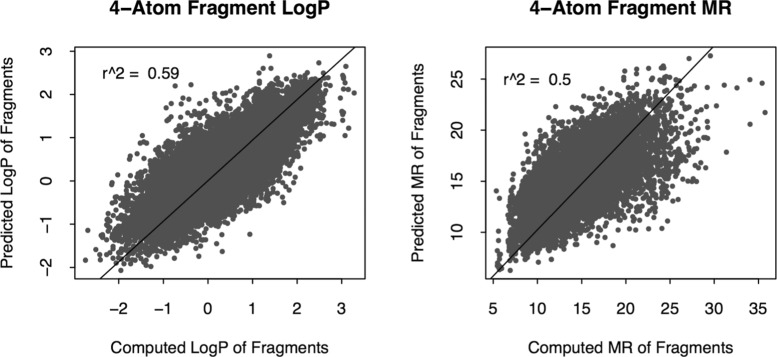
Octanol–water partition coefficient (log P) and molar refractivity (MR) were considered. The objective is to perform a quantitative test to check if close neighbors in the fragment vector space have similar physicochemical properties, but not to build a high-performance model for predicting log P or MR. Experimental log P values of small fragments are not found in scientific literature; therefore, contributions of various atom types were first estimated by a least-square fitting with experimental log P/MR values of whole molecules (using log P and MR data sets). Regression coefficients of the atoms of a fragment and the intercept term were added to compute log P/MR of the fragment. The log P of only 26 285 fragments out of 37 013 4-atom fragments could be calculated because of the inability to estimate contributions of all of the atom types due to the small size of the log P training set. Similarly, MR of only 19 192 fragments out of 37 013 could be calculated. The computed log P and MR values are displayed on t-SNE plots in Figure 4. Several clusters with more or less uniform color can be seen in Figure 4, but they do not give any quantitative estimate. Therefore, log P/MR of individual fragments were predicted using the computed property values of 5 of its closest neighbors in the 100-dimensional vector space; the results are shown in Figure 5. A clear positive trend can be seen even though the r2 of the predictions are not high.
Figure 4.
Values of computed log P and MR contributions of 4-atom fragments displayed on t-SNE plots. (a) Dots for 26 285 fragments and (b) dots for 19 192 fragments.
Figure 5.
Prediction of log P and MR contribution (vertical axis) of 4-atom linear fragments using five closest fragments in the high-dimensional vector space (from skip-gram (SG) method). The horizontal axis represents computed log P/MR (sum of contributions of the four heavy atoms of the fragments).
2.2. Evaluating Distributed Vectors of Molecules
In this part, 300-element distributed vectors of molecules were computed by utilizing the vectors of their component 2-, 3-, and 4-atom fragments (as described in the Materials and Methods section). These vectors were evaluated by clustering small ring systems and ligand recall from decoys and by building QSARs. For every task, the distributed vectors (DISTRIB_FP_300) were compared with two standard binary fingerprints (FPs):
-
a.
1024-bit fragment-based binary fingerprints (FRAG_FP_1024): these FPs were built from 2- to 4-atom linear fragments (path lengths of 1 to 3 bonds) hashed to a 1024-bit binary array.
-
b.
881-bit substructure key-based CACTVS fingerprints (CACTVS_881): the bits indicate the presence/absence of various atom counts, ring types, atom pairs, simple and detailed atom neighbors, and various SMARTS patterns.13
2.2.1. Clustering of Small Ring Systems
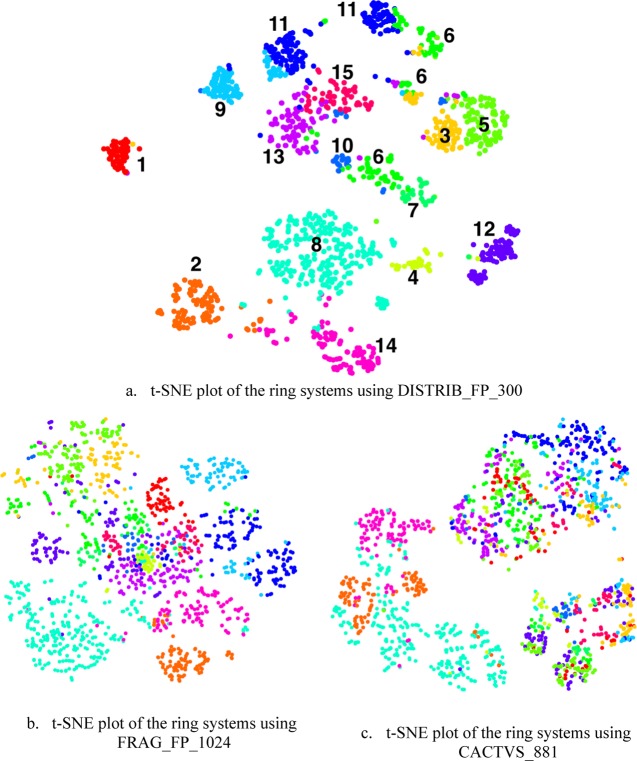
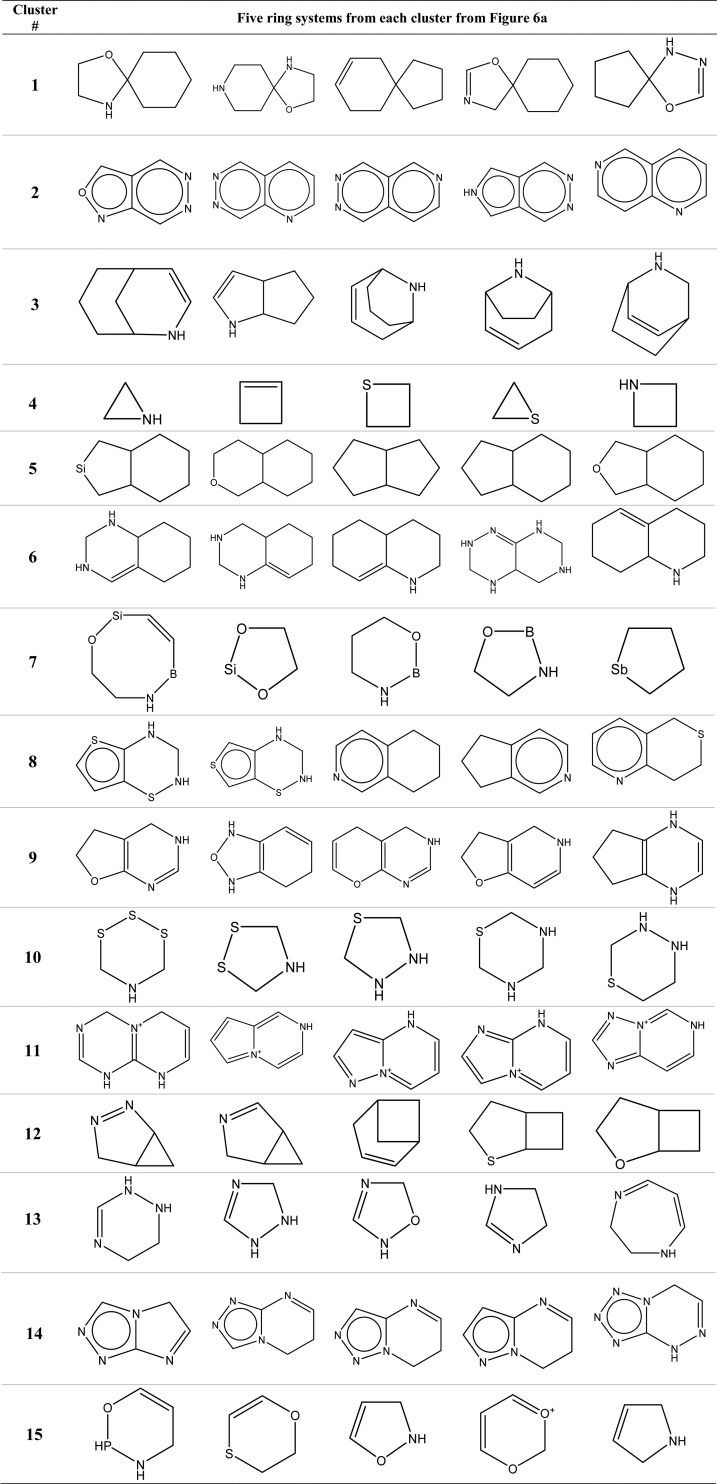
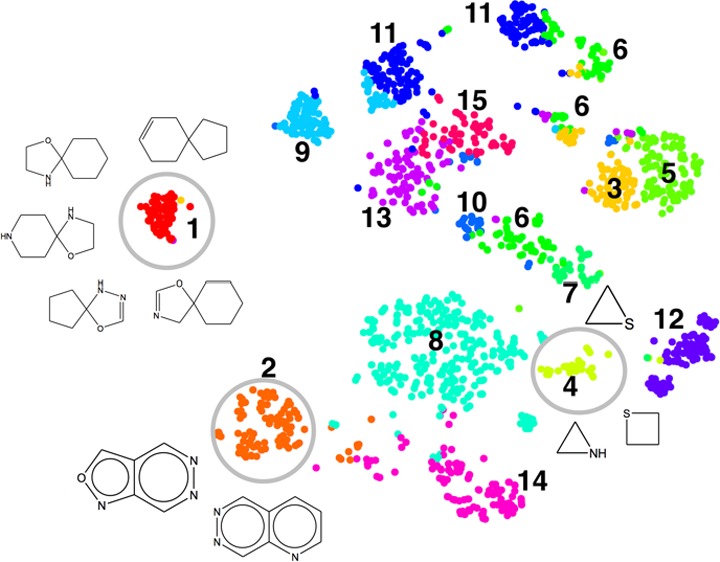
Ring systems with 10 or less heavy atoms were extracted from the set of 100 000 PubChem chemicals by removing their acyclic parts. For each of the resulting 1638 ring systems, three types of fingerprints were computed. k-means clustering was applied to the full feature space of the DISTRIB_FP_300 fingerprint to partition the data points into 15 groups. Then, the fingerprint sets were subjected to t-SNE projection and the clusters from the high-dimensional feature space of DISTRIB_FP_300 were mapped onto the t-SNE plots, and the results are shown in Figure 6. The 15 clusters of Figure 6a were rendered with different colors and mapped to Figure 6b,c. This was done to determine the relative positions of the ring systems in the plots of DISTRIB_FP_300, FRAG_FP_1024, and CACTVS_881. By visual comparison, the t-SNE clusters from the distributed FPs are quite distinct and compact as compared to both the standard FPs. Sometimes, a single cluster found by the k-means in the full feature space is broken down in smaller groups by t-SNE procedure, e.g., cluster #6 and 11. Also, the relative positions of the clusters of different ring systems differ substantially among the fingerprints, e.g., ring systems that belong to cluster #4, 13, and 15 of the DISTRIB_FP_300 are well separated from others but not for FRAG_FP_1024 and CACTVS_881. Ring systems closest to the centroids of the 15 clusters of DISTRIB_FP_300 are listed in Table 3.
Figure 6.
t-SNE projection of 1638 small ring systems using three different fingerprints. The 15 clusters in (a) were obtained by applying k-means clustering on the full feature space of DISTRIB_FP_300. The color of each dot (ring system) in (a) is mapped to the dot corresponding to the same ring system in (b) and (c).
Table 3. Examples of Ring Systems from each of the 15 Clusters Shown in Figure 6a Using the Distributed Fingerprints Developed in this Work.
2.2.2. Kinase Ligand Recall from Decoys
The directory of useful decoy (DUD-E) data (as described in the Materials and Methods section) include data sets for 26 different kinase targets, each with a very small percentage of active ligands and a large number of random druglike decoys. The structures of the crystallographic ligands of the kinase targets, which are included in the DUD-E directory, were used as queries to screen the ligands from the decoys. The three types of FPs were calculated for each of the 26 query ligands, active ligands, and decoys. Cosine similarity for the DISTRIB_FP_300 and Tanimoto similarity for the FRAG_FP_1024 and CACTVS_881 between the query ligand and the database structures were used for the ligand recall. The recall plots for the 26 targets are included in the Supporting Information. Percent recall (PR) of active ligands at three different percentages of screened database are presented in Table 4. Best values in each category are highlighted in bold. Out of the 26 targets, the DISTRIB_FP_300 was among the highest in at least one of the percent recall values (PR1%, PR5%, or PR10%) for 17 targets. It did not come out on top for nine targets, i.e., abl1, braf, csf1r, egfr, kit, lck, mapk2, rock1, and vgfr2. In comparison, FRAG_FP_1024 produced at least one best value for 12 targets and CACTVS_881 gave best values for 13 targets.
Table 4. Percentage of Recalled Kinase Ligands, Using the Three Different Fingerprints, at 1, 5, and 10% of Total Screened Databasea.
| DISTRIB_FP_300b |
FRAG_FP_1024 |
CACTVS_881 |
|||||||||
|---|---|---|---|---|---|---|---|---|---|---|---|
| kinase target | # ligands | # decoys | PR1% | PR5% | PR10% | PR1% | PR5% | PR10% | PR1% | PR5% | PR10% |
| abl1 | 182 | 10 749 | 4.4 | 17.6 | 41.2 | 10.4 | 27.5 | 44.0 | 6.6 | 38.5 | 61.5 |
| akt1 | 293 | 16 439 | 27.6 | 78.5 | 86.3 | 10.2 | 54.6 | 66.6 | 16.7 | 40.6 | 65.5 |
| akt2 | 117 | 6900 | 28.2 | 70.1 | 79.5 | 22.2 | 59.8 | 74.4 | 19.7 | 42.7 | 66.7 |
| braf | 152 | 9950 | 11.2 | 16.4 | 35.5 | 34.9 | 51.3 | 63.8 | 12.5 | 29.6 | 40.8 |
| cdk2 | 474 | 27 846 | 7.2 | 21.5 | 34.2 | 4.6 | 13.9 | 25.5 | 5.3 | 16.0 | 28.9 |
| csf1r | 166 | 12 149 | 16.3 | 39.2 | 50.0 | 33.1 | 51.8 | 66.3 | 15.7 | 31.9 | 41.0 |
| egfr | 542 | 35 049 | 45.6 | 76.6 | 82.7 | 50.9 | 79.3 | 86.0 | 27.7 | 63.8 | 75.1 |
| fak1 | 100 | 5350 | 41.0 | 94.0 | 96.0 | 37.0 | 86.0 | 91.0 | 30.0 | 68.0 | 90.0 |
| fgfr1 | 139 | 8700 | 11.5 | 32.4 | 51.8 | 0.0 | 10.8 | 25.2 | 9.4 | 36.0 | 45.3 |
| igf1r | 148 | 9300 | 17.6 | 58.8 | 79.1 | 23.6 | 39.2 | 59.5 | 20.9 | 43.9 | 66.9 |
| jak2 | 107 | 6498 | 30.8 | 62.6 | 73.8 | 22.4 | 36.4 | 49.5 | 23.4 | 44.9 | 56.1 |
| kit | 166 | 10 450 | 5.4 | 7.8 | 10.2 | 3.6 | 22.9 | 38.0 | 6.6 | 20.5 | 31.3 |
| kpcb | 135 | 8697 | 56.3 | 67.4 | 68.9 | 52.6 | 68.1 | 70.4 | 55.6 | 68.1 | 71.9 |
| lck | 420 | 27 396 | 27.4 | 49.0 | 64.8 | 22.1 | 40.0 | 52.9 | 28.3 | 61.0 | 74.5 |
| mapk2 | 101 | 6145 | 23.8 | 38.6 | 40.6 | 34.7 | 35.6 | 38.6 | 40.6 | 65.3 | 75.2 |
| met | 166 | 11 250 | 50.6 | 70.5 | 75.9 | 54.8 | 70.5 | 78.9 | 31.9 | 70.5 | 75.9 |
| mk01 | 79 | 4547 | 57.0 | 73.4 | 79.7 | 57.0 | 69.6 | 72.2 | 46.8 | 77.2 | 86.1 |
| mk10 | 104 | 6600 | 2.9 | 6.7 | 6.7 | 1.9 | 6.7 | 6.7 | 1.0 | 1.0 | 1.9 |
| mk14 | 578 | 35 850 | 12.5 | 36.9 | 56.9 | 8.7 | 26.0 | 43.1 | 8.8 | 33.0 | 50.0 |
| mp2k1 | 121 | 8148 | 24.0 | 31.4 | 37.2 | 19.8 | 23.1 | 39.7 | 19.8 | 21.5 | 28.1 |
| plk1 | 107 | 6800 | 13.1 | 32.7 | 56.1 | 1.9 | 10.3 | 14.0 | 13.1 | 44.9 | 59.8 |
| rock1 | 100 | 6300 | 0.0 | 0.0 | 0.0 | 2.0 | 6.0 | 16.0 | 4.0 | 9.0 | 11.0 |
| src | 524 | 34 494 | 31.7 | 61.8 | 73.1 | 13.2 | 27.9 | 38.2 | 17.2 | 33.6 | 46.4 |
| tgfr1 | 133 | 8500 | 49.6 | 82.0 | 91.7 | 47.4 | 82.7 | 95.5 | 43.6 | 85.0 | 92.5 |
| vgfr2 | 409 | 24 949 | 20.0 | 43.3 | 57.7 | 12.2 | 31.3 | 41.1 | 28.1 | 52.6 | 69.4 |
| wee1 | 102 | 6149 | 61.8 | 90.2 | 90.2 | 61.8 | 91.2 | 92.2 | 61.8 | 90.2 | 91.2 |
Bold entries indicate best values for each category of percent recall (PR).
DISTRIB_FP_300 were computed by averaging fragment vectors obtained from skip-gram architecture.
2.2.3. Binary Classification of Biological Activity
The ability of the distributed fingerprints to classify biologically active and inactive chemicals was evaluated for the mutagenicity and the anti-HIV data sets. Similar to the previous two tasks, three types of fingerprints, DISTRIB_FP_300, FRAG_FP_1024, and CACTVS_881, were calculated for the chemicals of the two data sets. A chemical is excluded if all of its 2-, 3-, and 4-atom fragments are not part of the three-fragment vector libraries. For mutagenicity and the anti-HIV data sets, nine and two chemicals, respectively, had to be excluded (the list is included in the Supporting Information). All such chemicals happened to be containing only two heavy atoms.
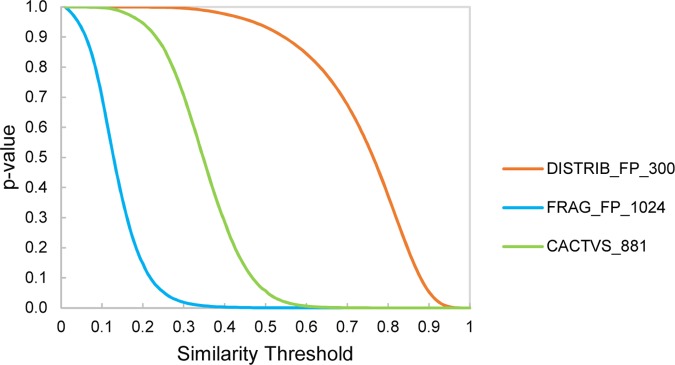
For a quantitative comparison of the predictive performance of the three fingerprints, a 10-fold cross-validation was conducted using the k-nearest neighborhood method. In every cycle of the validation process, 10% chemicals were taken out and their activity class was estimated from the labels of five nearest neighbors from the rest 90% target chemicals. A query chemical was classified to be active if majority of the five neighbors are active. As an additional condition, a neighbor was allowed to be counted only if it has a similarity equal to or higher than a set threshold. A prediction is excluded from consideration if equal number of positive and negative neighbors or no neighbors were returned. To derive threshold values that indicate statistically significant levels of similarity, similarity value distributions for the three fingerprints (cosine similarity was used for DISTRIB_FP_300 and Tanimoto similarity for FRAG_FP_1024 and CACTVS_881) were generated as described by Maggiora et al.14 This also helps in comparing the prediction performance at different thresholds across different fingerprints. A set of 100 randomly chosen reference chemicals from the 100 000 PubChem chemical set were used for generating search profiles. Figure 7 shows p-values as a function of similarity thresholds for the three fingerprints. It is apparent that the profiles of the fingerprints are very different from each other, particularly the DISTRIB_FP_300 in combination with the cosine similarity measure gives statistically significant similarities only at very high similarity values and allows only a small range of similarity values (0.9–1.0) to work with.
Figure 7.
Significance levels (p-values) at different threshold values of similarity coefficients. Cumulative distribution functions for the three fingerprints were generated by randomly selecting 100 reference compounds and calculating their similarity with the rest of chemicals from a set of 100 000 PubChem chemicals.
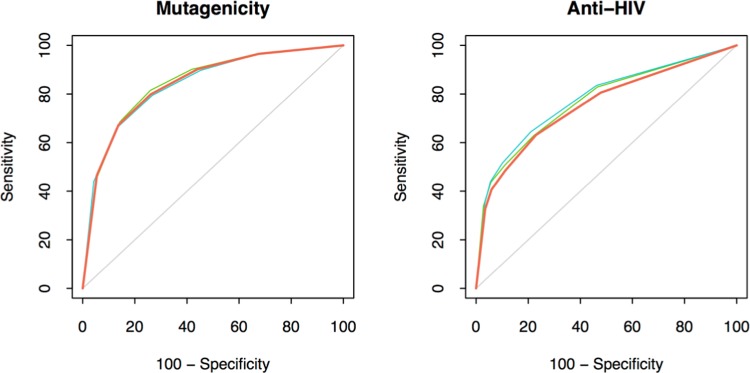
Similarity thresholds corresponding to five p-values (1.0, 0.1, 0.05, 0.01, and 0.005) for the three fingerprints were derived using the distributions, and the cross-validation results for the mutagenicity and the anti-HIV data sets are presented in Tables 5 and 6, respectively. In general, sensitivity and specificity increase, and coverage decreases at lower p-values. Also, similar performance can be achieved from all of the three fingerprints at statistically significant threshold values. The binary bit-based fingerprints give more room to increase the similarity threshold and consequently to go for lower p-values in comparison to DISTRIB_FP_300. For example, for the mutagenicity end point, the performance of DISTRIB_FP_300 at the p-value of 0.005 and similarity threshold of 0.948 can be matched by the two binary fingerprints at higher threshold values beyond that shown in Table 5 because, for the p-value of 0.005, FRAG_FP_1024 and CACTVS_881 are at similarity thresholds of only 0.374 and 0.612, respectively. Prediction performance as a function of different threshold values (in contrast to p-values) is shown in the Supporting Information. Performance of the three fingerprints are also shown as receiver operating characteristic (ROC) plots in Figure 8. Each plot is an average of the 10 cycles from the cross-validation procedure at a similarity threshold of 0.0. This further shows that the performance of the three fingerprints are almost similar.
Table 5. Performance of the Three Fingerprints in 10-Fold Cross-Validation Exercise for Predicting Mutagenicity Using k-Nearest Neighborhood Method.
| Similarity
Threshold, Sensitivity %, Specificity %, Coverage % |
|||||
|---|---|---|---|---|---|
| p-value | 1.0 | 0.1 | 0.05 | 0.01 | 0.005 |
| DISTRIB_FP_300a | 0.200, 80, 74, 100 | 0.878, 83, 75, 90 | 0.902, 84, 75, 85 | 0.936, 87, 75, 75 | 0.948, 88, 74, 69 |
| FRAG_FP_1024 | 0.006, 79, 73, 100 | 0.218, 80, 73, 99 | 0.252, 80, 74, 98 | 0.332, 81, 74, 95 | 0.374, 82, 74, 92 |
| CACTVS_881 | 0.054, 82, 74, 100 | 0.468, 82, 74, 100 | 0.504, 82, 74, 99 | 0.580, 82, 74, 99 | 0.612, 82, 75, 97 |
DISTRIB_FP_300 were computed by averaging fragment vectors obtained from skip-gram architecture.
Table 6. Performance of the Three Fingerprints in 10-Fold Cross-Validation Exercise for Predicting Anti-HIV Using k-Nearest Neighborhood Method.
| Similarity
Threshold, Sensitivity %, Specificity %, Coverage % |
|||||
|---|---|---|---|---|---|
| p-value | 1.0 | 0.1 | 0.05 | 0.01 | 0.005 |
| DISTRIB_FP_300a | 0.200, 57, 91, 100 | 0.878, 60, 90, 89 | 0.902, 64, 90, 81 | 0.936, 74, 88, 60 | 0.948, 77, 87, 52 |
| FRAG_FP_1024 | 0.006, 60, 92, 100 | 0.218, 60, 92, 99 | 0.252, 61, 91, 97 | 0.332, 64, 91, 90 | 0.374, 67, 91, 83 |
| CACTVS_881 | 0.054, 58, 92, 100 | 0.468, 58, 92, 100 | 0.504, 58, 92, 99 | 0.580, 59, 91, 95 | 0.612, 61, 91, 90 |
DISTRIB_FP_300 were computed by averaging fragment vectors obtained from skip-gram architecture.
Figure 8.
ROCs of the three FPs for mutagenicity and anti-HIV activity classification. Each plot is an average of the 10 cycles from cross-validation procedure. The orange lines are for DISTRIB_FP_300, blue FRAG_FP_1024, and green for CACTVS_881.
2.2.4. Quantitative Activity/Property Predictions
The distributed fingerprints were tested for their ability to build QSARs with continuous outcomes. The log P data set and the Tetrahymena data sets were used for this purpose. For the two data sets, one and seven chemicals had to be excluded because all of their 2-, 3-, and 4-atom fragments are not part of the three-fragment vector libraries. All such chemicals contain only two heavy atoms; 10 and 20% chemicals were taken out from the Tetrahymena pyriformis and log P data sets, respectively, and kept out as test sets. Six QSAR models were built (three sets of fingerprints for two properties). Ordinary least-square regression was used for fitting the bins of the fingerprints as independent (X) variables with continuous response as the dependent variable (Y). Test set activities were predicted using the generated models, and the results are shown in Figures 9 and 10 for T. pyriformis toxicity and log P respectively. On the basis of the squared correlation coefficient, CACTVS_881 gave the best performance for both the end points. DISTRIB_FP_300 got the second position for predicting Tetrahymena toxicity and third position in the log P predictions.
Figure 9.
Observed vs predicted plots for toxicity against T. pyriformis using QSARs built using the three FPs. DISTRIB_FP_300 were computed by averaging fragment vectors obtained from skip-gram architecture.
Figure 10.
Observed vs predicted plots for log P using QSARs built using the three FPs. DISTRIB_FP_300 were computed by averaging fragment vectors obtained from skip-gram architecture.
3. Conclusions
A methodology is proposed for computing distributed, dense vector representations of molecular fragments. The fragment embedding technique is based on an unsupervised machine learning method and requires only unlabeled chemical structures. The vectors captured meaningful physicochemical properties, can be easily trained using publicly available software and data, and need to be computed only once.
The fragment vectors were used for computing distributed vectors for molecules. The distributed FPs proved to be working well for a variety of chemistries and bioactivities. Compared to two traditional FPs, e.g., fragment-based hashed binary FP and CACTVS binary FP, the distributed FPs showed favorable properties in ring system clustering and performed better in kinase ligand recall. It demonstrated similar prediction performance to binary bit-based FPs in the quantitative prediction of toxicity against Tetrahymena and predicting log P and in the classification of mutagenic and anti-HIV compounds.
On the basis of the evidence presented in this paper, the distributed vector representation of chemical fragments and molecules seems to have high potential in QSAR and drug discovery. Future research plans include exploring effects of various hyperparameters on vector training, e.g., vector length, various fragmenting schemes, different Word2vec parameters, and other possible ways to combine fragment vectors to compute molecular fingerprints.
4. Materials and Methods
4.1. Data
A number of chemical data sets were used in this study. The data sets were curated by removing inorganic salt parts, neutralizing charges on certain atoms, splitting components of mixtures, and processing duplicates:
-
i.
PubChem data sets: one set with ∼6 million (5 983 832) compounds and another with 100 000 compounds were obtained from a total of 10 million compounds (from CID 1 to 10 000 000) that were downloaded from PubChem Download Service.15
-
ii.
Mutagenicity data set: a combined Hansen16 and Bursi17 Ames mutagenicity benchmark data sets with a total of 6771 compounds (3639 mutagenic and 3132 nonmutagenic).
-
iii.
MR data set: 575 compounds with measured molar refractivity from the publication of Ghose et al.18
-
iv.
Log P data set: an in-house data set19 of 7000 chemicals with experimentally measured octanol–water partition coefficient.
-
v.
Kinase data set: the kinase subset of the enhanced directory of useful decoys (DUD-E)20 composed of 5665 ligands and 355 205 decoys for 26 kinase targets.
-
vi.
Anti-HIV data set: 6454 compounds (1466 active and 4988 inactive) of the anti-HIV data set from National Cancer Institute’s Developmental Therapeutics Program21 were used.
-
vii.
Tetrahymena data set: 1087 chemicals with toxicity against T. pyriformis, taken from the paper of Owen et al.22
4.2. Software
Python package Gensim23 was used for the Word2vec algorithm for learning distributed representation of chemical fragments. The R package Rtsne24 was used for generating t-distributed stochastic neighbor embedding (t-SNE) plots. R was also used for k-means clustering.25
An in-house cheminformatics software library was used for handling chemical structures, fragmenting chemicals, computing standard binary fingerprints, QSAR analysis, and all other operations described in this paper.
4.3. Molecular Fragment Generation
A graph traversing algorithm was used to generate linear fragments with two to four heavy atoms from training chemicals. These fragments were then converted to text strings using atomic and bond symbols, e.g., C3H2–C3H2–C3H2–N3H2. The atom symbols are composed of element, hybridization, aromaticity, the number of attached hydrogens, formal charge, aromatic ring joints, membership of three- or four-sized rings, etc., e.g., C3H3 denotes an sp3 carbon with three hydrogens, C1 stands for sp carbons, C2 is for sp2 carbons, [c.] stands for aromatic carbons located on a ring joint, N_Pl3 stands for trigonal planar nitrogens, and [N3^] denotes an sp3 nitrogen in a three- or four-membered ring. Traditional SMILES coding,26,27 which is more suitable for encoding whole molecules, was not used because the atom-type details (mentioned above) are lost in SMILES of isolated fragments.
The fragment strings are paired with unique keys and stored in dictionaries, e.g., {key = frg_54, fragment = C3H2–C3H2–C3H2–N3H2}. Three separate dictionaries were constructed for 2-, 3-, and 4-atom fragments. A total of 2699, 15 263, and 70 890 unique 2-, 3-, and 4-atom fragments were recorded, respectively.
4.4. Building Fragment Corpus
In NLP,
a text corpus is a large collection of real text data used for statistical
analysis or learning word embeddings. Similarly, in this work, a fragment
corpus was built for computing fragment vectors. The fragment corpus
is essentially a big text file containing a list of so-called fragment
sentences. A chemical was treated as a body of text and its structural
fragments as words. Each sentence is a list of fragments that are
connected (shares at least one atom) to one fragment in a chemical.
Fragment sentences were generated from every training chemical using
the following steps:
Randomization of fragments in the second step in the inner loop was done to prevent introduction of any bias from numbering of atoms. The underlying fact is that the words in a meaningful sentence of a natural language, such as English, are arranged in a unidirectional order, whereas fragments in an organic molecule are not always arranged in a directional fashion, that is, some of them are connected to each other.
In the corpus file, every sentence is placed in a separate line. Following is an example of a typical fragment sentence, composed of four 4-atom fragments.
C3H–N3H–C2=C2 C3H–C3H2–N3H–C2 C3H–C3H2–N3–C2H C3H–N3H–C2=C2
In practice, the keys from the respective fragment dictionary were used in place of the actual fragments to save memory and disk space, e.g., the above fragment sentence will be stored as follows:
frg_102 frg_103 frg_111 frg_104
Three separate fragment corpora were created for 2-, 3-, and 4-atom fragments, with 48 470 630 (∼48 million), 39 676 240 (∼40 million), and 26 810 441 (∼27 million) sentences, respectively.
4.5. Generating Vectors for the 2-, 3-, and 4-Atom Linear Fragments
The Word2vec word embedding algorithm,9 which takes raw text as input and learns distributed representation of words, was used. Two neural network-based unsupervised learning architectures are available in Word2vec:
4.5.1. Skip-Gram (SG)
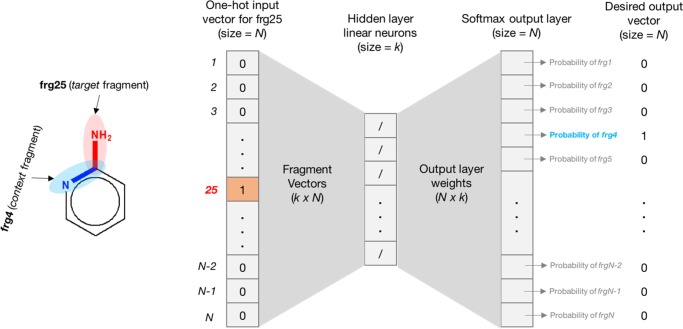
In this architecture, given the target word, the model tries to predict n words before and n words after it. The training objective is to maximize the conditional probability of observing the contextual words. Figure 11 shows skip-gram architecture for generating fragment vectors.
Figure 11.
Skip-gram neural network architecture for generating fragment vectors. The target fragment is shown in red, and its one-hot vector is fed as the input. The objective is to get the highest probability for the context fragment (shown in blue) in the softmax output layer.
4.5.2. Continuous Bag-of-Words (CBOW)
It tries to predict the target word given n words before it and n words after it. The training objective is to maximize the conditional probability of observing the target word. CBOW is several times faster to train than the skip-gram.
In both, n is the window size that specifies the number of the contextual words before and after the target word.
In the present work, three separate sets of vectors were computed for 2-, 3-, and 4-atom fragments. Both CBOW and SG models were used; however, the CBOW was found to be slightly underperforming compared to SG in various tasks presented in later sections. Therefore, only the results from SG are presented in the paper and the CBOW results are included in the Supporting Information. The resulting fragment vector size was set to 100, the window size was kept at 5, negative sample size of 5 was used, and 5 passes were made over the corpus during the training. A total of 1604, 10 162, and 37 013 fragment vectors were successfully computed for 2-, 3-, and 4-atom fragments, respectively. Fragments with less than five occurrences in the training corpus were excluded by the Word2vec procedure.
4.6. Computing Similarity between Fragment Vectors
Cosine similarity function (eq 1) was used to compute the similarity between two distributed vectors. Cosine similarity measures the similarity of orientation of two vectors and ranges from 0 to 1, i.e., if the angle between two vectors is 0°, the cosine similarity is 1.0, and the similarity is 0.0 if the angle is 90°.
| 1 |
4.7. Computing Distributed Vectors for Whole Molecules
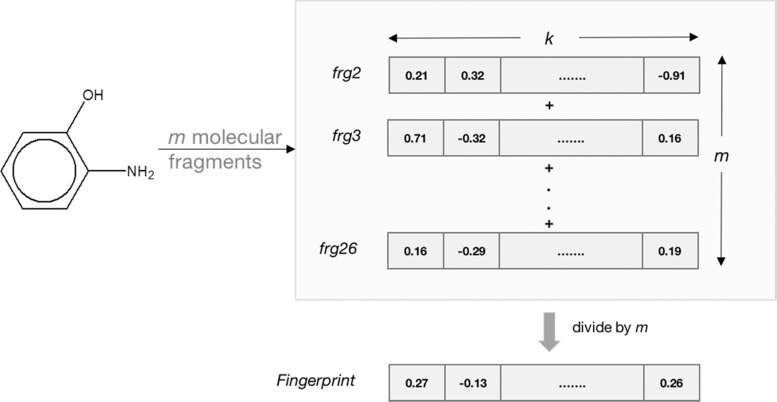
When vectors of the simple linear fragments of a molecule are added, the resulting vector represents the combined features of the whole molecule. In practice, vectors of all of the fragments of a particular size (2-, 3-, or 4-atom) of the molecule were added and the resultant vector was divided elementwise by the total number of fragments of that size in the molecule, as shown in Figure 12. Vectors of 2-, 3-, and 4-sized fragments were added separately, and the three resulting 100-element vectors were joined end-to-end to give a final 300-element vector. This computation does not involve hashing, and consequently, two or more features that are chemically different do not end up in the same bin of the fingerprint. However, every element is an average of that particular feature from all of the fragments of the molecule and may consequently result in loss of information.
Figure 12.
Computing molecular fingerprints using distributed representation of fragments; k = number of elements in the fragment vectors (e.g., 100) and m = number of fragments of a particular path length generated by breaking up the molecule in question. In the current work, three separate 100-element molecular vectors were computed (for 2-, 3-, and 4-atom fragments) and then concatenated to give a 300-element molecular fingerprint.
4.8. t-SNE Plots
t-Distributed stochastic neighbor embedding28 (t-SNE) was used for creating 2D plots for visualizing the high-dimensional vectors. In this paper, t-SNE is only used for visualizations, and all computations of similarity search, nearest neighborhood calculations, QSAR modeling, and bioactivity predictions were performed on the high-dimensional vectors directly.
Acknowledgments
The author thanks his colleagues Dr. Roustem Saiakhov and Kate Kearney for useful discussions and encouragement throughout the course of this project.
Supporting Information Available
The Supporting Information is available free of charge on the ACS Publications website at DOI: 10.1021/acsomega.7b02045.
List of kinase query ligands; recall plots for kinase ligands; chemicals that were not covered by the fragment vectors; mutagenicity and anti-HIV prediction performance as a function of different threshold values; results of vectors using CBOW architecture (PDF)
Fragment dictionaries and fragment vectors (XLSX)
The author declares no competing financial interest.
Supplementary Material
References
- Salum L. B.; Andricopulo A. D. Fragment-based QSAR strategies in drug design. Expert Opin. Drug Discovery 2010, 5, 405–412. 10.1517/17460441003782277. [DOI] [PubMed] [Google Scholar]
- Sutherland J. J.; Higgs R. E.; Watson I.; Vieth M. Chemical fragments as foundations for understanding target space and activity prediction. J. Med. Chem. 2008, 51, 2689–2700. 10.1021/jm701399f. [DOI] [PubMed] [Google Scholar]
- Rogers D.; Hahn M. Extended-connectivity fingerprints. J. Chem. Inf. Model. 2010, 50, 742–754. 10.1021/ci100050t. [DOI] [PubMed] [Google Scholar]
- Riniker S.; Landrum G. A. Open-source platform to benchmark fingerprints for ligand-based virtual screening. J. Cheminf. 2013, 5, 26 10.1186/1758-2946-5-26. [DOI] [PMC free article] [PubMed] [Google Scholar]
- Nikolova N.; Jaworska J. An approach to determining applicability domain for QSAR group contribution models: an analysis of SRC KOWWIN. ATLA, Altern. Lab. Anim. 2005, 33, 461–470. [DOI] [PubMed] [Google Scholar]
- Mikolov T.; Sutskever I.; Chen K.; Corrado G.; Dean J.. Distributed Representations of Words and Phrases and Their Compositionality. In Advances in Neural Information Processing Systems; 2013; Vol. 26, pp 3111–3119. [Google Scholar]
- Bengio Y.; Ducharme R.; Vincent V.; Jauvin C. A neural probabilistic language model. J. Mach. Learn. Res. 2003, 3, 1137–1155. [Google Scholar]
- Collobert R.; Weston J. In A Unified Architecture for Natural Language Processing: Deep Neural Networks with Multitask Learning, Proceedings of the 25th International Conference on Machine Learning (ICML-08), 2008; pp 160–167.
- Mikolov T.; Chen K.; Corrado G.; Dean J.. Efficient Estimation of Word Representations in Vector Space. 2013, arXiv:1301.3781v3. arXiv.org e-Print archive. https://arxiv.org/abs/1301.3781 (accessed Feb 4, 2018).
- Asgari E.; Mofrad M. R. K. Continuous distributed representation of biological sequences for deep proteomics and genomics. PLoS One 2015, 10, e0141287 10.1371/journal.pone.0141287. [DOI] [PMC free article] [PubMed] [Google Scholar]
- Cadeddu A.; Wylie E. K.; Jurczak J.; Wampler-Doty M.; Grzybowski B. A. Organic chemistry as a language and the implications of chemical linguistics for structural and retrosynthetic analyses. Angew. Chem., Int. Ed. 2014, 53, 8108–8112. 10.1002/anie.201403708. [DOI] [PubMed] [Google Scholar]
- Jaeger S.; Fulle S.; Turk S. Mol2vec: Unsupervised machine learning approach with chemical intuition. J. Chem. Inf. Model. 2018, 58, 27–35. 10.1021/acs.jcim.7b00616. [DOI] [PubMed] [Google Scholar]
- PubChem Substructure Fingerprint, V1.3. ftp://ftp.ncbi.nlm.nih.gov/pubchem/specifications/pubchem_fingerprints.txt (accessed Feb 4, 2018).
- Maggiora G.; Vogt M.; Stumpfe D.; Bajorath J. Molecular Similarity in Medicinal Chemistry. J. Med. Chem. 2014, 57, 3186–3204. 10.1021/jm401411z. [DOI] [PubMed] [Google Scholar]
- PubChem Download Service. https://pubchem.ncbi.nlm.nih.gov/pc_fetch/pc_fetch.cgi (accessed Feb 4, 2018).
- Hansen K.; Mika S.; Schroeter T.; Sutter A.; Laak A. T.; Steger-Hartmann T.; Heinrich N.; Müller K. R. Benchmark data set for in silico prediction of ames mutagenicity. J. Chem. Inf. Model. 2009, 49, 2077–2081. 10.1021/ci900161g. [DOI] [PubMed] [Google Scholar]
- Kazius J.; McGuire R.; Bursi R. Derivation and validation of toxicophores for mutagenicity prediction. J. Med. Chem. 2005, 48, 312–320. 10.1021/jm040835a. [DOI] [PubMed] [Google Scholar]
- Ghose A. K.; Crippen G. M. Atomic physicochemical parameters for three-dimensional-structure-directed quantitative structure-activity relationships. 2. Modeling dispersive and hydrophobic interactions. J. Chem. Inf. Model. 1987, 27, 21–35. 10.1021/ci00053a005. [DOI] [PubMed] [Google Scholar]
- Zhu H.; Sedykh A.; Chakravarti S. K.; Klopman G. A new group contribution approach to the calculation of LogP. Curr. Comput.-Aided Drug Des. 2005, 1, 3–9. 10.2174/1573409052952323. [DOI] [Google Scholar]
- Mysinger M. M.; Carchia M.; Irwin J. J.; Shoichet B. K. Directory of useful decoys, enhanced (DUD-E): better ligands and decoys for better benchmarking. J. Med. Chem. 2012, 55, 6582–6594. 10.1021/jm300687e. [DOI] [PMC free article] [PubMed] [Google Scholar]
- AIDS Antiviral Screen Data. https://wiki.nci.nih.gov/display/NCIDTPdata/AIDS+Antiviral+Screen+Data (accessed Feb 4, 2018).
- Owen J. R.; Nabney I. T.; Medina-Franco J. L.; López-Vallejo F. Visualization of molecular fingerprints. J. Chem. Inf. Model. 2011, 51, 1552–1563. 10.1021/ci1004042. [DOI] [PubMed] [Google Scholar]
- Řehuřek R.; Sojka P.. Software Framework for Topic Modelling with Large Corpora. In Proceedings of the LREC 2010 Workshop on New Challenges for NLP Frameworks; ELRA: Valletta, Malta, 2010; pp 45–50. [Google Scholar]
- Krijthe J. H.Rtsne: T-Distributed Stochastic Neighbor Embedding Using a Barnes-Hut Implementation, 2015. https://github.com/jkrijthe/Rtsne (accessed Feb 4, 2018).
- Lloyd S. Least squares quantization in PCM. IEEE Trans. Inf. Theory 1982, 28, 129–137. 10.1109/TIT.1982.1056489. [DOI] [Google Scholar]
- Weininger D. SMILES, a chemical language and information system. 1. Introduction to methodology and encoding rules. J. Chem. Inf. Model. 1988, 28, 31–36. 10.1021/ci00057a005. [DOI] [Google Scholar]
- Weininger D.; Weininger A.; Weininger J. L. SMILES. 2. Algorithm for generation of unique SMILES notation. J. Chem. Inf. Model. 1989, 29, 97–101. 10.1021/ci00062a008. [DOI] [Google Scholar]
- van der Maaten L. J. P.; Hinton G. E. Visualizing high-dimensional data using t-SNE. J. Mach. Learn. Res. 2008, 9, 2579–2605. [Google Scholar]
Associated Data
This section collects any data citations, data availability statements, or supplementary materials included in this article.


