Abstract
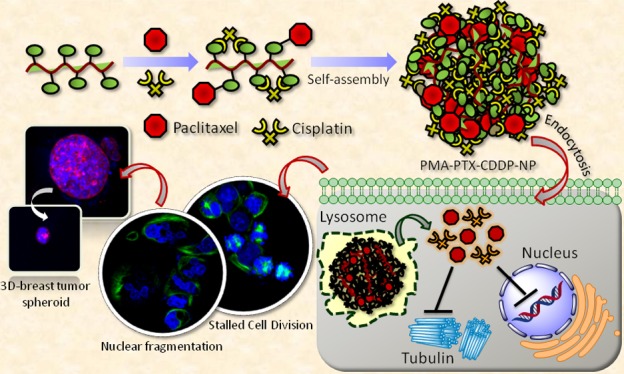
Breast cancer is the most devastating disease among females globally. Conventional chemotherapeutic regimen relies on the use of highly cytotoxic drugs as monotherapy and combination therapy leading to severe side effects to the patients as collateral damage. Moreover, combining hydrophobic and hydrophilic drugs create erratic biodistribution and suboptimal medicinal outcome. Hence, packaging multiple drugs of diverse mechanisms of action and biodistribution for safe delivery into tumor tissues with optimal dosages is indispensable for next-generation breast cancer therapy. To address these, in this report, we describe a unique cisplatin-triggered self-assembly of linear polymer into 3D-spherical sub 200 nm particles. These nanoparticles comprise a hydrophobic (paclitaxel) and hydrophilic drug (cisplatin) simultaneously in a single particle. Molecular dynamics simulation revealed hydrophilic–hydrophilic interaction and interchain H-bonding as underlying mechanisms of self-assembly. Confocal microscopy studies evidently demonstrated that these novel nanoparticles can home into lysosomes in breast cancer cells, fragment subcellular nuclei, and prevent cell division, leading to improved breast cancer cell death compared to free drug combination. Moreover, 3D-breast tumor spheroids were reduced remarkably by the treatment of these nanoparticles within 24 h. These dual-drug-loaded self-assembled polymeric nanoparticles have prospective to be translated into a clinical strategy for breast cancer patients.
1. Introduction
In recent years, breast cancer has emerged as the most frequently diagnosed cancer and foremost reason of casualties among females, with ∼1.7 million new cases and 0.6 million deaths per year globally.1 Traditional treatments involve surgical removal of tumor (or breast) along with radiation therapy, hormonal therapy, and chemotherapy.2 In adjuvant, neo-adjuvant chemotherapy and advanced stages of breast cancers, several small molecule cytotoxic drugs [paclitaxel (PTX), cisplatin (CDDP), 5-fluorouracil, and doxorubicin] are widely used in clinics.3−8 Unfortunately, because of tumor heterogeneity and drug resistance mechanisms (intrinsic and extrinsic), most of the cancer cells evade single drug treatment, leading to resort on combination therapy for improved efficacy.9−12 Drug combination regimens are exploited extensively in clinics for the treatment of breast cancer.13−16 However, cytotoxic drug combinations generate severe augmented dose-limiting toxic side effects to the patients as collateral damage. Moreover, combination of drugs with entirely different water solubility (hydrophobic and hydrophilic drugs) leads to inconsistent biodistribution, hence poor accumulation in appropriate dose in the cancerous tissue preventing desired therapeutic outcome. Nanotechnology-based tools exhibit the promise to address these issues.
In the last decade, nanoscale platforms have changed the direction of cancer chemotherapy.17−20 Myriads of different nanovectors have been developed to package multiple therapeutic materials (small molecule drugs, antibodies, siRNAs, mRNAs, and proteins).21−27 Nanoscale platforms can specifically accumulate into tumor tissues by unique dysfunctional leaky vasculature as well as receptor-mediated active targeting.28,29 Several nanovectors containing cytotoxic drugs are already in clinics or in clinical trials for the treatment of different types of cancers including breast cancer.20,30 Despite having tremendous advancement in nanotechnology-based tool kits for monodrug or combination drug delivery, amalgamating hydrophobic and hydrophilic drugs in a single nanoplatform with controlled loading and release profile remained a major challenge to overcome the erratic biodistribution and improve therapeutic efficacy.31−34
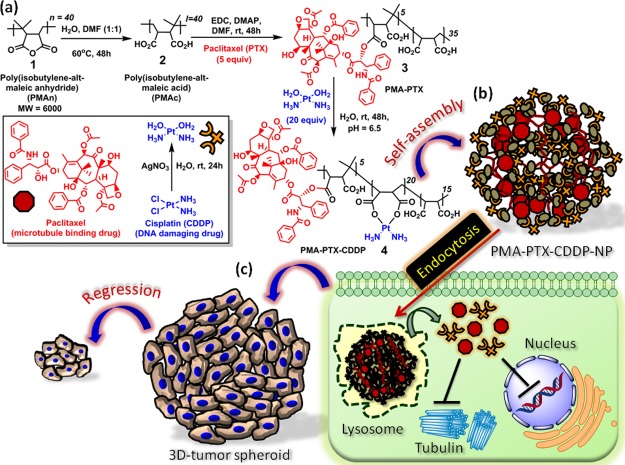
To address this, herein, we illustrate a simple and robust synthesis of CDDP-mediated self-assembled poly(isobutylene-alt-maleic anhydride) (PMAn) nanoparticles to inhibit cancer cell division leading to a significant reduction in 3D-breast cancer spheroids. These polymeric nanoparticles can comprise the hydrophobic, microtubule-stabilizing drug PTX by ester linkage. However, upon reaction with hydrophilic CDDP [Food and Drug Administration (FDA)-approved anticancer drug], a remarkable morphological conversion from 2D-structures into 3D-spherical nanoparticles was observed. Molecular dynamics (MD) simulation confirmed that the hydrophilic–hydrophilic interaction and interpolymer chain H-bonding triggered CDDP-mediated self-assembly of linear polymers into spherical nanoscale particles. The hydrophobic–hydrophilic dual-drug-loaded polymeric NPs were compartmentalized into subcellular lysosomes followed by nuclear fragmentation and stalled cell division directing to a significant reduction in breast cancer spheroid formation. In this study, we have chosen PTX and CDDP because of their (i) highly hydrophobic and hydrophilic nature, respectively, causing different biodistribution, (ii) extensive use as monotherapy and combination therapy in clinics because of FDA approval despite having severe toxic side effects to the patients, and (iii) different mechanisms of action.
2. Results and Discussion
2.1. Synthesis of the Polymer–Drug Conjugate and Self-Assembly
Sequential conjugation of hydrophobic–hydrophilic drugs to polymer and self-assembly are depicted in Scheme 1a,b. First, PMAn35,36 (1) was completely hydrolyzed into poly(isobutylene-alt-maleic acid) (PMAc) (2) followed by conjugation of hydrophobic drug PTX (PMAc/PTX = 1:5 molar ratio) through ester linkage with the 2′-OH group of PTX to form the PMA–PTX conjugate (3) (Scheme 1a). CDDP was further conjugated with PMA–PTX (PMA–PTX/CDDP = 1:20 molar ratio) to obtain the PMA–PTX–CDDP conjugate (4). The hydrolyzed PMAc (2), PMA–PTX conjugate (3), and PMA–PTX–CDDP conjugate (4) were characterized by 1H NMR spectroscopy (Figures S1–S3). We further calculated the number of PTX molecules conjugated in each polymer chain by 1H NMR spectroscopy. The number of CH3 protons in the polymer and PTX and the ortho-protons in aromatic ester and aromatic amide moieties in PTX were calculated from the 1H NMR spectra in Figure S3. The ratio of CH3 protons and aromatic protons confirmed that nearly five PTX molecules were conjugated in each polymer chain. PMA–PTX–CDDP conjugate (4) was further confirmed by 195Pt NMR having a characteristic peak at δ = −2572.6 ppm (Figure S4).
Scheme 1. (a) Conjugation of PTX and CDDP with PMAn. (b) Schematic Representation of Self-Assembly of PMA–PTX–CDDP Conjugate into Spherical Nanoparticles. (c) Schematic Representation of Cellular Internalization of PMA–PTX–CDDP-NPs into Cancer Cells Lead to the Reduction of 3D-Tumor Spheroids.
To visualize the shape and morphology, the PMA–PTX conjugate (3) was subjected to field-emission scanning electron microscopy (FESEM). From the FESEM image in Figure 1a, it was confirmed that the PMA–PTX conjugate exhibited a polymeric 2D-sheet-like structure. Interestingly, a remarkable transformation of morphology was observed in the PMA–PTX–CDDP conjugate (4). Electron microscopy [FESEM, atomic force microscopy (AFM), and transmission electron microscopy (TEM)] images (Figures 1b,c and S5c) clearly demonstrated that the reaction with the hydrophilic drug CDDP to PMA–PTX transformed its shape into spherical nanoparticles of sub 200 nm diameter. We further confirmed the self-assembled particle nature of the PMA–PTX–CDDP conjugate in water by dynamic light scattering (DLS) and the Tyndall effect (Figure S5a,b). The critical aggregation concentration (CAC) at which the PMA–PTX–CDDP conjugate self-assembled into nanoparticles was determined by conventional fluorescence emission spectroscopy of pyrene encapsulation and was calculated to be 60 μg/mL (Figure 1d). The loading of PTX and CDDP in the nanoparticle was determined by UV–vis spectroscopy through the absorbance versus concentration calibration graph at characteristic λmax = 273 and 706 nm, respectively. PTX and CDDP loading was found to be 202.9 ± 8 μM and 1563.0 ± 3 μM, respectively (Figure S5d). Finally, the presence of CDDP in PMA–PTX–CDDP-NP was further validated by energy-dispersion X-ray spectroscopy (EDXS) (Figure S6).
Figure 1.
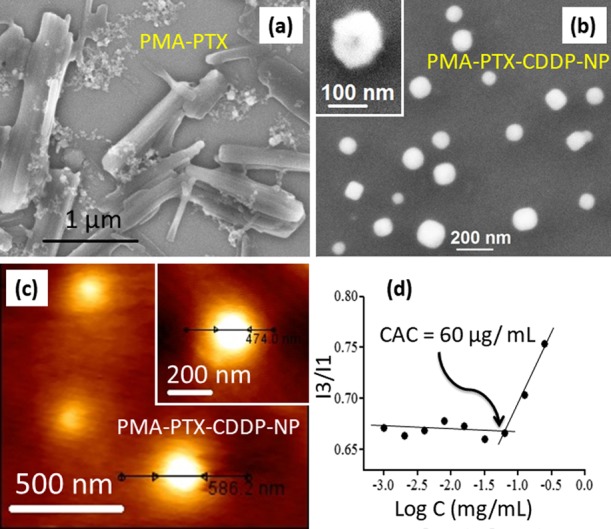
(a,b) FESEM images of the PMA–PTX conjugate and PMA–PTX–CDDP-NPs ,respectively, inset: high resolution FESEM image of PMA–PTX–CDDP-NP. (c) AFM image of PMA–PTX–CDDP-NPs, inset: high resolution AFM image. (d) Determination of CAC of the PMA–PTX–CDDP conjugate by fluorescence emission spectra of pyrene encapsulation.
2.2. CDDP-Induced Self-Assembly
2.2.1. Electron Microscopy (FESEM and AFM)
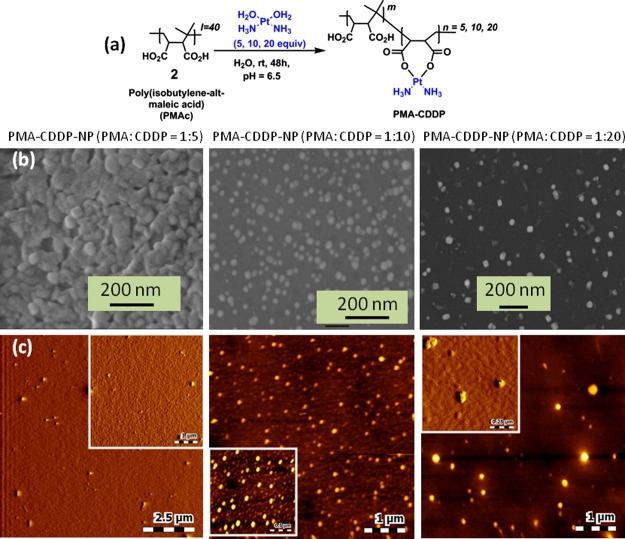
To understand the role of CDDP in inducing the self-assembly, we reacted PMAc (2) with aquated CDDP in a ratiometric manner (PMAc/CDDP = 1:5, 1:10, and 1:20 molar ratio) to obtain PMAc–CDDP conjugates with different CDDP contents (Figure 2a). The morphological transformation of PMAc–CDDP conjugates were further visualized by FESEM and AFM. FESEM images in Figure 2b evidently confirmed that CDDP induced the self-assembly of linear polymer PMAc into spherical shaped nanoparticles in PMAc/CDDP = 1:10 molar ratio. The same observation was further validated by AFM images (Figure 2c) which confirmed that CDDP is the responsible agent for self-assembly of polymeric PMAc. The presence of CDDP in PMA–CDDP-NPs was further confirmed by EDXS (Figure S7).
Figure 2.
(a) Synthetic scheme of PMAc with different molar ratios of CDDP. (b,c) FESEM and AFM images of PMA–CDDP-NPs in different molar ratios to evaluate CDDP-mediated self-assembly, respectively.
2.2.2. Molecular Dynamics Simulation
To evaluate the mechanism of self-assembly, MD simulation was performed on the PMA–PTX–CDDP polymer chain having the PTX/CDDP molar ratio of 1:4 using GROMACS-4.6.3 package.37 The initial energy minimized structure and self-assembled structures after 500 ns of simulation (Figure 3a,b) showed that PTX, CDDP, and polymeric carboxylic acid (−COOH) groups were distributed throughout the whole self-assembled structure. To understand the structural arrangements between hydrophobic PTX, the center of masses (COM) between PTX monomers were calculated over last 10 ns of simulation trajectory. The small peak near 1.3 nm (Figure S8) indicated that PTX units tend to aggregate near each other, although because of other predominant interactions (H-bonding), hydrophobic aggregation was not enhanced as expected.
Figure 3.
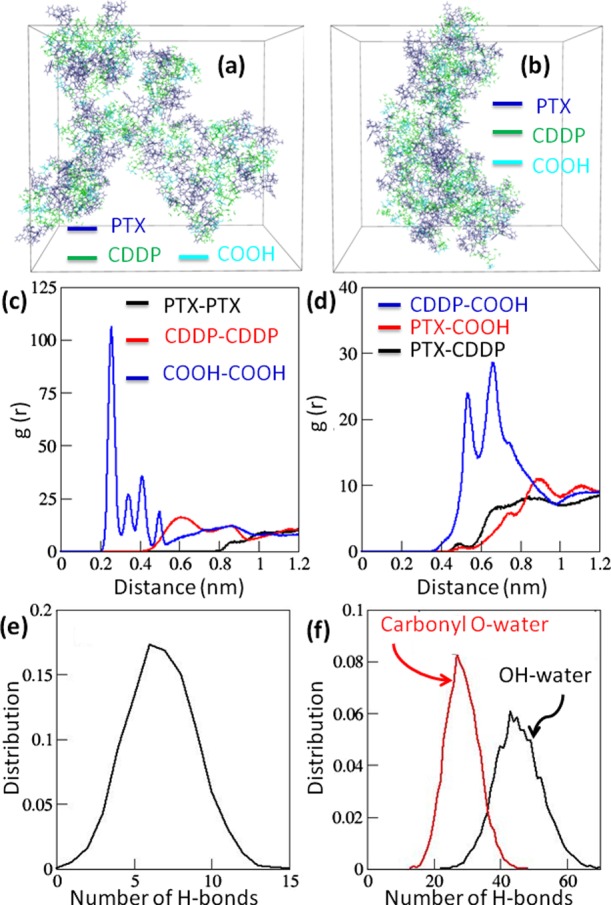
(a) Structure of energy-minimized PMA–PTX–CDDP polymer chains dispersed in water. (b) Snapshot of self-assembled chains of the PMA–PTX–CDDP conjugate after 500 ns simulation time. Water is not shown for clarity. (c,d) RDFs between similar types and different types of residues averaged over 10 ns of simulation time, respectively. (e) Distribution of the number of interchain hydrogen bonds in the polymer over last 10 ns of simulation time. (f) Distribution of number of different types of polymer–water hydrogen bonds over last 10 ns of simulation time.
To evaluate the interaction between hydrophobic (PTX) and hydrophilic (CDDP, COOH) residues near each other, the radial distribution function (RDF) between similar types as well as different types of residues were calculated (Tables S1–S3). Figure 3c clearly delineated that polymeric COOH groups remained closest to each other (within 0.5 nm), whereas CDDP residues remained more distant from each other (∼0.6 nm and higher). By contrast, as expected hydrophobic PTX residues were not found to be aggregated. On the other hand, RDF between different types of residues showed sharp peaks between hydrophilic CDDP and COOH groups (Figure 3d). Additionally, hydrophobic PTX showed interactions to a lesser extent with hydrophilic COOH and CDDP residues because of their hydrophobic mismatch and steric bulk. Furthermore, the hydrogen bonding interaction between polymer chains may play a role in the process of self-assembly. The different types of hydrogen bond donor and acceptor sites like −OH, −NH, and −C=O are present in the polymer chain. This gives rises to the possibility of formation of hydrogen bonds in between different monomers of the same polymer chain (intramolecular) and in between different chains (intermolecular). The distance distribution was calculated between different possible H-bonding donor and acceptor sites (−OH, −NH–, and −CO−), which showed that H-bonds formed only in between −OH and −CO– groups (Figure S9). Further calculation over 10 ns of simulation time revealed six interchains, an insignificant number of intrachains, and a high number of H-bonds to be formed with water molecules (Figure 3e,f). This MD simulation study illustrated the self-assembly of the PMA–PTX–CDDP polymer into nanoparticles through the interpolymer chain H-bonding and hydrophilic–hydrophilic interaction between COOH and CDDP residues.
2.3. Cellular Internalization and Drug Release
2.3.1. Cellular Internalization
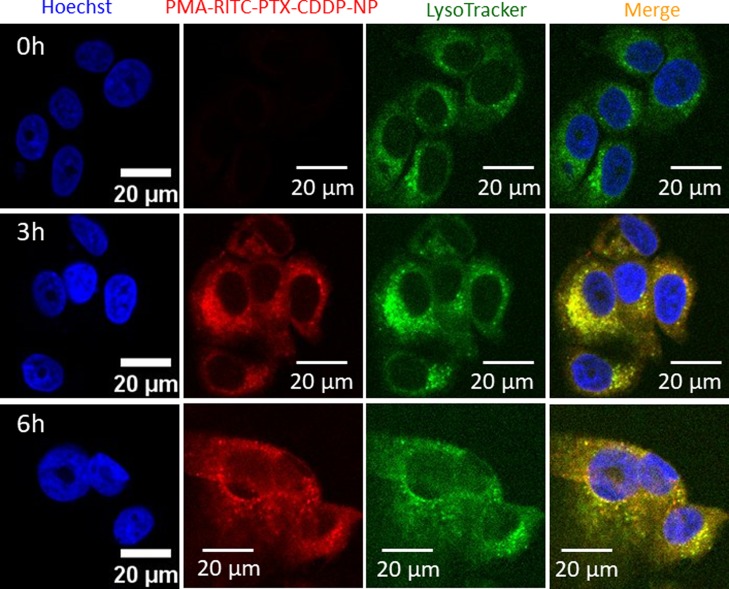
For effective delivery of hydrophobic and hydrophilic drugs together, the nanovector needs to be internalized inside the cancer cells. To visualize the self-assembled polymeric nanoparticles inside the cells, red fluorescent rhodamine-isothiocyanate (RITC) was tagged with PMAn through the ethylenediamine (ED) linker. First, the anhydride moiety of PMAn (1) was opened up using the ED linker [PMAn/ED = 1:5 molar ratio] to obtain the PMAn–ED conjugate (5) (Figure S10). RITC (6) was further reacted with free amine moiety of the PMAn–ED conjugate (5) to obtain the RITC-labeled PMAn–RITC conjugate (7) (PMAn–ED/RITC = 1:5 molar ratio). Both conjugates 5 and 7 were characterized by 1H NMR spectroscopy (Figures S11 and S12). The anhydride moieties of the PMAn−RITC conjugate (7) were opened up by using dimethyl formamide (DMF)/water mixture (1:1) at 60 °C for 48 h to obtain the PMAn−RITC conjugate (8), which was further conjugated with PTX and CDDP sequentially (PTX/CDDP = 1:4 molar ratio) to afford the PMAc−RITC−PTX−CDDP conjugate (9) (Figure S10). Expectedly, the PMA–RITC–PTX–CDDP conjugate (9) self-assembled into the nanoparticles, which was confirmed by FESEM and AFM images along with energy dispersive analysis of X-rays for the confirmation of CDDP in the nanoparticles (Figures S13 and S14). MCF-7 breast cancer cells were treated with PMA–RITC–PTX–CDDP-NPs in a time-dependent manner (0, 3, 6 h) followed by staining nuclei and lysosomes with Hoechst 33342 (blue) and LysoTracker DND-26 (green), respectively. Confocal laser scanning microscopy (CLSM) images clearly showed that internalization of red fluorescent PMA–RITC–PTX–CDDP-NPs was almost negligible in MCF7 cells at 0 h (Figure 4, topmost panel) having an undetectable red fluorescence signal. However, with time, PMA–RITC–PTX–CDDP-NPs internalized into MCF7 cells and localized into lysosomes in 3 and 6 h yielding merged yellow regions from LysoTracker green and red fluorescent nanoparticles observed in CLSM images (Figure 4, middle and lowermost panels). Hence, from these CLSM images it was confirmed that RITC-labeled PMA–PTX–CDDP-NPs were taken up by the breast cancer cells within 3 h and homed into acidic lysosomes. We further quantified the red fluorescence signals inside the cells at 0, 3, and 6 h using confocal microscopy. The quantification revealed that the red fluorescence intensity increased significantly at 3 h compared to 0 h (Figure S15). However, we found a negligible change in the subcellular red fluorescence intensity at 6 h compared to 3 h. This quantification corroborated that PMA–RITC–PTX–CDDP-NPs internalized into MCF7 cells within 3 h.
Figure 4.
Confocal laser scanning microscopy (CLSM) images of MCF7 cells treated with PMA–RITC–PTX–CDDP-NPs (red) in a time-dependent manner (0, 3, and 6 h). Nucleus and lysosomes were stained with Hoechst 33342 (blue) and LysoTracker DND-26 (green), respectively. Scale bar = 20 μm.
2.3.2. Drug Release
The acidic environment inside lysosomes would lead to release the active hydrophobic and hydrophilic drugs by cleavage of the acid labile ester and Pt–O coordination chemical linkages in PTX and CDDP, respectively.38,39 To evaluate the release of active drugs, the nanoparticles were incubated into pH = 5.5 buffer (lysosome mimic) and dual drug release was quantified by UV–vis spectroscopy in different time points at characteristic λmax = 273 and 706 nm for PTX and CDDP, respectively, from the absorbance versus concentration calibration graph. It was observed that 79.9 ± 4.1% and 54.9 ± 6.5% of PTX and CDDP were released slowly from the nanoparticles after 72 h, respectively (Figure 5a). Ideally, the nanoparticle should not release its payload under physiological conditions before reaching the targeted tumor tissues. To evaluate the dual drug release under physiological conditions, we incubated PMA–PTX–CDDP-NPs into phosphate buffer saline (PBS, pH = 7.4) and quantified the release of PTX and CDDP by UV–vis spectroscopy. It was observed that only 29.5 ± 2.4% and 50.0 ± 6% of CDDP and PTX were released even after 72 h at pH = 7.4 (Figure 5b). From these release studies, it was evident that PMA–PTX–CDDP-NPs released payload in the acidic environment in much improved quantities compared to physiological conditions in a slow and controlled manner over 3 days, which would be ideal for successful delivery of PTX and CDDP into tumor tissues for augmented therapeutic outcome.
Figure 5.
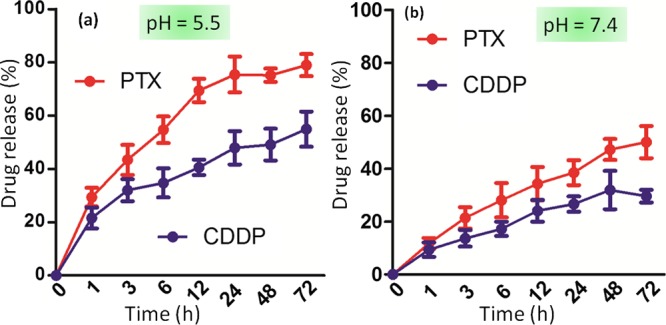
Release of active PTX and CDDP from PMA–PTX–CDDP-NPs at (a) acidic pH = 5.5 (mimicking subcellular lysosomes) and (b) physiological pH = 7.4 in a time-dependent manner over 72 h.
2.4. Targeting Nucleus and Microtubules
2.4.1. Nuclear Fragmentation
Acidic environment-mediated cleavage of PTX and CDDP from nanoparticles would target subcellular microtubules and DNA residing in nuclei, respectively.40−43 We evaluated the ability of PMA–PTX–CDDP-NPs to damage subcellular nuclei. MCF-7 cells were treated with PMA–PTX–CDDP-NPs temporally (6, 24, and 48 h), followed by staining tubulin and nuclei with α-tubulin antibody (green) and Hoechst 33342 (blue), respectively. As control, MCF-7 cells were treated with free PTX and CDDP cocktail having the same ratio in nanoparticles. CLSM images in Figure 6 clearly revealed that PMA–PTX–CDDP-NPs induced nuclear fragmentation in a time-dependent manner (Figure 6). In comparison, the free drug cocktail also fragmented the nuclei of MCF7 cells in a manner very similar to the nanoparticle treatment (Figure S16). We further quantified the fragmented cellular nuclei induced by the free drug cocktail or nanoparticles using confocal microscopy in different incubation times. It was observed that PMA–PTX–CDDP-NPs induced a similar nuclear damage (20.4 ± 8.8% and 43.4 ± 2.8%, respectively) compared to free drug cocktail treatments (16.7 ± 5.4% and 34.36 ± 5.8%, respectively) (Figure S17) at 24 and 48 h postincubation.
Figure 6.
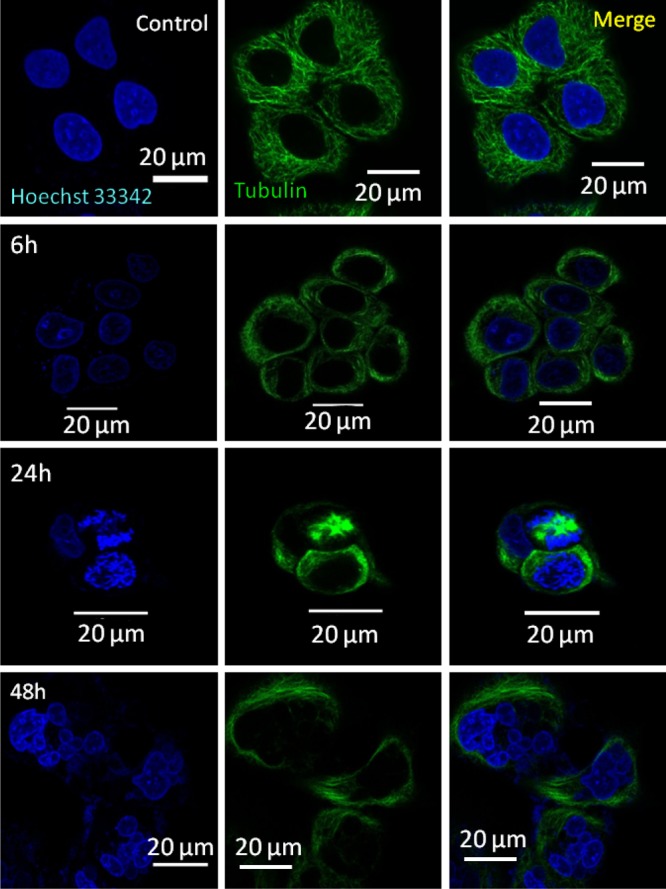
CLSM images of MCF7 cells after treatment with PMA–PTX–CDDP-NPs showing nuclear fragmentation at 6, 24, and 48 h. Nucleus and tubulin were stained with Hoechst 33342 (blue) and Alexa Fluor-labeled tubulin antibody (green), respectively. Scale bar = 20 μm.
2.4.2. Stalled Cell Division by the Microtubule Damage
Moreover, PTX binds with microtubules to stabilize them leading to the inhibition of cell division in the mitosis stage.44,45 To evaluate the effect of PMA–PTX–CDDP-NPs on cell division, MCF-7 cells were treated with nanoparticles at 6 and 24 h. Nucleus and tubulin were stained with Hoechst 33342 (blue) and α-tubulin antibody (green), respectively, followed by visualization through fluorescence confocal microscopy. CLSM images in Figure 7 showed the characteristic damaged microtubule and stalled cell division in the mitosis stage leading to the accumulation of genomic materials in the nucleus after treatment with the nanoparticles at both 6 and 24 h. We have observed a similar microtubule damage and accumulation of genomic materials in the central part of cells in free PTX and CDDP cocktail treatment (Figure S18). We further quantified the number of cells with stalled cell division using confocal microscopy. It was revealed that 24 h of nanoparticle treatment induced stalled division in 22% of the cells whereas only 7% of cells that were treated with free PTX and CDDP cocktail exhibited stalled division (Figure S19).The remarkable increase in the stalled cell division upon nanoparticle treatment compared to free drug combination can be attributed to the simultaneous improved cellular internalization of PTX and CDDP through nanoparticles. By contrast, free PTX and CDDP have vastly different aqueous solubility leading to the erratic cellular internalization in right dosages to interact with their respective subcellular targets.
Figure 7.
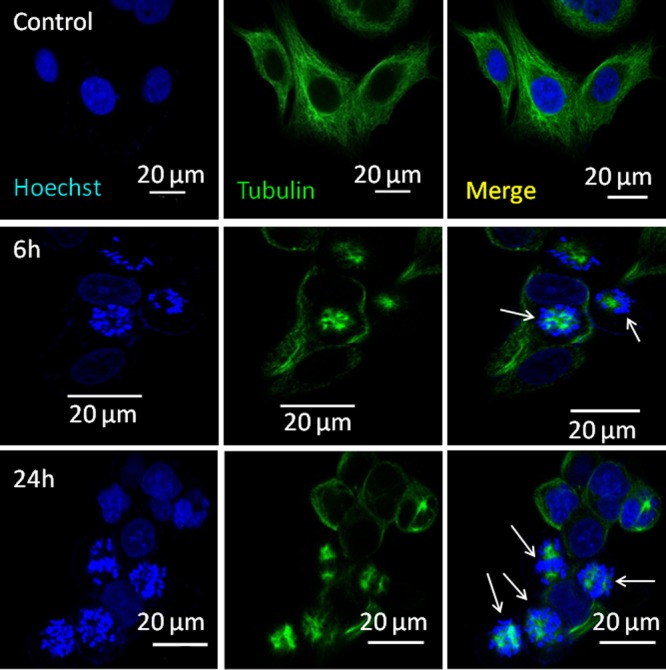
CLSM images of MCF7 cells after treatment with PMA–PTX–CDDP-NPs showing stalled cell division at 6 and 24 h. Nucleus and tubulin were stained with Hoechst 33342 (blue) and Alexa Fluor-labeled tubulin antibody (green), respectively. Scale bar = 20 μm.
2.5. Reduction of 3D-Breast Cancer Spheroids
Nanoparticle-mediated fragmentation of nucleus and inhibition of cell division lead to cellular death. To assess the effect of nanoparticles on the cancer cell death, MCF-7 cells were incubated with PMA–PTX–CDDP-NPs in a dose-dependent manner for 24 h, and cell viability was measured by the MTT assay. As control, MCF7 cells were treated with free PTX and CDDP combination. Interestingly, PMA–PTX–CDDP-NPs induced cell death with IC50 = 0.29 μM (Figure S20a). By contrast, free drug combination showed much higher IC50 = 4.06 μM compared to nanoparticle treatment. For successful translation of the nanoplatforms having multiple drugs as payload, the vector should not show any toxicity profile itself. To investigate the toxicity profile of our polymer vector PMAn, we treated MCF7 cells with PMAn in a dose-dependent manner for 24 h and evaluated the cell viability with the MTT assay. Interestingly, PMAn showed negligible cytotoxicity in MCF-7 cells even at 10 μM concentration after 24 h (Figure S20b). This cell viability assay clearly indicated that PMAn has potential for further translation to clinics.
Finally, we evaluated the effect of the nanoparticles in 3-dimensional cultures as in vivo mimic. MCF7 cells were grown over Matrigel to develop 3-dimensional spheroids over 8 days. 3D-MCF7 spheroids were treated with PMA–PTX–CDDP-NPs for 24 h, and the spheroids were allowed to grow for 16 more days. Finally, the nuclei and actin in 3D-MCF7 spheroids were stained with Hoechst 33342 (blue) and Alexa Fluor-labeled phalloidin 568 (red), respectively. The spheroids were visualized by CLSM. Figure 8 evidently showed that PMA–PTX–CDDP-NPs reduced the size of the MCF7 spheroids significantly compared to non-nanoparticle-treated MCF7 spheroids. We further quantified the 3D-MCF7 breast tumor spheroids by measuring the surface area and volume of the acini. It was observed that PMA–PTX–CDDP-NPs remarkably reduced the surface area and volume of 3D-MCF7-spheroids (Figure S21). The reduction in the size of the acini can be attributed to either cell death or inhibition of cell division. Thus, taking into consideration the results of the cytotoxicity assay as well as the 3D spheroid assay, it can be concluded that PMA–PTX–CDDP-NPs killed the MCF7 breast cancer cells extraordinarily with no significant toxicity for the starting polymeric vector used for dual drug conjugation.
Figure 8.
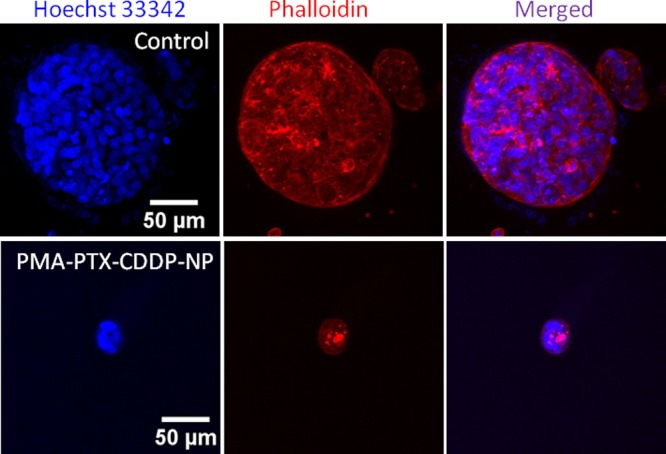
CLSM images of 3D-MCF7 tumor spheroids treated with PMA–PTX–CDDP-NPs for 24 h. Nucleus and cytoskeletal proteins were stained with Hoechst 33342 (blue) and Alexa Fluor-labeled phalloidin (red), respectively. Scale bar = 50 μm.
3. Conclusions
In conclusion, this present work demonstrates the unique CDDP-induced self-assembly of linear polymers into spherical nanoparticles which can encompass hydrophobic and hydrophilic drugs simultaneously. The essential mechanism for self-assembly was determined by MD simulation and found to be the interaction between hydrophilic moieties as well as interpolymer chain H-bonding. These hydrophobic–hydrophilic drug-loaded polymeric nanoparticles were taken up by the breast cancer cells into lysosomes, leading to nuclear fragmentation and stalled cell division in mitosis by inhibiting microtubule formation. The nanoparticles demonstrated a remarkable cell death in vitro as well as a 3D-tumor spheroid model. We foresee that our new approach of polymeric nanoparticles has an immense potential for future translation into clinics for combination therapy in breast cancer.
4. Experimental Section
4.1. Materials
PMAn, CDDP, anhydrous DMF, silver nitrate, o-phenylenediamine, N-(3-dimethylaminopropyl)-N′-ethylcarbodiimide hydrochloride (EDC), N,N-dimethyl amino pyridine (DMAP), pyrene, ethylenediamine, rhodamine B isothiocyanate, dimethyl sulfoxide (DMSO-d6), methanol-d4, and silicon wafer for FESEM were bought from Sigma-Aldrich. PTX was purchased from Selleck Chemical. Dialysis membranes (3.5 kDa) were purchased from Spectrum Labs. MCF7 cells were procured from ECACC. Dulbecco’s modified Eagle’s medium (DMEM), fetal bovine serum (FBS), LysoTracker Green DND-26, Hoechst 33342, SlowFade Gold antifade, and Alexa Fluor-conjugated phalloidin 568 were purchased from Invitrogen. MTT reagent and tissue culture grade DMSO were purchased from Sigma-Aldrich. 96-well flat-bottomed tissue-culture plates were obtained from Corning.
4.2. Synthesis of PMAc 2
PMAn (20 mg) was dissolved in a 5 mL DMF/water (1:1) mixture and stirred at 60 °C until the turbid solution turns into a clear solution. This solution was cooled to room temperature and subjected to dialysis [molecular weight cut-off (MWCO): 3.5 kDa] against water for 24 h. The dialyzed solution was lyophilized to get dry PMAc.
4.3. Synthesis of PMA–PTX Conjugate 3
Polymer 2 (10 mg, 0.00149 mmol) was dissolved into 1 mL of dry DMF in a round-bottom flask under inert atmosphere. EDC (4.4 mg, 0.022 mmol) and DMAP (0.9 mg, 0.00745 mmol) were added into polymer 2 followed by stirring at room temperature for 10 min. PTX (6.36 mg, 0.00746 mmol) was added into activated polymer 2, and the reaction mixture was stirred for 48 h. The reaction was quenched by adding 0.1 N HCl, and PMA–PTX was dialyzed (MWCO = 3.5 kDa) against water for 48 h to remove organic solvents and reagents used. The pure PMA–PTX conjugate was lyophilized.
4.4. Synthesis of Aquated CDDP
Synthesis of aquated CDDP was carried out as shown in ref (46).
4.5. Synthesis of PMA–PTX–CDDP Conjugate 4
PMA–PTX conjugate 3 (5 mg, 0.0005 mmol) was dissolved in 1 mL of DMF followed by the addition of aquated CDDP (520 μL, 2.6 mg, 0.01 mmol). The reaction mixture was then stirred at room temperature under dark conditions. After 24 h, the solvent was evaporated. The crude product was resuspended in 5 mL of water and dialyzed (MWCO = 3.5 kDa) against water for 24 h to remove unreacted CDDP. Dialyzed pure PMA–PTX–CDDP conjugate 4 was further lyophilized to obtain the solid compound.
4.6. Synthesis of PMA–ED Conjugate 5
PMAn (25 mg, 0.0041 mmol) was dissolved in dry DMF under inert conditions and cooled to 0 °C followed by the addition of ED (1.39 μL, 0.02085 mmol). The reaction mixture was stirred for 24 h at room temperature. The reaction was quenched by adding 4 mL of distilled water. The crude product was dialyzed (MWCO = 3.5 kDa) against water to remove excess ED. PMA–ED conjugate 5 was obtained as a solid compound after lyophilization.
4.7. Synthesis of PMA–Rhodamine B Isothiocyanate Conjugate 7
Polymer 5 (10 mg, 0.0016 mmol) was dissolved in 1 mL of dry DMF followed by the addition of rhodamine B isothiocyanate (4.3 mg, 0.008 mmol) and N,N-diisopropylethylamine. The reaction was stirred for 24 h at room temperature under dark conditions. The reaction was quenched with 4 mL of distilled water and the product was dialyzed (MWCO = 3.5 kDa) against water for 24 h. PMA–RITC conjugate 7 was obtained after lyophilization.
4.8. Synthesis of PMA–RITC–PTX–CDDP Conjugate 9
Polymer 7 was dissolved in the DMF/water (1:1) mixture and stirred for 24 h at 60 °C to obtain polymer 8 after lyophilization. Polymer 8 (6.5 mg, 0.00064 mmol) was dissolved in 1 mL DMF and activated with EDC (1.83 mg, 0.0096 mmol) and DMAP (0.77 mg, 0.00064 mmol) for 30 min at room temperature. PTX (2.7 mg, 0.0032 mmol) was added in the reaction mixture and stirred for 24 h. The reaction was quenched with 4 mL of water followed by dialysis (MWCO = 3.5 kDa) against water for 24 h. The PMA–RITC–PTX conjugate was obtained as a solid powder after lyophilization. The PMA–RITC–PTX conjugate (10 mg, 0.00069 mmol) was dissolved in 1 mL DMF and aquated CDDP (3.5 mg, 0.00138 mmol) was added into the reaction mixture. The reaction was stirred for 24 h at room temperature. The reaction was quenched with 4 mL of water and PMA–RITC–PTX–CDDP conjugate 9 was purified by dialysis against water for 24 h followed by lyophilization to afford the solid product.
4.9. Size, Shape, and Morphology of the Self-Assembled Nanoparticles
The size, shape, and morphology of the nanoparticles were determined by DLS, FESEM, AFM, and TEM. Sample preparation was performed by the protocol mentioned in ref (47).
4.10. Determination of the Critical Aggregation Constant (CAC)
Pyrene (2.5 × 10⁻⁵ mol L–1) in acetone was added to 10 different vials, and acetone was evaporated. Different amounts of PMA–PTX–CDDP conjugate 4 were added to the above vials followed by the addition of 2 mL of water. The vials were subjected to sonication for 10 min. The fluorescence emission spectra of all samples were recorded on an LS-50B luminescence spectrometer (PerkinElmer Co.) at 337 nm excitation wavelength and 4 nm slit width. The I3/I1 values of all solution were recorded and plotted against concentration.
4.11. Molecular Dynamics Simulation
The polymer chain considered for MD simulation consists of three different monomers. Two substituting groups of different hydrophobicity are attached to the backbone PMA chain with 1:4 molar ratio resulting in three types of monomers. These three monomers are designated as A in which the substituting group is hydrophobic PTX, B where the square planar ammonia, oxo-platinum complex which is hydrophilic in nature attached through its oxygen atoms, and C where there is no substitution.
4.11.1. Preparation of the Polymer Chain
Geometry-optimized (using Gaussian 09 for quantum chemical QM calculations48) individual monomers are taken for building the polymer chain. Monomer A and monomer C are QM-optimized using B3LYP functional and 6-311G(d,p) basis set. The optimization of monomer B is performed by using B3LYP functional and mixed basis set of 6-311G(d,p) for nontransition metal atoms and LANL2DZ with MWB60 core potential for Pt atoms. These QM-optimized monomers are randomly connected to build the polymer chain.
4.11.2. Force Field for the Polymer
The bonded and nonbonded parameters of the PMA backbone are taken from CHARMM36 force field.49,50 The force field parameters of PTX are collected from the work of Kulkarni et al.,51 which is CHARMM-based force field. However, because of the unavailability of parameters for the square planar Pt-complex in CHARMM force field, the bonded parameters of square planar Pt [(NH3)2–O)2] group taken from the work on the oxaliplatin complex by Cundari et al.52 We have calculated parameters which were not available in the literature. The harmonic angle constant (Kθ) of N–Pt–O, was calculated by performing QM calculations with varying angles. As the parameters of Pt–coordinated O–carbonyl C angle are corresponding to C (alkane)–X–Y parameter, these are taken from CHARMM36 force field. The dihedral angle potential parameters associated with Pt were taken from Cundari et al.52 The dihedral parameters for coordinated ammine H–coordinated N–Pt–coordinated ammine N were calculated by QM. All the calculated parameters are given in the Tables S2 and S3. The other dihedrals which are not associated with Pt atoms were taken from CHARMM36 force field. The nonbonded Lennard-Jones (LJ) potential parameters (σii and εii) for Pt and coordinated N were taken from the work of Scheeff et al.53 The partial charges of atoms in monomer B were calculated by QM using the Marciniak and Kuczynski (MK) method using the same basis set as mentioned above and given in Table S1.54
4.11.3. Solvation of Polymer Chains in Water
All the MD simulations were carried out using GROMACS-4.6.3 package.37 Each polymer chain consists of A5B20C15 monomers. The polymer chains were solvated in water and energy minimized using the steepest descent algorithm to avoid overlaps of the atomic coordinates. Then, simulated annealing steps (SA) were performed in the temperature range of 300–550 K to reach energetically lower conformation of polymer chains. The conformation obtained after 6 cycles of SA was taken for randomly packing nine such polymer chains into a simulation box of lengths 9.9, 9.55, 9.02 nm in X, Y, and Z directions. Then, the polymer chains are solvated with an extended simple point charge model55 of water molecules so that the weight ratio of polymer and water becomes 1:3.2. Then, the system is energy-minimized using the steepest descent method. Pressure was maintained at 1 bar with Berendsen Barostat56 by applying coupling constant of 1 ps. A Berendsen thermostat was employed to keep the temperature at 300 K by using the coupling constant value of 0.1 ps. The van der Waals interaction between nonbonded atoms were evaluated using the LJ 12-6 potential up to a cut-off distance of 1.2 nm. The electrostatic interaction was calculated with a cut-off value of 1.2 nm. Long-range electrostatic interactions were treated by the particle-mesh Ewald method.57 Then, the polymer–water system was energy-minimized and the NPT simulation was carried out for 500 ns. The last 10 ns of trajectory was analyzed for calculating the distance distribution between the COM between PTX monomers and the RDF between the COM of similar and different types of monomers and the number of interchains and polymer–water hydrogen bonds. The MD simulation was performed on self-assembled polymers in water. We have analyzed the reason behind the self-assembly of polymer in water.
4.11.4. Determination of Hydrogen Bonding Interaction Sites
The distances between the hydrogen bond and hydrogen bond acceptor sites are calculated for different possible hydrogen bonding sites present in the polymer chain. These distances are calculated over the last 10 ns of trajectory and converted into their histograms, normalized with the number of frames (Figure S13a). The −OH···O=C pair of interaction only falls under the distance criteria for the hydrogen bond formation (<0.26 nm) and is shown in Figure S13a. The angle distributions corresponding to these pairs have been calculated (Figure S13b), which shows that the hydroxyl O–hydroxyl H–carbonyl oxygen O angle falls under the criteria (>130°) of hydrogen bonding. The number of these hydrogen bonds are calculated and described in the main text.
4.12. MTT Cytotoxicity Assay
MCF7 cells were grown in DMEM supplemented with 10% FBS. MCF7 cells were seeded at a density of 0.5 × 10⁴ cells per well in a 96-well flat-bottomed tissue-culture-treated plate in DMEM. The cells were maintained for 16 h at 37 °C. Varying doses of the PMA–PTX–CDDP-NPs were added to the cells and incubated for 24 h. Media was aspirated and freshly prepared 0.5 mg/mL of MTT solution diluted in DMEM was added to cells. Following 4 h of incubation at 37 °C, the medium was aspirated and the formazan crystals formed were dissolved by adding 100 μL of DMSO. Absorbance was measured on a Varioskan Flash multimode plate reader (Thermo Scientific) at 570 nm.
4.13. Internalization Studies
MCF7 cells were seeded on coverslips at a density of 5 × 10⁵ cells per well of a 6-well dish and incubated overnight in a 5% CO2 incubator at 37 °C for 16 h. The cells were treated with PMA–RITC–PTX–CDDP-NPs for 0, 3, and 6 h. Cells were fixed with 4% formaldehyde for 10 min at 4 °C. Lysosomes were labeled by incubating the cells with LysoTracker Green DND-26 at 37 °C for 45 min. This was followed by three washes with PBS, and the nuclei were counterstained with Hoechst 33342 for 5 min at room temperature. SlowFade Gold antifade was used to mount the slides, and the images were captured in a LSM710 laser scanning confocal microscope (Carl Zeiss, GmbH) using a 63×-oil objective.
4.14. 3D Cultures
MCF7 cells were seeded in 8-well chambered coverglass coated with 50 μL of Matrigel at a density of 2 × 10⁴ cells per well.58,59 The cultures were grown in a 5% CO2 incubator at 37 °C in DMEM supplemented with estradiol (0.1 nM), insulin (250 ng/mL), and hydrocortisone (1.4 μM). The culture was replenished with fresh media every 4 days. PMA–PTX–CDDP-NPs were added to the spheroids on day 8 for 24 h, and then the culture was further maintained till day 16.
4.15. Immunofluorescence
MCF7 cells treated with PMA–PTX–CDDP-NPs and free PTX–CDDP cocktails were fixed with 4% paraformaldehyde at room temperature for 15 min followed by permeabilization at 4 °C using 0.5% Triton-X 100. Blocking was done in the IF buffer containing 10% goat serum. α-Tubulin antibody was added in 1:5000 dilution, and the cells were incubated overnight at 4 °C. Following washes, Alexa Fluor-conjugated secondary antibodies were added. After 1 h of incubation, nuclei were counterstained with Hoechst 33342, and coverslips were mounted using SlowFade Gold antifade mounting media and visualized under a 63× objective of the LSM710 laser scanning confocal microscope (Carl Zeiss, GmbH).
Fragmented nucleus and unfragmented nucleus were observed and manually classified into the two groups. The percentage was calculated taking into consideration the number of cells showing fragmented nucleus as well as the total number of cells imaged from randomly selected fields.
16 day 3D cultures were subjected to immunofluorescence as per standard protocols. Briefly, the cultures were fixed using 4% paraformaldehyde for 15 min at room temperature, followed by permeabilizing with 0.5% Triton-X at 4 °C for 10 min. This was followed by blocking and incubation with Alexa Fluor-conjugated phalloidin 568, and the nuclei were counterstained with Hoechst 33342. Images were captured with the LSM710 laser scanning confocal microscope (Carl Zeiss, GmbH) using a 25×-oil objective.
The confocal images were analyzed for volume of acini using Huygens Professional Software (SVI, Hilversum, Netherlands). Graphs were plotted and statistical analysis was done using GraphPad Prism software (GraphPad Software, La Jolla, CA, USA).
Acknowledgments
S.B. is thankful to the Department of Biotechnology (BT/RLF/Re-entry/13/2011, BT/PR9918/NNT/28/692/2013, and BT/PR14724/NNT/28/831/2015). S.P. and S.S. acknowledge CSIR-UGC for doctoral fellowship. M.L. is thankful to the Department of Biotechnology (DBT), Govt. of India. (BT/PR8699/MED/30/1018/2013). L.A. and M.B. were funded by DST-INSPIRE Fellowship and DST-INSPIRE scholarship, respectively. Author S.S. and S.R. acknowledge Dr. Chandan K. Choudhury and Dr. Prithvi R. Pandey for having useful discussions with them.
Supporting Information Available
The Supporting Information is available free of charge on the ACS Publications website at DOI: 10.1021/acsomega.7b01400.
1H NMR spectra, 195Pt NMR spectra, light scattering experiments, EDXS data, FESEM images, AFM images, MD simulation data, confocal microscopy images and quantification, MTT data, and 3D-tumor spheroid quantification data (PDF)
Author Contributions
S.P. and L.A. contributed equally to this work. The manuscript was written through contributions of all authors. All authors have given approval to the final version of the manuscript. S.B., M.L., and S.R. conceived the project. S.P., L.A., S.S., and M.A. completed the experiments and analyzed the data together. S.B., M.L., and S.R. wrote the manuscript.
The authors declare no competing financial interest.
Supplementary Material
References
- Torre L. A.; Bray F.; Siegel R. L.; Ferlay J.; Lortet-Tieulent J.; Jemal A. Global cancer statistics, 2012. Ca-Cancer J. Clin. 2015, 65, 87–108. 10.3322/caac.21262. [DOI] [PubMed] [Google Scholar]
- Miller A. B.; Hoogstraten B.; Staquet M.; Winkler A. Reporting results of cancer treatment. Cancer 1981, 47, 207–214. . [DOI] [PubMed] [Google Scholar]
- Holmes F. A.; Walters R. S.; Theriault R. L.; Buzdar A. U.; Frye D. K.; Hortobagyi G. N.; Forman A. D.; Newton L. K.; Raber M. N. Phase II trial of taxol, an active drug in the treatment of metastatic breast cancer. J. Natl. Cancer Inst. 1991, 83, 1797–1805. 10.1093/jnci/83.24.1797-a. [DOI] [PubMed] [Google Scholar]
- Silver D. P.; Richardson A. L.; Eklund A. C.; Wang Z. C.; Szallasi Z.; Li Q.; Juul N.; Leong C.-O.; Calogrias D.; Buraimoh A. Efficacy of neoadjuvant cisplatin in triple-negative breast cancer. J. Clin. Oncol. 2010, 28, 1145–1153. 10.1200/jco.2009.22.4725. [DOI] [PMC free article] [PubMed] [Google Scholar]
- Buzdar A. U.; Valero V.; Ibrahim N. K.; Francis D.; Broglio K. R.; Theriault R. L.; Pusztai L.; Green M. C.; Singletary S. E.; Hunt K. K. Neoadjuvant therapy with paclitaxel followed by 5-fluorouracil, epirubicin, and cyclophosphamide chemotherapy and concurrent trastuzumab in human epidermal growth factor receptor 2-positive operable breast cancer: an update of the initial randomized study population and data of additional patients treated with the same regimen. Clin. Cancer Res. 2007, 13, 228–233. 10.1158/1078-0432.ccr-06-1345. [DOI] [PubMed] [Google Scholar]
- Paridaens R.; Biganzoli L.; Bruning P.; Klijn J. G. M.; Gamucci T.; Houston S.; Coleman R.; Schachter J.; Van Vreckem A.; Sylvester R. Paclitaxel versus doxorubicin as first-line single-agent chemotherapy for metastatic breast cancer: a european organization for research and treatment of cancer randomized study with cross-over. J. Clin. Oncol. 2000, 18, 724. 10.1200/jco.2000.18.4.724. [DOI] [PubMed] [Google Scholar]
- Aas T.; Børresen A.-L.; Geisler S.; Smith-Sørensen B.; Johnsen H.; Varhaug J. E.; Akslen L. A.; Lønning P. E. Specific p53 mutations are associated with de novo resistance to doxorubicin in breast cancer patients. Nat. Med. 1996, 2, 811–814. 10.1038/nm0796-811. [DOI] [PubMed] [Google Scholar]
- Di Leo A.; Gancberg D.; Larsimont D.; Tanner M.; Jarvinen T.; Rouas G.; Dolci S.; Leroy J.-Y.; Paesmans M.; Isola J. HER-2 amplification and topoisomerase IIα gene aberrations as predictive markers in node-positive breast cancer patients randomly treated either with an anthracycline-based therapy or with cyclophosphamide, methotrexate, and 5-fluorouracil. Clin. Cancer Res. 2002, 8, 1107–1116. [PubMed] [Google Scholar]
- Meacham C. E.; Morrison S. J. Tumour heterogeneity and cancer cell plasticity. Nature 2013, 501, 328–337. 10.1038/nature12624. [DOI] [PMC free article] [PubMed] [Google Scholar]
- Burrell R. A.; McGranahan N.; Bartek J.; Swanton C. The causes and consequences of genetic heterogeneity in cancer evolution. Nature 2013, 501, 338–345. 10.1038/nature12625. [DOI] [PubMed] [Google Scholar]
- Holohan C.; Van Schaeybroeck S.; Longley D. B.; Johnston P. G. Cancer drug resistance: an evolving paradigm. Nat. Rev. Cancer 2013, 13, 714–726. 10.1038/nrc3599. [DOI] [PubMed] [Google Scholar]
- Alizadeh A. A.; Aranda V.; Bardelli A.; Blanpain C.; Bock C.; Borowski C.; Caldas C.; Califano A.; Doherty M.; Elsner M. Toward understanding and exploiting tumor heterogeneity. Nat. Med. 2015, 21, 846–853. 10.1038/nm.3915. [DOI] [PMC free article] [PubMed] [Google Scholar]
- Bonadonna G.; Brusamolino E.; Valagussa P.; Rossi A.; Brugnatelli L.; Brambilla C.; De Lena M.; Tancini G.; Bajetta E.; Musumeci R.; Veronesi U. Combination chemotherapy as an adjuvant treatment in operable breast cancer. N. Engl. J. Med. 1976, 294, 405–410. 10.1056/nejm197602192940801. [DOI] [PubMed] [Google Scholar]
- Pegram M. D.; Konecny G. E.; O’callaghan C.; Beryt M.; Pietras R.; Slamon D. J. Rational combinations of trastuzumab with chemotherapeutic drugs used in the treatment of breast cancer. J. Natl. Cancer Inst. 2004, 96, 739–749. 10.1093/jnci/djh131. [DOI] [PubMed] [Google Scholar]
- Moulder S. L.; Yakes F. M.; Muthuswamy S. K.; Bianco R.; Simpson J. F.; Arteaga C. L. Epidermal growth factor receptor (HER1) tyrosine kinase inhibitor ZD1839 (Iressa) inhibits HER2/neu (erbB2)-overexpressing breast cancer cells in vitro and in vivo. Cancer Res. 2001, 61, 8887–8895. [PubMed] [Google Scholar]
- Geyer C. E.; Forster J.; Lindquist D.; Chan S.; Romieu C. G.; Pienkowski T.; Jagiello-Gruszfeld A.; Crown J.; Chan A.; Kaufman B. Lapatinib plus capecitabine for HER2-positive advanced breast cancer. N. Engl. J. Med. 2006, 355, 2733–2743. 10.1056/nejmoa064320. [DOI] [PubMed] [Google Scholar]
- Shi J.; Kantoff P. W.; Wooster R.; Farokhzad O. C. Cancer nanomedicine: progress, challenges and opportunities. Nat. Rev. Cancer 2017, 17, 20–37. 10.1038/nrc.2016.108. [DOI] [PMC free article] [PubMed] [Google Scholar]
- Tibbitt M. W.; Dahlman J. E.; Langer R. Emerging frontiers in drug delivery. J. Am. Chem. Soc. 2016, 138, 704–717. 10.1021/jacs.5b09974. [DOI] [PubMed] [Google Scholar]
- Kim B. Y. S.; Rutka J. T.; Chan W. C. W. Nanomedicine. N. Engl. J. Med. 2010, 363, 2434–2443. 10.1056/nejmra0912273. [DOI] [PubMed] [Google Scholar]
- Peer D.; Karp J. M.; Hong S.; Farokhzad O. C.; Margalit R.; Langer R. Nanocarriers as an emerging platform for cancer therapy. Nat. Nanotechnol. 2007, 2, 751–760. 10.1038/nnano.2007.387. [DOI] [PubMed] [Google Scholar]
- Liao L.; Liu J.; Dreaden E. C.; Morton S. W.; Shopsowitz K. E.; Hammond P. T.; Johnson J. A. A convergent synthetic platform for single-nanoparticle combination cancer therapy: ratiometric loading and controrelease of cisplatin, doxorubicin, and camptothecin. J. Am. Chem. Soc. 2014, 136, 5896–5899. 10.1021/ja502011g. [DOI] [PMC free article] [PubMed] [Google Scholar]
- Sengupta S.; Eavarone D.; Capila I.; Zhao G.; Watson N.; Kiziltepe T.; Sasisekharan R. Temporal targeting of tumour cells and neovasculature with a nanoscale delivery system. Nature 2005, 436, 568–572. 10.1038/nature03794. [DOI] [PubMed] [Google Scholar]
- Zhang L.; Xia J.; Zhao Q.; Liu L.; Zhang Z. Functional graphene oxide as a nanocarrier for controlled loading and targeted delivery of mixed anticancer drugs. Small 2010, 6, 537–544. 10.1002/smll.200901680. [DOI] [PubMed] [Google Scholar]
- Deng Z. J.; Morton S. W.; Ben-Akiva E.; Dreaden E. C.; Shopsowitz K. E.; Hammond P. T. Layer-by-layer nanoparticles for systemic codelivery of an anticancer drug and siRNA for potential triple-negative breast cancer treatment. ACS Nano 2013, 7, 9571–9584. 10.1021/nn4047925. [DOI] [PMC free article] [PubMed] [Google Scholar]
- Jiang T.; Mo R.; Bellotti A.; Zhou J.; Gu Z. Gel–liposome-mediated co-delivery of anticancer membrane-associated proteins and small-molecule drugs for enhanced therapeutic efficacy. Adv. Funct. Mater. 2014, 24, 2295–2304. 10.1002/adfm.201303222. [DOI] [Google Scholar]
- Wang Y.; Gao S.; Ye W.-H.; Yoon H. S.; Yang Y.-Y. Co-delivery of drugs and DNA from cationic core-shell nanoparticles self-assembled from a biodegradable copolymer. Nat. Mater. 2006, 5, 791–796. 10.1038/nmat1737. [DOI] [PubMed] [Google Scholar]
- Huang P.; Ao J.; Zhou L.; Su Y.; Huang W.; Zhu X.; Yan D. Facile approach to construct ternary cocktail nanoparticles for cancer combination therapy. Bioconjugate Chem. 2016, 27, 1564–1568. 10.1021/acs.bioconjchem.6b00158. [DOI] [PubMed] [Google Scholar]
- Matsumura Y.; Maeda H. A new concept for macromolecular therapeutics in cancer chemotherapy: mechanism of tumoritropic accumulation of proteins and the antitumor agent Smancs. Cancer Res. 1986, 46, 6387–6392. [PubMed] [Google Scholar]
- Ruoslahti E.; Bhatia S. N.; Sailor M. J. Targeting of drugs and nanoparticles to tumors. J. Cell Biol. 2010, 188, 759–768. 10.1083/jcb.200910104. [DOI] [PMC free article] [PubMed] [Google Scholar]
- Ediriwickrema A.; Saltzman W. M. Nanotherapy for cancer: targeting and multifunctionality in the future of cancer therapies. ACS Biomater. Sci. Eng. 2015, 1, 64–78. 10.1021/ab500084g. [DOI] [PMC free article] [PubMed] [Google Scholar]
- Kolishetti N.; Dhar S.; Valencia P. M.; Lin L. Q.; Karnik R.; Lippard S. J.; Langer R.; Farokhzad O. C. Engineering of self-assembled nanoparticle platform for precisely controlled combination drug therapy. Proc. Natl. Acad. Sci. U.S.A. 2010, 107, 17939–17944. 10.1073/pnas.1011368107. [DOI] [PMC free article] [PubMed] [Google Scholar]
- Hu S.-H.; Chen S.-Y.; Gao X. Multifunctional nanocapsules for simultaneous encapsulation of hydrophilic and hydrophobic compounds and on-demand release. ACS Nano 2012, 6, 2558–2565. 10.1021/nn205023w. [DOI] [PMC free article] [PubMed] [Google Scholar]
- Barua S.; Mitragotri S. Synergistic targeting of cell membrane, cytoplasm, and nucleus of cancer cells using rod-shaped nanoparticles. ACS Nano 2013, 7, 9558–9570. 10.1021/nn403913k. [DOI] [PMC free article] [PubMed] [Google Scholar]
- Fang Y.; Zheng G.; Yang J.; Tang H.; Zhang Y.; Kong B.; Lv Y.; Xu C.; Asiri A. M.; Zi J.; Zhang F.; Zhao D. Dual-pore mesoporous carbon@silica composite core–shell nanospheres for multidrug delivery. Angew. Chem., Int. Ed. 2014, 126, 5470–5474. 10.1002/ange.201402002. [DOI] [PubMed] [Google Scholar]
- Paraskar A. S.; Soni S.; Chin K. T.; Chaudhuri P.; Muto K. W.; Berkowitz J.; Handlogten M. W.; Alves N. J.; Bilgicer B.; Dinulescu D. M. Harnessing structure-activity relationship to engineer a cisplatin nanoparticle for enhanced antitumor efficacy. Proc. Natl. Acad. Sci. U.S.A. 2010, 107, 12435–12440. 10.1073/pnas.1007026107. [DOI] [PMC free article] [PubMed] [Google Scholar]
- Paraskar A.; Soni S.; Basu S.; Amarasiriwardena C. J.; Lupoli N.; Srivats S.; Roy R. S.; Sengupta S. Rationally engineered polymeric cisplatin nanoparticles for improved antitumor efficacy. Nanotechnology 2011, 22, 265101. 10.1088/0957-4484/22/26/265101. [DOI] [PMC free article] [PubMed] [Google Scholar]
- Hess B.; Kutzner C.; van der Spoel D.; Lindahl E. GROMACS 4: Algorithms for highly efficient, load-balanced, and scalable molecular simulation. J. Chem. Theory Comput. 2008, 4, 435–447. 10.1021/ct700301q. [DOI] [PubMed] [Google Scholar]
- Gilleron J.; Querbes W.; Zeigerer A.; Borodovsky A.; Marsico G.; Schubert U.; Manygoats K.; Seifert S.; Andree C.; Stöter M. Image-based analysis of lipid nanoparticle-mediated siRNA delivery, intracellular trafficking and endosomal escape. Nat. Biotechnol. 2013, 31, 638–646. 10.1038/nbt.2612. [DOI] [PubMed] [Google Scholar]
- Palvai S.; More P.; Mapara N.; Basu S. Chimeric nanoparticle: a platform for simultaneous targeting of phosphatidylinositol-3-kinase signaling and damaging DNA in cancer cells. ACS Appl. Mater. Interfaces 2015, 7, 18327–18335. 10.1021/acsami.5b04015. [DOI] [PubMed] [Google Scholar]
- Theodoropoulos P. A.; Polioudaki H.; Kostaki O.; Derdas S. P.; Georgoulias V.; Dargemont C.; Georgatos S. D. Taxol affects nuclear lamina and pore complex organization and inhibits import of karyophilic proteins into the cell nucleus. Cancer Res. 1999, 59, 4625–4633. [PubMed] [Google Scholar]
- Schiff P. B.; Horwitz S. B. Taxol stabilizes microtubules in mouse fibroblast cells. Proc. Natl. Acad. Sci. U.S.A. 1980, 77, 1561–1565. 10.1073/pnas.77.3.1561. [DOI] [PMC free article] [PubMed] [Google Scholar]
- Wang D.; Lippard S. J. Cellular processing of platinum anticancer drugs. Nat. Rev. Drug Discovery 2005, 4, 307–320. 10.1038/nrd1691. [DOI] [PubMed] [Google Scholar]
- Jamieson E. R.; Lippard S. J. Structure, recognition, and processing of cisplatin–DNA adducts. Chem. Rev. 1999, 99, 2467–2498. 10.1021/cr980421n. [DOI] [PubMed] [Google Scholar]
- Jordan M. A.; Toso R. J.; Thrower D.; Wilson L. Mechanism of mitotic block and inhibition of cell proliferation by taxol at low concentrations. Proc. Natl. Acad. Sci. U.S.A. 1993, 90, 9552–9556. 10.1073/pnas.90.20.9552. [DOI] [PMC free article] [PubMed] [Google Scholar]
- Jordan M. A.; Wendell K.; Gardiner S.; Derry W. B.; Copp H.; Wilson L. Mitotic block induced in HeLa cells by low concentrations of paclitaxel (Taxol) results in abnormal mitotic exit and apoptotic cell death. Cancer Res. 1996, 56, 816–825. [PubMed] [Google Scholar]
- Sengupta P.; Basu S.; Soni S.; Pandey A.; Roy B.; Oh M. S.; Chin K. T.; Paraskar A. S.; Sarangi S.; Connor Y. Cholesterol-tethered platinum II-based supramolecular nanoparticle increases antitumor efficacy and reduces nephrotoxicity. Proc. Natl. Acad. Sci. U.S.A. 2012, 109, 11294–11299. 10.1073/pnas.1203129109. [DOI] [PMC free article] [PubMed] [Google Scholar]
- Mallick A.; More P.; Ghosh S.; Chippalkatti R.; Chopade B. A.; Lahiri M.; Basu S. Dual drug conjugated nanoparticle for simultaneous targeting of mitochondria and nucleus in cancer cells. ACS Appl. Mater. Interfaces 2015, 7, 7584–7598. 10.1021/am5090226. [DOI] [PubMed] [Google Scholar]
- Frisch M. J.; Trucks G. W.; Schlegel H. B.; Scuseria G. E.; Robb M. A.; Cheeseman J. R.; Scalmani G.; Barone V.; Petersson G. A.; Nakatsuji H.; Li X.; Caricato M.; Marenich A.; Bloino J.; Janesko B. G.; Gomperts R.; Mennucci B.; Hratchian H. P.; Ortiz J. V.; Izmaylov A. F.; Sonnenberg J. L.; Williams-Young D.; Ding F.; Lipparini F.; Egidi F.; Goings J.; Peng B.; Petrone A.; Henderson T.; Ranasinghe D.; Zakrzewski V. G.; Gao J.; Rega N.; Zheng G., Liang W.; Hada M.; Ehara M.; Toyota K.; Fukuda R.; Hasegawa J.; Ishida M.; Nakajima T.; Honda Y.; Kitao O.; Nakai H.; Vreven T.; Throssell K.; Montgomery J. A. Jr.; Peralta J. E.; Ogliaro F.; Bearpark M.; Heyd J. J.; Brothers E.; Kudin K. N.; Staroverov V. N.; Keith T.; Kobayashi R.; Normand J.; Raghavachari K.; Rendell A.; Burant J. C.; Iyengar S. S.; Tomasi J.; Cossi M.; Millam J. M.; Klene M.; Adamo C.; Cammi R.; Ochterski J. W.; Martin R. L.; Morokuma K.; Farkas O.; Foresman J. B.; Fox D. J.. Gaussian 09, revision A.02; Gaussian, Inc.: Wallingford, CT, 2016.
- Vanommeslaeghe K.; Hatcher E.; Acharya C.; Kundu S.; Zhong S.; Shim J.; Darian E.; Guvench O.; Lopes P.; Vorobyov I.; Mackerell A. D. CHARMM general force field: a force field for drug-like molecules compatible with the CHARMM all-atom additive biological force fields. J. Comput. Chem. 2010, 31, 671–690. 10.1002/jcc.21367. [DOI] [PMC free article] [PubMed] [Google Scholar]
- Bjelkmar P.; Larsson P.; Cuendet M. A.; Hess B.; Lindahl E. Implementation of the CHARMM force field in GROMACS: analysis of protein stability effects from correction maps, virtual interaction sites, and water models. J. Chem. Theory Comput. 2010, 6, 459–466. 10.1021/ct900549r. [DOI] [PubMed] [Google Scholar]
- Kulkarni A.; Pandey P.; Rao P.; Mahmoud A.; Goldman A.; Sabbisetti V.; Parcha S.; Natarajan S. K.; Chandrasekar V.; Dinulescu D.; Roy S.; Sengupta S. Algorithm for designing nanoscale supramolecular therapeutics with increased anticancer efficacy. ACS Nano 2016, 10, 8154–8168. 10.1021/acsnano.6b00241. [DOI] [PubMed] [Google Scholar]
- Cundari T. R.; Fu W.; Moody E. W.; Slavin L. L.; Snyder L. A.; Sommerer S. O.; Klinckman T. R. Molecular mechanics force field for platinum coordination complexes. J. Phys. Chem. 1996, 100, 18057–18064. 10.1021/jp961240x. [DOI] [Google Scholar]
- Scheeff E. D.; Briggs J. M.; Howell S. B. Molecular modeling of the intrastrand guanine-guanine DNA adducts produced by cisplatin and oxaliplatin. Mol. Pharmacol. 1999, 56, 633–643. 10.1124/mol.56.3.633. [DOI] [PubMed] [Google Scholar]
- Singh U. C.; Kollman P. A. An approach to computing electrostatic charges for molecules. J. Comput. Chem. 1984, 5, 129–145. 10.1002/jcc.540050204. [DOI] [Google Scholar]
- Berendsen H. J. C.; Grigera J. R.; Straatsma T. P. The missing term in effective pair potentials. J. Phys. Chem. 1987, 91, 6269–6271. 10.1021/j100308a038. [DOI] [Google Scholar]
- Berendsen H. J. C.; Postma J. P. M.; van Gunsteren W. F.; DiNola A.; Haak J. R. Molecular dynamics with coupling to an external bath. J. Chem. Phys. 1984, 81, 3684–3690. 10.1063/1.448118. [DOI] [Google Scholar]
- Patra M.; Karttunen M.; Hyvönen M. T.; Falck E.; Lindqvist P.; Vattulainen I. Molecular dynamics simulations of lipid bilayers: major artifacts due to truncating electrostatic interactions. Biophys. J. 2003, 84, 3636–3645. 10.1016/s0006-3495(03)75094-2. [DOI] [PMC free article] [PubMed] [Google Scholar]
- Lee G. Y.; Kenny P. A.; Lee E. H.; Bissell M. J. Three-dimensional culture models of normal and malignant breast epithelial cells. Nat. Methods 2007, 4, 359–365. 10.1038/nmeth1015. [DOI] [PMC free article] [PubMed] [Google Scholar]
- Han J.; Chang H.; Giricz O.; Lee G. Y.; Baehner F. L.; Gray J. W.; Bissell M. J.; Kenny P. A.; Parvin B. Molecular predictors of 3D morphogenesis by breast cancer cell lines in 3D culture. PLoS Comput. Biol. 2010, 6, e1000684 10.1371/journal.pcbi.1000684. [DOI] [PMC free article] [PubMed] [Google Scholar]
Associated Data
This section collects any data citations, data availability statements, or supplementary materials included in this article.


