Abstract
Renal epithelial cell injury is a key step in inducing kidney stone formation. This injury induced by crystallites with different shapes and aggregation states has been receiving minimal research attention. To compare the shape and aggregation effects of calcium oxalate crystals on their toxicity, we prepared calcium oxalate monohydrate (COM) crystals with the morphology of a hexagonal lozenge, a thin hexagonal lozenge, and their corresponding aggregates. We then compared their toxicities toward human kidney proximal tubular epithelial (HK-2) cells. All four shapes of COM crystals caused cell-membrane rupture, upregulated intracellular reactive oxygen, and decreased mitochondrial membrane potential. This series of phenomena ultimately led to necrotic cell death. The overall damage in cells was determined in terms of both exterior and interior damage. Crystals with a large Ca2+ ion-rich (1̅01) active face showed the greatest toxicity in HK-2 cells and the largest extent of adhesion onto the cell surface. Crystals with sharp edges easily caused cell-membrane ruptures. The aggregation of sharp crystals aggravated cell injury, whereas the aggregation of blunt crystals weakened cell injury. Therefore, crystal shapes and aggregation states were important factors that affected crystal toxicity in renal epithelial cells. All of these findings elucidated the relationship between the physical properties of crystals and cytotoxicity and provided theoretical references for inhibiting stone formation.
1. Introduction
Kidney stones are a common and extremely painful disorder of the urinary tract.1 The mechanism by which kidney stones are formed has not yet been completely clarified. Approximately 80% of all kidney stones are calcium oxalate (CaOx) stones; calcium oxalate monohydrate (COM) is the main constituent of CaOx stones formed in the urinary system of patients with urolithiasis; its incidence is approximately twice that of calcium oxalate dihydrate stones.2,3
Urinary crystals in normal patients and those with kidney stones often differ in shape, size, and crystal phase due to the differences in the supersaturation of lithogenic salts, pH value, and content of inhibitors and promoters among individuals.4,5 In our previous study,4 we observed that most crystallites in healthy urine samples are spheroidal and well dispersed but that the major particles in lithogenic urine exhibit sharply angled edges and tips. Robertson et al.5 also found that calcium oxalate crystalluria in recurrent stone formers mainly comprises large polycrystalline aggregates with sharp edges. In controls, calcium oxalate is in the form of small blunt particles with few aggregations.
The particle shape, an important physical parameter, plays a vital role in crystal–cell interaction. Wang et al.6 synthesized gold nanospheres, nanorods (NRs), and nanopolyhedrons using a seed-mediated growth method and compared their toxicity in a zebrafish model; the authors found that gold nanospheres exhibit more toxicity in comparison with NRs and nanopolyhedrons. A study on zebrafish embryos showed that 30, 60, and 100 nm spherical nickel nanoparticles are less toxic than 60 nm dendritic clusters. These results suggest that the configuration of nanoparticles may affect their toxicity more than size, and defects due to nanoparticle exposure occur through different biological mechanisms.7 The shape of a particle can also affect its uptake pathway. Qiu et al.8 found that the cellular uptake of Au NRs is highly shape dependent, that is, fewer long NRs are internalized in comparison with short NRs with similar surface charges. The interaction between exogenous materials and biological systems has gained increasing attention, but the effect of the shape of urinary crystallites on kidney stone formation has rarely been studied.
Stone morphology has recently become an important parameter in understanding specific lithogenic processes, orienting physicians with regard to peculiar etiological factors and reflecting the lithogenic activities of diseases.9,10 In most cases, stone nucleation results from the retention of large crystals or aggregates or from the agglomeration of large amounts of tiny crystals within the lumen of a tubule.10 In general, large crystallites (measuring typically some tens of micrometers) are made of a collection of some hundreds of small crystallites; the morphology of bulk crystallites is often a macroscopic display of small crystallites. Therefore, in the present work, we prepared COM crystals with the morphology of a hexagonal lozenge, a thin hexagonal lozenge, and their corresponding aggregates. We then compared their toxicities toward human kidney proximal tubular epithelial (HK-2) cells to reveal the effect of the shape of crystals on kidney stone formation at the molecular and cellular levels.
2. Results
2.1. Preparation and Characterization of COM Crystals with Varying Shapes
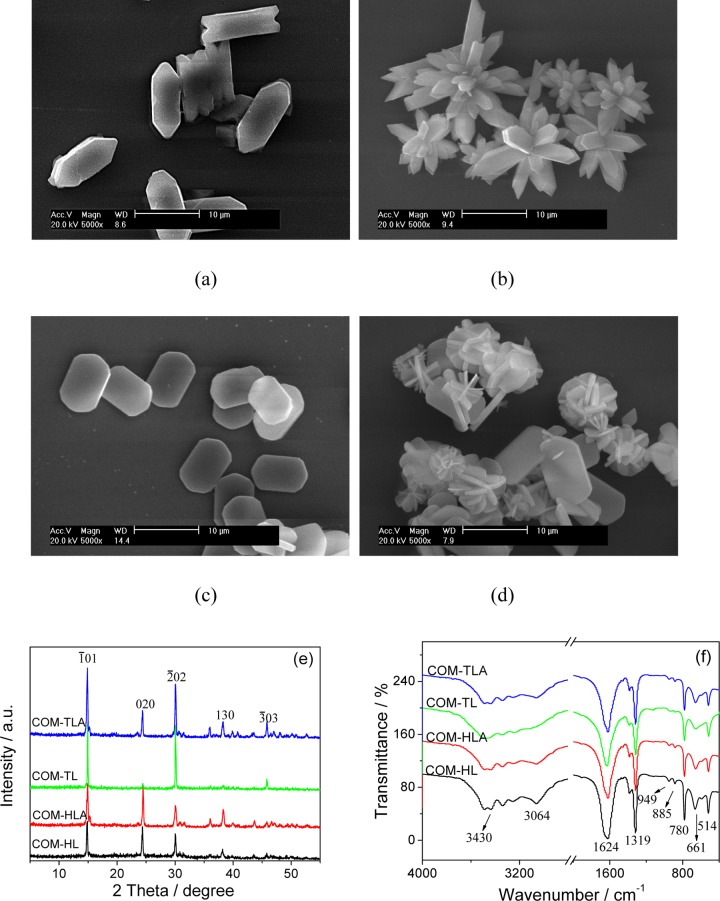
COM crystals with four different shapes were prepared by altering the reactant concentration, reaction temperature, stirring speed, and additive. Figure 1a–d shows the scanning electron microscopy (SEM) images of the 10 μm COM crystals with four different shapes: hexagonal lozenge (COM-HL), hexagonal lozenge aggregate (COM-HLA), thin hexagonal lozenge (COM-TL), and thin hexagonal lozenge aggregate (COM-TLA). The prepared COM crystals were homogeneous in shape within the sample group. COM-HL exhibited a hexagonal lozenge morphology under the condition of zero additives (Figure 1a). COM-TL showed a thin hexagonal lozenge structure (Figure 1c) as a result of the addition of Na3cit, which is a common drug for the prevention and cure of urinary stones. NaCl additives can promote crystal aggregation. COM-HLA and COM-TLA were obtained by adding NaCl during the crystal preparation process.
Figure 1.
SEM images (a–d), XRD spectra (e) and Fourier transform infrared (FT-IR) spectra (f) of COM crystals of varying shapes. (a) COM-HL; (b) COM-HLA; (c) COM-TL; (d) COM-TLA; (e) XRD spectra; (f) FT-IR spectra. Scale bars: 10 μm.
The crystal phases were detected by XRD characterization, all of the COM crystals were detected the diffraction peaks at d = 0.593, 0.365, 0.296, 0.235, and 0.197 nm, which were assigned to (1̅01), (020), (2̅02), (130), and (3̅03) planes of COM crystals (PDF card number: 20-0231), respectively (Figure 1e). All of the XRD patterns showed no other impurity peak, indicating that the prepared samples were pure phase COM crystals.
However, partial diffraction peaks of COM-TL are very weak. In the XRD pattern, the smaller the crystal face exposed, the intensity of the crystal face is also weaker.11 Because COM-TL exposed the smallest (010) plane and the largest (1̅01) plane (Figure 1c) among the four crystals and (010) crystal face of COM crystals corresponds to the spacing d200 of COM in XRD pattern, the intensity of the spacing d(020) of COM-TL was the weakest among the four COM crystals. That is, the XRD result is consistent with the SEM observation. The intensity ratio of the main (1̅01) and (020) planes (I1̅01/I020) of COM with varying shapes was calculated and ranked in the following order: COM-TL > COM-TLA > COM-HL > COM-HLA (Table 1).
Table 1. Characterization of the Physical and Chemical Properties of COM Crystals with Various Shapes.
| crystal shape | size (μm) | additives | I1̅01/I010 | specific surface area SBET (m2/g) | ζ potential (V) | conductivity (μS/cm) |
|---|---|---|---|---|---|---|
| COM-HL | 10.1 ± 0.2 | 1.33 | 0.83 | –9.93 ± 1.34 | 23.7 ± 1.2 | |
| COM-HLA | 10.3 ± 0.3 | NaCl | 1.09 | 1.22 | –5.91 ± 0.47 | 27.4 ± 3.92 |
| COM-TL | 9.8 ± 0.2 | Na3cit | 3.83 | 1.15 | –6.35 ± 0.92 | 35.9 ± 7.35 |
| COM-TLA | 9.6 ± 0.3 | Na3cit + NaCl | 2.52 | 2.54 | –6.24 ± 0.92 | 25.3 ± 3.57 |
The four COM crystals in various morphologies were also verified by FT-IR spectra (Figure 1f). All COM crystals had a broad band at 3491–3058 cm–1, and this band split into five absorption peaks, which belonged to the symmetric and asymmetric stretching vibration peaks of the O–H bond of crystal water of COM. The asymmetric stretching (νas) and symmetric stretching (νs) vibration of the carboxyl group (−COO) in COM were at about 1620 and 1321 cm–1, respectively.12 In the fingerprint region, the absorption peaks of COM occurred at about 947 (C–O stretching vibration), 885, 785 (C–C stretching vibration), 663, and 514 cm–1 (O–C–O plane bending vibration). The results of FT-IR and XRD analysis revealed that all prepared COM were pure targeted products.
Table 1 shows the detected specific surface areas (SBET), conductivities, and ζ potentials. The SBET and ζ potential of COM-TL and COM-HL were less than those of COM-TLA and COM-HLA. The conductivities of the four COM crystals did not show regular changes.
2.2. Changes of Cell Viability Caused by COM Crystals with Various Shapes
To compare the cytotoxicity of the four COM crystals in renal epithelial cells, we used the CCK-8 assay in the detection of cell viability (Figure 2). The adopted concentration of COM crystals ranged from 200 to 800 μg/mL, which was consistent with most previous studies.3 All four COM crystals induced cell damage and caused a decrease in cell viability in a dose-dependent manner. COM-HLA exhibited significantly higher toxicity in HK-2 cells compared to that in COM-HL single crystals, especially under high concentrations (400 and 800 μg/mL, p < 0.01). This characteristic may explain why sharp crystals easily cause acute injury. The COM-TL crystal with a large (1̅01) active face presented an obviously greater toxicity than COM-TLA (p < 0.01).
Figure 2.
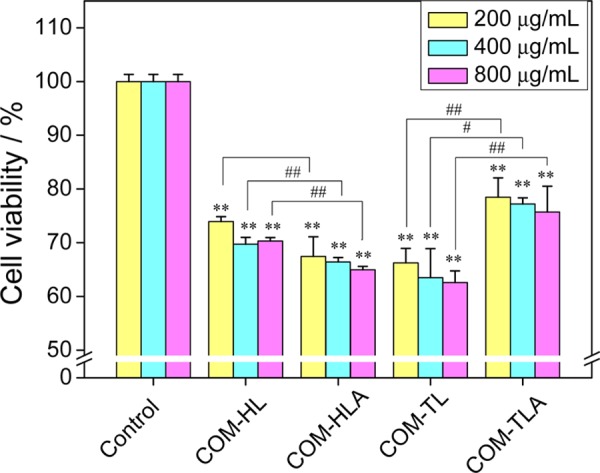
Cell viability detection by the CCK-8 assay of HK-2 cells after exposure to different concentrations of COM with various shapes for 6 h. Compared with the control group, *p < 0.05, **p < 0.01. COM-HL treatment group vs corresponding concentration of COM-HLA treatment group, COM-TL treatment group vs corresponding concentration of COM-TLA treatment group, #p < 0.05, ##p < 0.01.
2.3. Changes of Cell Morphology Caused by COM Crystals with Various Shapes
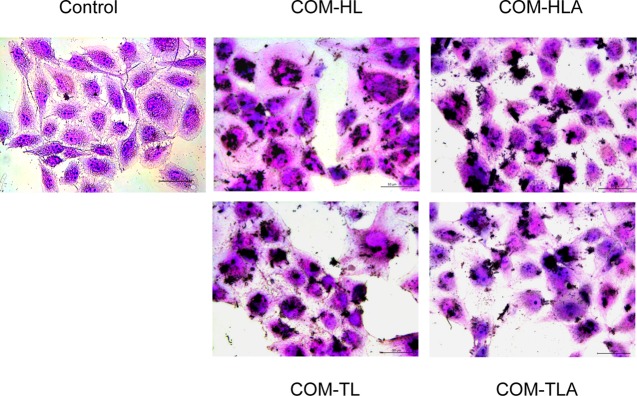
Changes in cell morphology can directly reflect the degree of cell damage. Thus, we observed the overall morphology of normal cells and the cells with COM crystals through the hematoxylin–eosin (HE) staining assay (Figure 3). The cells in the control group presented a plump spindle shape, and the cytoplasm was stained uniformly. The morphologies of the cells treated with the COM crystals of different shapes became disordered and presented chromatin condensation as well as eosinophilic staining enhancement. The COM-TL crystals caused the most serious damage to HK-2 cells, morphological disorder, and cell swelling. Most of the adhered crystals appeared to be flat on the surface of the cell islands. Schepers et al.13 also reported that crystals mainly lay on the surface of cell islands formed by proximal tubule cells, whereas crystals are predominantly found at the periphery of cell groups formed by collecting duct cells.
Figure 3.
Morphology observation by HE staining of HK-2 cells after exposure to 400 μg/mL COM crystals with various shapes for 6 h. Scale bars: 50 μm.
2.4. LDH Release Caused by COM Crystals with Various Shapes
Plasma membrane damage is an important aspect of cellular toxicity upon particle treatment. When cells have plasma membrane damage, lactic dehydrogenase (LDH) is released to the outside of the cells. The four types of crystals caused the release of intracellular LDH in varying degrees, with the released amount increasing with the increase of crystal concentration (Figure 4). COM-HLA and COM-TLA caused higher damage in cell membranes than COM-HL and COM-TL single crystals, especially under higher crystal concentrations (400 and 800 μg/mL, p < 0.01). This characteristic may explain why these aggregates exposed sharp edges and corners. The change rule of membrane damage was not completely consistent with the change rule of cell viability (Figure 1).
Figure 4.
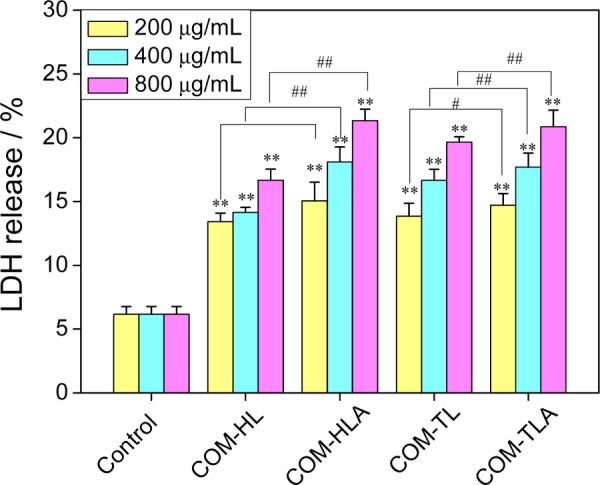
Changes in LDH release amount of HK-2 cells caused by different concentrations of COM crystals with various shapes for 6 h. Compared with control group, *p < 0.05, **p < 0.01. COM-HL treatment group vs corresponding concentration of COM-HLA treatment group, COM-TL treatment group vs corresponding concentration of COM-TLA treatment group, #p < 0.05, ##p < 0.01.
2.5. Cell-Membrane Integrity Analysis via Propidium Iodide (PI) Staining
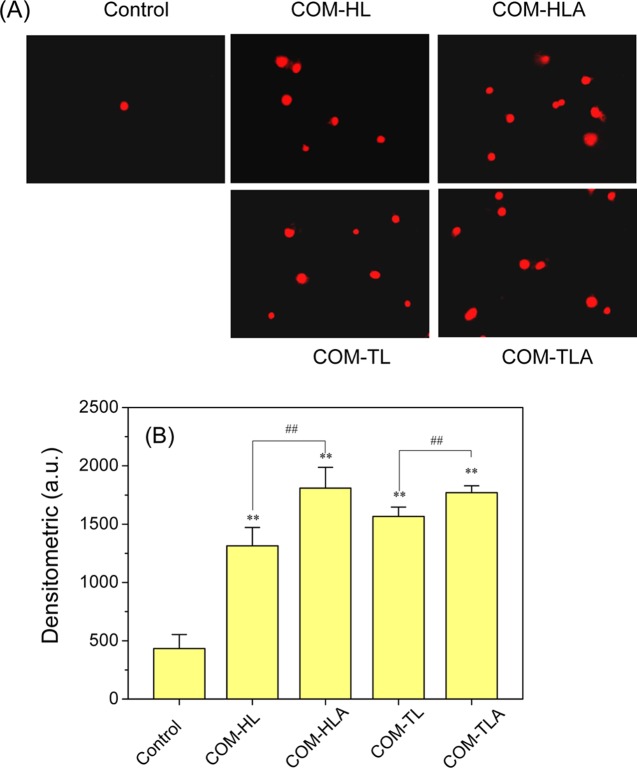
Propidium iodide (PI) cannot penetrate normal cell membranes but can pass through damaged cell membranes and bind to DNA in the nucleus, thereby emitting red fluorescence. PI is often used to detect cell-membrane damage. Figure 5 shows the fluorescence images and fluorescence intensity of HK-2 cells stained with PI after incubation with COM-HL, COM-HLA, COM-TL, and COM-TLA crystals for 6 h. In the control group, few PI-positive cells were observed and the cell nucleus exhibited a uniform morphology. The number of PI-positive cells increased in the groups treated with the COM crystals of various shapes. Furthermore, the stained nuclei were uneven in shape and showed a tailing phenomenon, which may explain why the COM crystals caused necrotic cell death that led to random DNA rupture. The number of PI-positive cells in the COM-HLA- and COM-TLA-treated groups was higher than that in the COM-HL and COM-TL treated groups. Both PI staining and the LDH release assay can detect the extent of cell-membrane damage, but the CCC-K assay is used to detect total cell viability. Thus, we speculated that cell injury is not caused by the single factor of cell-membrane damage alone.
Figure 5.
Fluorescence images of HK-2 cells stained by PI (A) and quantitative analysis results of red fluorescence intensity (B) after exposure to 400 μg/mL COM crystals in various shapes for 6 h. Scale bar: 50 μm. Compared with control group, *p < 0.05, **p < 0.01. COM-HL treatment group vs COM-HLA treatment group, COM-TL treatment group vs COM-TLA treatment group, #p < 0.05, ##p < 0.01.
2.6. ROS Generation Induced by COM Crystals with Various Shapes
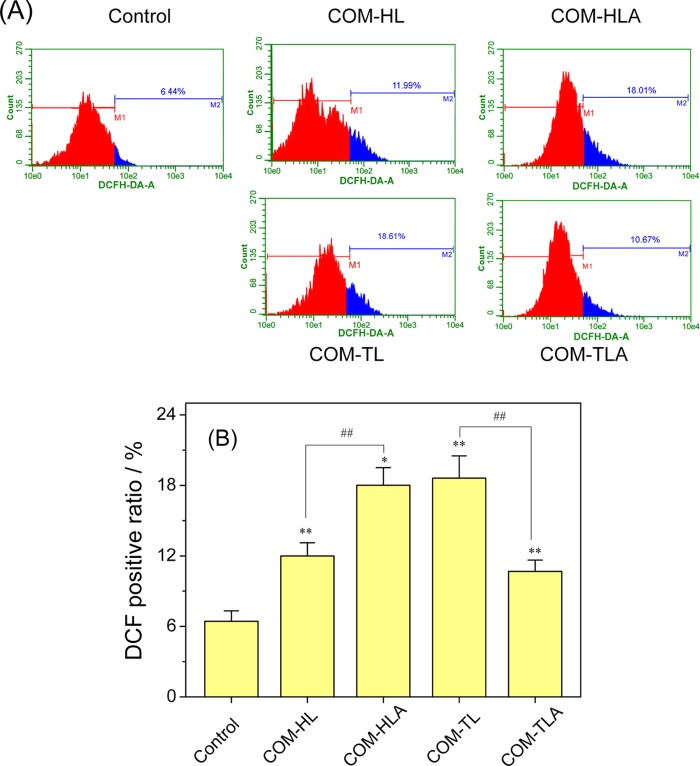
The amount of intracellular reactive oxygen species (ROS) is the most commonly used index for assessing the toxicity of particles. The generated ROS in the COM crystal-treated cells was labeled as DCFH-DA and analyzed via flow cytometry (Figure 6). Compared with the ROS level in the control group, the ROS levels in the four treated groups increased by different degrees. The COM-HL single crystal caused an 11.99% ROS increase in the HK-2 cells; this value was lower than that of the COM-HLA (18.01%, p < 0.01). The ROS level in the COM-TL single crystal-treated group (18.61%) was obviously higher than that in the COM-TLA-treated group (10.67%, p < 0.01).
Figure 6.
Intracellular ROS level of HK-2 cells after exposure to 400 μg/mL COM crystals with various shapes for 6 h. (A) Histogram of intracellular ROS; (B) quantitative results of intracellular ROS. Compared with the control group, *p < 0.05, **p < 0.01. COM-HL treatment group vs COM-HLA treatment group, COM-TL treatment group vs COM-TLA treatment group, #p < 0.05, ##p < 0.01.
2.7. Decrease in Δψm Caused by COM Crystals with Various Shapes
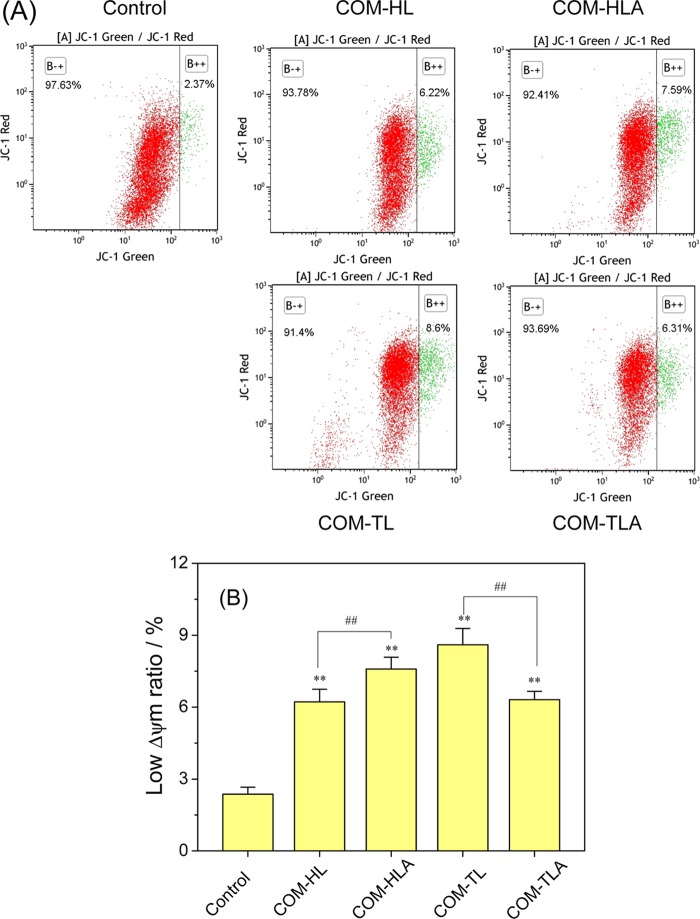
Apoptosis and necrosis are often preceded by mitochondrial dysfunction, in particular, a loss of mitochondrial membrane potential (Δψm). Mitochondria have high Δψm potential under normal circumstances and would become depolarized after suffering injury. Therefore, we analyzed the changes in Δψm in cells treated with varying shapes of COM crystals by JC-1 fluorescent staining and flow cytometry (Figure 7).
Figure 7.
Effect of varying shapes of COM crystals on mitochondrial membrane potential (Δψm) in HK-2 cells. (A) The dot plot of Δψm after incubation with varying shapes of COM crystals for 6 h; (B) quantitative histogram of Δψm. Crystal concentration: 400 μg/mL. Compared with control group, *p < 0.05, **p < 0.01. COM-HL treatment group vs COM-HLA treatment group, COM-TL treatment group vs COM-TLA treatment group, #p < 0.05, ##p < 0.01.
The ratio of cells with low ΔΨm (green fluorescent) in the control group was only 2.37%. The low ΔΨm ratio increased in the range of 6.22–8.60% after the treatment of COM crystals with various shapes. This result indicated that COM crystal exposure caused mitochondrial depolarization in different degrees. The COM-HL single crystal caused a decrease in ΔΨm of 6.22%, which is significantly lower than the decrease caused by COM-HLA (7.59%, p < 0.01). The low ΔΨm ratio in the COM-TL single crystal-treated group was significantly higher than that in the COM-TLA-treated group (p < 0.01). Excessive ROS generation caused by crystal exposure may explain the decrease in intracellular ΔΨm.
2.8. Observation of Cell Apoptosis and Necrosis Induced by COM Crystals with Various Shapes
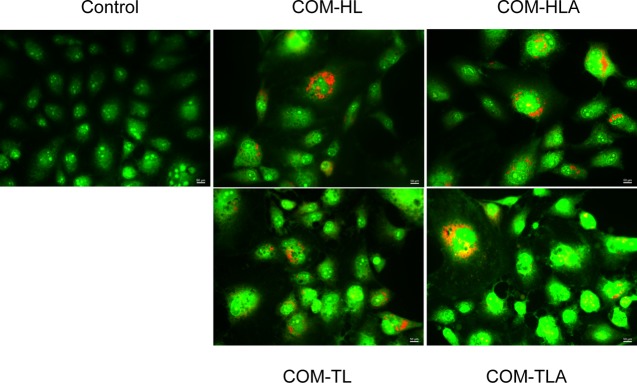
The characteristic morphological changes in the cells as a result of the treatment with COM crystals with different morphologies were evaluated by adopting acridine orange (AO)/propidium iodide (PI)-stained cells in the fluorescent microscopic analysis (Figure 8). The control-viable cells showed uniformly green fluorescing nuclei and a highly organized structure. After treating the cells with the COM crystals with four different shapes, we observed cytological changes, such as necrosis in cells with red fluorescing nuclei and cellular and nuclear swelling. The COM-HLA-treated cells were more seriously injured than the cells treated with COM-HL; the COM-HLA crystals caused significant cell necrosis. For the COM-TL- and COM-TLA-treated groups, the number of necrotic cells in the aggregate-treated group was obviously lower than that in the single crystal-treated group, and the COM-TL-treated group presented some apoptotic cells with condensed or fragmented chromatin.
Figure 8.
Fluorescence microscopy images following PI (dead cells, red)/AO (live cells, green) staining of HK-2 cells exposed to 400 μg/mL COM crystals with various shapes for 12 h.
2.9. Quantitative Analysis of Cell Apoptosis and Necrosis Induced by COM Crystals with Various Shapes
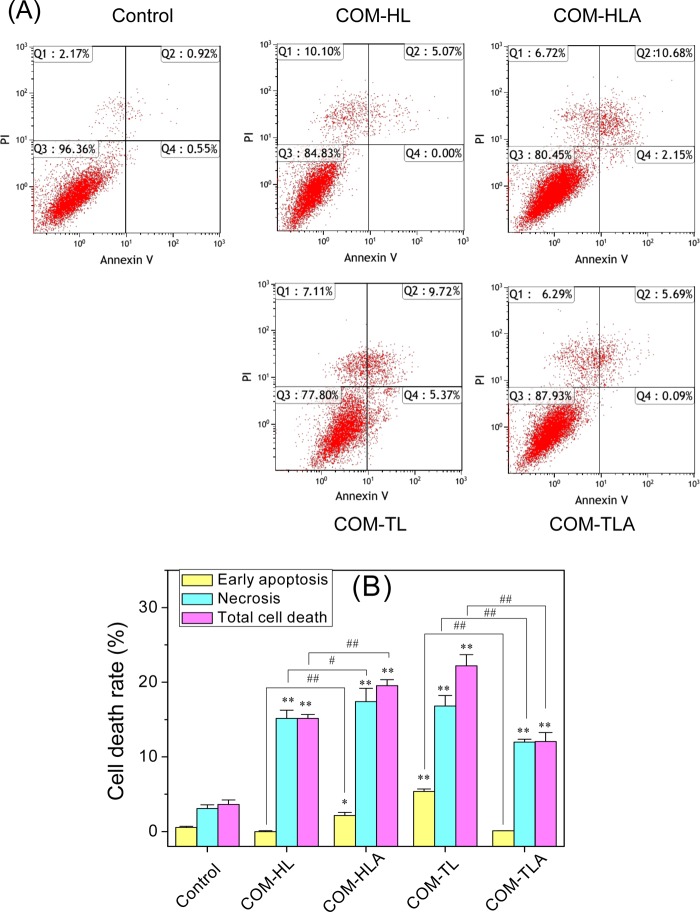
To assess the nature of various shapes of COM crystal-induced cell death, we performed flow cytometric analysis to quantify the apoptotic and necrotic cells using Annexin V/PI double staining (Figure 9). Annexin V staining was applied to reveal the surface exposure of phosphatidylserine (apoptosis), whereas PI was applied to reveal the loss of plasma membrane integrity (necrosis).
Figure 9.
Cell death of HK-2 cells after exposure to varying shapes of COM crystals for 12 h. (A) The representative dot plot of apoptosis and necrosis. Quadrants Q1, Q2, Q3, and Q4 denote the ratio of necrotic cells, late apoptotic cells, normal cells, and early-stage apoptotic cells, respectively. (B) Quantitative results of apoptosis and necrosis. Crystal concentration: 400 μg/mL. Compared with control group, *p < 0.05, **p < 0.01. COM-HL treatment group vs COM-HLA treatment group, COM-TL treatment group vs COM-TLA treatment group, #p < 0.05, ##p < 0.01.
The exposure time was extended to 12 h to clearly distinguish the changes in cell apoptosis and the necrosis rate. Quadrants Q1, Q2, Q3, and Q4 denote the ratios of necrotic cells, late apoptotic cells, normal cells, and early apoptotic cells, respectively. The COM crystals with four different shapes mainly caused necrotic cell death, with COM-TL inducing some apoptotic cell death in the HK-2 cells. COM-HLA with sharp corners caused 19.55% cell death, which was obviously higher than that observed in the COM-HL single crystal-treated group (15.17%, p < 0.01). COM-TL single crystal exhibited higher toxicity in the HK-2 cells in comparison with COM-TLA; the two COM crystals caused 22.2 and 12.07% cell death, respectively.
2.10. Quantitative Determination of Crystal Adhesion on the Cell Surface
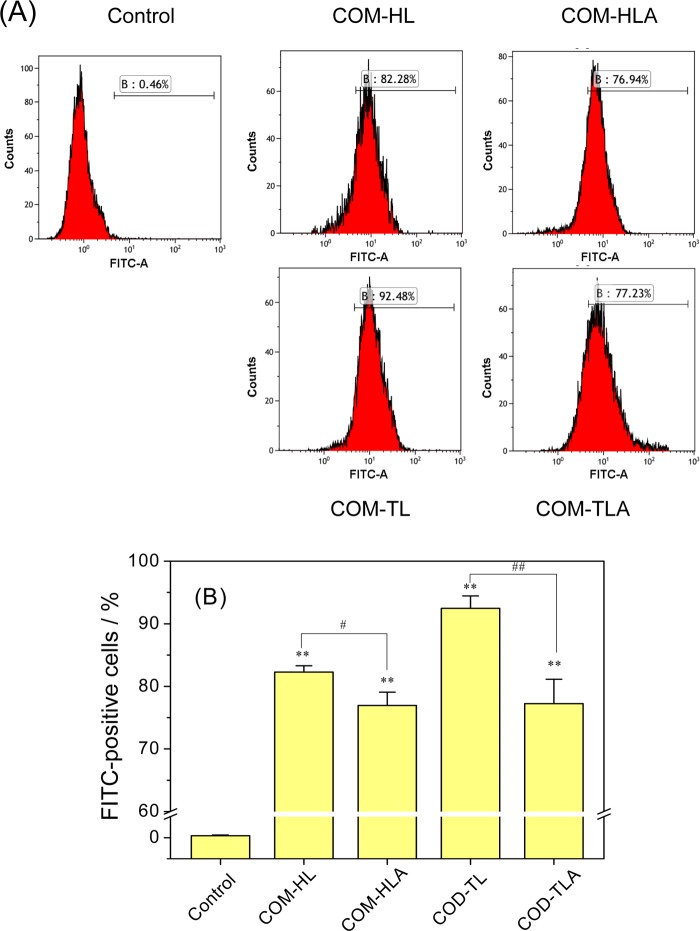
Crystal adhesion on the cell surface is an important stage in the process of stone formation. COM crystals were fluorescently labeled with FITC-IgG, and the FITC-positive cells were counted with a flow cytometer (Figure 10). A crystal adhesion experiment was carried out at 4 °C, under which the cellular active transport process was inhibited and only the adhesion process proceeded.
Figure 10.
Quantification of the adhesion amount of COM crystals with various shapes on the cell surface by flow cytometer. (A) Histogram of the percentage of FITC-positive cells. (B) Quantitative results of adherent crystals. [A] FITC-A means fluorescent intensity; B means percentages of cells with adherent fluorescent COM crystals. Crystal concentration: 400 μg/mL, treatment time: 1 h. Compared with control group, *p < 0.05, **p < 0.01. COM-HL treatment group vs COM-HLA treatment group, COM-TL treatment group vs COM-TLA treatment group, #p < 0.05, ##p < 0.01.
The adhesion amount of the COM crystals on the HK-2 cell surface decreased in the order of COM-TL > COM-HL > COM-TLA > COM-HLA. For the single crystals of COM-TL and COM-HL, the adhesion amount on the cell surface was positively related to their specific surface area; that is, the crystal with the highest specific surface area showed the greatest adhesion amount on the cell surface. For COM-TLA and COM-HLA, the specific surface area did not reflect the real contact area between the crystal and the cell because the aggregates were not in close contact with the cell surface. The single crystals showed an obviously larger contact area than their corresponding aggregates from the morphology observation, and the adhesion amount of single crystals was significantly higher than that of the aggregates. Sheng et al.14 also confirmed that the aggregation of crystals can hide their main crystal face, thereby reducing the contact area and adhesion force between the crystal and the cell.
3. Discussion
Previous studies on the effect of the crystal shape mainly focused on the influence of spheroidal or rodlike particles;15−17 however, the formed crystals in vivo are often nonspherical and show regular angles or an aggregate form.4,5 All of the crystal faces in a spheroidal particle are isotropic, whereas the faces in a nonspherical particle show different atomic arrangements, atomic densities, and charge densities. All of these factors cause differences in cell–particle interactions.
In this study, four different shapes of COM crystals were synthesized by altering the reactant concentration, reaction temperature, stirring speed, and additive. COM-HL was prepared under the condition of zero additive, and COM-HLA aggregate was obtained by adding NaCl during the crystal preparation process. Similarly, COM-TL was prepared as a result of the addition of Na3Cit, and COM-TLA aggregate was obtained by adding Na3Cit and NaCl. Lesser physical property differences were observed for the crystals obtained using the same additive than the crystals obtained using different additives. The aggregated crystals showed a larger specific surface area, a smaller intensity ratio of I1̅01/I010, and a lower absolute value of ζ potential than those of their single crystals (COM-HLA vs COM-HL, COM-TLA vs COM-TL). Thus, we mainly discuss the toxicity difference of the crystals obtained using the same additive.
The concentration of physiological CaOx crystals is closely associated with the supersaturation degree of CaOx in urine. Hallson et al.18 measured the concentration of the CaOx crystal not exceeding 4 μm diameter in 53 samples, the results showed that in 15 of the cases, the crystal concentration exceeds 10 μmol/L (1.46 μg/mL) and in 4 of them exceeds 100 μmol/L (14.6 μg/mL); the concentrations were much higher than the normal median value of 2 μmol/L (0.29 μg/mL). To speed up the construction of the damage model and make the damage difference become more obvious, the used concentration of COM crystals’ in vitro experiment was often higher than the physiological crystalluria concentration. The concentration used in our study ranged from 200 to 800 μg/mL, which was consistent with most previous studies.3,19 The adopted concentration of CaOx crystals by Hovda et al.3 and Mulay et al.19 is 147–735 and 30–1000 μg/mL, respectively.
3.1. Toxicity Differences of COM Crystals of Varying Shapes in Renal Epithelial Cells
COM-TL showed a thin hexagonal lozenge morphology, which exhibited larger (1̅01) faces than those of the other three COM crystals. The force between the (1̅01) face and the cell surface was stronger than that between the (010) face and cell surface because the Ca2+ ion density of the (1̅01) face (0.0542 Ca2+/A2) was approximately 63% higher than that of the (010) face (0.0333 Ca2+/A2).20 Sheng et al.21 also demonstrated that the adhesive force of the (1̅01) face to the carboxyl group-modified tip of atomic force microscopy is 4 times stronger than that of the (010) face. Therefore, the interaction between COM-TL and HK-2 cells should theoretically be the greatest among the four crystals. At the same time, the (1̅01) faces of COM-HLA and COM-TLA are bonded together as “fans” to reduce the total (1̅01) plane area such that these (1̅01) faces are effectively shielded from binding to renal tubule cells.22 In terms of crystal faces, these aggregates should all elicit less toxicity than their corresponding individual crystals, but the toxicity of COM-HLA was higher than that of COM-HL in the HK-2 cells. Other factors should be affecting crystal toxicity. Therefore, we conducted a series of cell assays to reveal the mechanism of toxicity variation.
The morphologies of the cells treated with the COM crystals of four different shapes showed obvious changes. The typical features of necrosis, including cellular and nuclear swelling, were observed (Figure 3). The COM crystal treatment caused LDH release (Figure 4) and an improvement in PI-positive staining (Figure 5). These effects indicated the rupture of the cell membrane. As the plasma membrane is directly linked to and functionally integrated with the underlying actin-based cytoskeleton, cell–crystal interactions can be expected to cause the rearrangement of actin.23 Both COM-HLA and COM-TLA produced obviously higher membrane damage than their corresponding single crystals. Numerous sharp corners became exposed when the crystals aggregated. This condition easily caused acute physical damage to the cell membrane, which eventually ruptured. Interestingly, the extent of the damage of the cell membrane caused by the COM crystals did not show the same change rule as that observed for cell viability (Figure 2).
To further reveal the toxicity mechanism of the COM crystals with varying shapes, we detected the intracellular biological indicators. ROS generation and oxidative stress produced by exogenous particles are considered to be important factors associated with particle toxicity.24,25 Generally, particles with a large surface area per unit mass produce large amounts of superoxide radicals and other types of ROS.26 By contrast, the ROS generation induced by the aggregates and single crystals in the current work did not show the same change rule as that observed for the specific surface area of COM crystals. Although the SBET of COM-TLA is higher than that of COM-TL, the ROS generation amount caused by COM-TLA is lower than that caused by COM-TL. Thus, apart from the specific surface area of crystals, the real contact area between the crystal and the cell surface should be an important influencing factor. For the micron-grade crystals, the aggregated crystals barely touched the cell surface; thus, we cannot sufficiently judge ROS generation ability in aggregates according to their detected specific surface areas. The contact area between COM-TL and the cell surface was obviously greater than that between COM-TLA and the cell surface; thus, the COM-TL crystals caused extensive ROS generation. The sharpness of crystals should be another important factor that affects ROS generation ability during exposure to cells. The COM-HLA crystals showed a larger SBET than their corresponding COM-HL crystals. More importantly, COM-HLA exhibited sharply angled edges and tips, which caused serious damage to the cell membrane; such damage led to the upregulation of membrane-associated nicotinamide adenine dinucleotide phosphate (NADPH) oxidase and stimulated the generation of •O2– via NADPH oxidase.27 Therefore, the generation of ROS in the COM-HLA-treated group was higher than that in the COM-HL-treated group.
Apoptosis and necrosis are often preceded by mitochondrial dysfunction accompanied by a loss of mitochondrial membrane potential. Although the micron-sized COM crystals were not in direct contact with intracellular organelles, all of the four types of COM crystals caused a decrease in Δψm (Figure 7). Excessive intracellular ROS formation can overwhelm the natural scavenging activity of cells and, in turn, induce mitochondrial membrane permeability, ultrastructural mitochondrial damage, mitochondrial depolarization, and respiratory chain disturbance.28 The amount of generated ROS was positively related to the loss of Δψm. If mitochondrial damage is severe and the generated ROS overwhelms the natural scavenging activity of cells, cells undergo apoptosis or necrosis.29
Cell death is a complicated pathological process, which may be related to cell types, crystal concentration, exposure time, and even the physicochemical properties of crystals.30 AO/PI staining observation and Annexin V/PI staining quantitative analysis proved that the COM crystals with four different shapes all caused cell death in some degree, mainly in the form of necrotic cell death. Schepers et al.31 also indicated that COM crystals cause acute inflammation-mediated necrotic cell death in renal proximal tubular cells. CaOx crystal exposure can also induce necrotic cell death and apoptotic cell death simultaneously.32
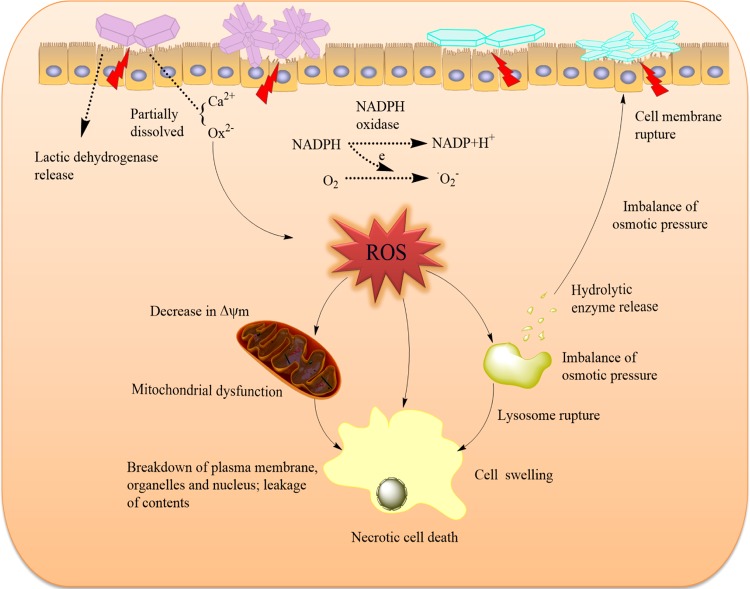
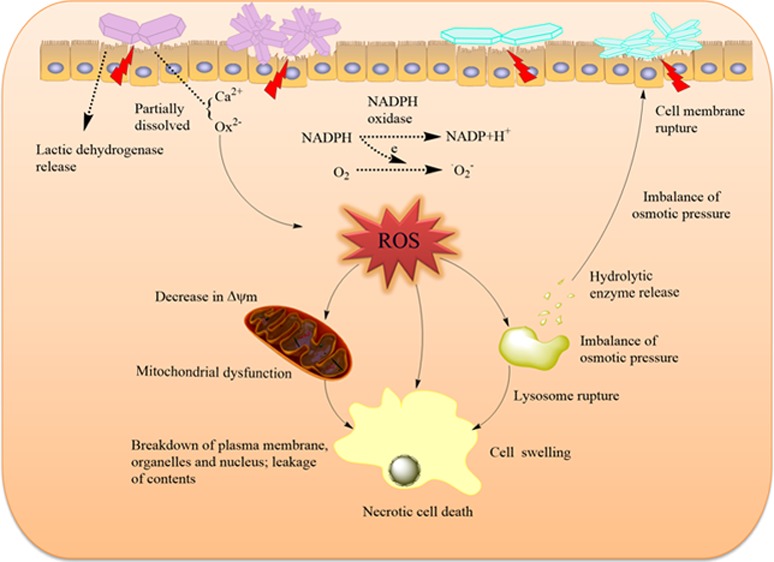
The cell death mechanism induced by the COM crystals of various shapes is summarized as a schematic in Figure 11. When particles attach to the cell surface, these reactive particles damage the cell membranes via oxidative stress or direct interaction, leading to the breakdown of membrane lipids and imbalance of intracellular calcium homeostasis.33 Cell-membrane rupture leads to the imbalance of osmotic pressure across membranes, which can disrupt lysosomal structures and ultimately lead to cell necrosis.34 From the conductivity variation of the COM crystals with four different shapes, we observed that the conductivities of COM-HLA and COM-TL were higher than those of COM-HL and COM-TLA, respectively; that is, COM-HLA and COM-TL should release large amounts of Ca2+ and Ox2– ions to the medium when exposed to cell culture; moreover, they can easily cause the imbalance of osmotic pressure, which leads to serious necrosis. COM-TL crystals possess a blunt morphology and a large active (1̅01) face; thus, the damage induced by these crystals should be particularly homogeneous. In this study, COM-TL induced obviously greater cell apoptosis in comparison with the other crystals. These injured cells provide numerous active sites to induce crystal nucleation and promote further crystallization, crystal retention, and development of stone nidus.
Figure 11.
Proposed schematic illustration of the injury mechanism of HK-2 cells after exposure to varying shapes of COM crystals. Crystals with greater Ca2+ ion-rich (1̅01) active crystal faces and sharp aggregates have higher cytotoxicity on renal epithelial cells.
3.2. Potential Stone Risk Differences Caused by COM Crystals with Different Shapes
The urine of normal and kidney stone patients contains numerous calcium oxalate crystals, which often exhibit different sizes, shapes, and phases.4,35 These generated crystals can attach to epithelial cell membranes, especially in injured epithelial cells. The presence of crystals on the epithelial surface effectively reduces the luminal diameter, impedes the flow of urine and the passage of any crystals formed upstream, and increases the likelihood that the passing crystals will adhere to the crystals already attached to the tubular walls. The crystal shape can affect the crystal flow through the renal tubules. Generally, we assume that urinary flow through the renal tubules is laminar, in which case the flow velocity near the epithelium should be extremely small. Thus, crystals near the epithelial surface travel at a significantly slow speed.36 Such condition increases the contact time between urinary crystals and epithelial cell membranes. Crystal movement from the renal tubules can be influenced by their morphology because of the Stokes drag.37 The Stokes drag is positively related to the specific surface area of urinary crystallites.38 The specific surface areas of COM-HLA and COM-TLA are higher than those of COM-Hl and COM-TL, respectively (Table 1). A high Stokes drag leads to a long contact time during crystal flow through renal tubules. In other words, these aggregated crystals flow slower than their corresponding single crystals under the same size.
All models of CaOx nephrolithiasis indicate that crystal aggregation is involved in crystal retention within the kidneys; specifically, crystal aggregation exerts a considerable effect on the crystal size and shape.39 CaOx crystalluria is common in both stone formers and healthy people, but stone formers excrete more crystal aggregates than normal subjects.40 The urine of stone formers is less inhibitory of crystal aggregation, and the reduction in aggregation inhibition is proportional to the severity of stone disease.37 The aggregation of crystals can considerably affect the particle size, and aggregated crystals commonly exhibit sharp corners. Aggregates more easily cause cell-membrane damage in comparison with their corresponding single crystals. In this work, COM-HLA with sharp corners caused more serious local acute injuries on the cell surface in comparison with COM-HL. When urine flowed through the renal tubules, the amount of COM-TL with large active (1̅01) faces that adhered to the cell surface was greater than that of the other crystals (Figure 10). These adhered crystals further induced intracellular ROS generation, followed by serious intracellular organelle injury and increased stone risk. Therefore, the sharpness of crystals and the contact area between the crystal and cell surface are the two important factors that affect cell toxicity and stone risk.
A high salt diet is an important etiological factor for inducing hypertension, heart disease, and cerebral hemorrhage; however, whether a high salt diet can affect kidney stones is unknown. Sodium metabolism mainly occurs in the kidney, and a high salt diet aggravates the metabolic burden of the kidney and causes renal inflammation.41,42 In crystal preparation experiment, we found that NaCl addition promoted the aggregation of CaOx crystals (Figure 1b,d). Whether high NaCl concentration can aggravate crystal aggregation in physiological conditions is not very clear, but it has proved that high salt intake can increase calcium excretion; every 100 mmol of increase in dietary sodium results in an approximately 25 mg rise in urinary calcium.43 Calcium loss is associated with an increased risk of stone formation. Research has shown that men in the high calcium intake group have a 50% lower risk of recurrence of stone formation in comparison with those in the low calcium intake group.44 Therefore, high salt intake may be an important risk factor for inducing stone formation.
4. Conclusions
This study compared the toxicity in HK-2 cells caused by COM crystals with different shapes and aggregation states. Crystal toxicity in renal epithelial cells was closely associated with the area of the active (1̅01) face and crystal sharpness. The overall damage in the cells was determined according to both the exterior damage and interior damage. The aggregation behavior of the crystals increased the exposed edges and corners but decreased the crystal–cell contact area. The aggregation of sharp crystals aggravated cell injury, whereas the aggregation of blunt crystals weakened cell injury. The crystals with a large (1̅01) active face showed a high toxicity in the HK-2 cells, and they easily adhered to the cell surface. This study can serve as a theoretical basis for elucidating the mechanism of kidney stone formation and determining the causes of stone formation on the basis of the stone shape.
5. Materials and Methods
5.1. Reagents and Apparatus
5.1.1. Reagents
Human kidney proximal tubular epithelial (HK-2) cells were purchased from the Shanghai Cell Bank, Chinese Academy of Sciences (Shanghai, China). Dulbecco’s modified Eagle’s medium (DMEM) and fetal bovine serum were purchased from HyClone Biochemical Products Co., Ltd. (UT). Cell Counting Kit-8 (CCK-8) was purchased from Dojindo Laboratories (Kumamoto, Japan). Lactate dehydrogenase (LDH) kit, acridine orange (AO, Sigma), 2′,7′-dichlorofluorescein diacetate dye (DCFH-DA), hematoxylin–eosin (HE) dye, 5,5′,6,6′-tetrachloro-1,1′,3,3′-tetraethyl-imidacarbocyanine iodide (JC-1), rabbit antimouse IgG conjugated with fluorescein isothiocyanate (FITC-IgG), annexin V-FITC/propidium iodide (PI), and AO/PI were all purchased from Shanghai Beyotime Bio-Tech Co., Ltd. (Shanghai, China). Cell culture plates were purchased from Wuxi Nest Bio-Tech Co., Ltd. (Wuxi, China). Calcium chloride (CaCl2), potassium oxalate (K2Ox), trisodium citrate (Na3cit·2H2O), sodium chloride (NaCl), and the other conventional reagents were all analytically pure and purchased from Guangzhou Chemical Reagent Factory of China (Guangzhou, China).
5.1.2. Apparatus
The apparatus included an X-L type environmental scanning electron microscope (SEM, Philips, Eindhoven, Netherlands), a D/max2400X X-ray powder diffractometer (Rigaku, Japan), a tristar 3000 surface area and porosity analyzer (Micromeritics, American), a Nano-ZS nanoparticle sizer (Malvem, U.K.), a fluorescence microscope (IX51, Olympus, Japan), an enzyme marking instrument (Safire2, Tecan, Männedorf, Switzerland) and a flow cytometer (FACS Aria, BD Corporation, Franklin Lakes, NJ).
5.2. Experimental Methods
5.2.1. Preparation and Characterization of COM Crystals with Various Shapes
5.2.1.1. Hexagonal Lozenge (COM-HL)
CaCl2 and K2Ox solutions were prepared with the concentration of 10 mmol/L in water solution. A 50 mL aliquot of each solution was mixed dropwise at 75 °C. The reaction mixture was stirred with a magnetic stirrer (250 rpm) for 10 min. The crystals were collected by suction filtration and washed with deionized water and anhydrous ethanol three times and then dried in a drying oven for 24 h.
5.2.1.2. Hexagonal Lozenge Aggregate (COM-HLA)
A total of 150 mL of Na2Ox (10 mM) and 150 mL of NaCl (0.5 M) were mixed in a 500 mL beaker, evenly stirred, and heated to 70 °C. Afterward, 150 mL of CaCl2 (5 mM) solution preheated to 70 °C was added in the reaction mixture and the reaction was maintained at 70 °C under continuous stirring at 900 rpm for 2 min. The final solution was incubated overnight at room temperature and followed by collecting the obtained crystals.
5.2.1.3. Thin Hexagonal Lozenge (COM-TL)
Approximately 500 mL of Na2Ox (10 mM) solution and 1.176 g of Na3Cit were added in a 2000 mL beaker, evenly stirred, and heated to 75 °C. Afterward, 500 mL of CaCl2 (5 mM) solution preheated to 75 °C was added in the reaction mixture and the reaction was maintained at 75 °C for 30 min in a static condition. The final solution was incubated overnight at room temperature, and followed by collecting the obtained crystals.
5.2.1.4. Thin Hexagonal Lozenge Aggregate (COM-TLA)
A total of 150 mL of Na2Ox (10 mM), 150 mL of NaCl (0.5 M), and 0.35 g Na3Cit were mixed in a 500 mL beaker, evenly stirred, and heated to 70 °C. Afterward, 150 mL of CaCl2 (5 mM) solution preheated to 75 °C was added in the reaction mixture and the reaction was maintained at 70 °C under continuous stirring at 300 rpm for 2 min. The final solution was incubated overnight at room temperature and followed by collecting the obtained crystals.
The morphology and structural properties of the prepared COM crystals were characterized with an X-L type environmental scanning electron microscope (SEM), an X-ray powder diffractometer (XRD), a Zetasizer Nano ZS90 apparatus, and a tristar 3000 surface area and porosity analyzer.
5.2.2. Cell Culture and Exposure to COM Crystals of Various Shapes
Human kidney proximal tubular epithelial (HK-2) cells were cultured in a DMEM culture medium containing 10% fetal bovine serum, 100 U/ml penicillin–100 μg/mL streptomycin antibiotics with pH 7.4 at 37 °C in a 5% CO2 humidified environment. Upon reaching an 80–90% confluent monolayer, cells were blown gently after trypsin digestion to form cell suspension for the following cell experiment.
For the preparation of varying shapes of COM crystal suspension, a certain amount of COM crystals were UV sterilized for 40 min. Then, the COM crystals were dispersed in a serum-free DMEM culture medium at a concentration of 800 μg/mL and treated with ultrasound for 10 min to obtain uniform crystal conditions. For cell experiments, the cells were seeded in culture plates at a density of 1 × 10⁵ cells/mL and allowed to attach for 24 h and then treated with varying shapes of COM crystals suspended in DMEM for a certain time. Cells maintained in DMEM without COM crystals were used as the control group.
5.2.3. Cell Viability Assay
The cytotoxicity of varying shapes of COM crystals was evaluated by the CCK-8 viability assay. One hundred microliters of cell suspension with a cell concentration of 1 × 10⁵ cells/mL was inoculated per well in 96-well plates for 24 h. The culture medium was removed by suction, and the cells were washed twice with PBS. The experimental model was divided into two groups: (A) control group, in which only the serum-free culture medium was added; (B) treatment group with COM crystals, in which cells were exposed to 200, 400, and 800 μg/mL of COM-HL, COM-HLA, COM-TL, or COM-TLA crystals with a serum-free culture medium, respectively. Each experiment was repeated in five-parallel wells. After incubation for 6 h, 10 μL of CCK-8 was added to each well and incubated for 2 h at 37 °C. The absorbance was measured by using the microplate reader at 450 nm. Cell viability was determined using the equation below.
5.2.4. Hematoxyline–Eosin (HE) Staining
The HE staining assay was performed on cells inoculated with 400 μg/mL COM-HL, COM-HLA, COM-TL, and COM-TLA crystals. After 6 h of incubation, the supernatant was removed by suction and washed three times with PBS. Afterward, the cells were fixed with 4% paraformaldehyde for 15 min at room temperature. Cells were washed thrice with PBS. After fixation, the cells were stained with hematoxylin stain and incubated for 15 min. Then cells were washed with distilled water for 2 min to remove excess stain. After that, the cells were stained with eosin staining solution for 5 min. The cells were washed with distilled water for 2 min to remove excess eosin. After treatment, the cells were observed under the microscope.
5.2.5. Lactate Dehydrogenase (LDH) Release Assay
The experimental model was divided into four groups: (A) cell-free culture medium wells (control wells of the background); (B) control wells without the drug treatment (sample control wells); (C) cells without drug treatment for the subsequent cleavage of the wells (sample maximum enzyme activity control wells); and (D) treated group with COM-HL, COM-HLA, COM-TL, and COM-TLA crystals at concentrations of 200, 400, 800 μg/mL for 6 h (drug-treated wells). Each experiment was performed in five-parallel wells. After incubation, the absorbance was analyzed at 490 nm with a reference wavelength of 620 nm according to the LDH kit instruction.
5.2.6. Propidium Iodide (PI) Staining Assay
The PI staining assay was performed on cells inoculated with 400 μg/mL COM-HL, COM-HLA, COM-TL, and COM-TLA crystals. After 6 h incubation, the supernatant was removed by suction and the cells were washed three times with PBS, and then the cells were stained by 4 μmol/L PI solution for 10 min. Again the cells were washed three times with PBS followed by observing the dead cells by a fluorescence microscope. The nuclei were stained red, indicating late apoptotic or necrotic cells.
Quantitative analysis: the cells were inoculated in 96-well plates with the concentration of 1.0 × 10⁵ cells/mL and 100 μL per well, PI fluorescence intensity was measured directly by an enzyme marking instrument.
5.2.7. Intracellular Reactive Oxygen Species (ROS) Assay
After the exposure of cells to 400 μg/mL COM-HL, COM-HLA, COM-TL, and COM-TLA crystals for 6 h, the cells were suspended by pipetting, followed by centrifugation (1000 rpm, 5 min). The supernatant was aspirated, and the cells were washed once with PBS and centrifuged again to obtain a cell pellet. The cells were resuspended by adding and thoroughly mixing 500 μL of PBS in a microcentrifuge tube. The samples were then stained with 2′, 7′-dichlorofluorescein diacetate (DCFH-DA) for 20 min and analyzed by the flow cytometer. Each experiment was conducted in three-parallel replicates.
5.2.8. Measurement of Mitochondrial Membrane Potential (Δψm)
After the exposure of cells to 400 μg/mL COM-HL, COM-HLA, COM-TL, and COM-TLA crystals for 6 h, the supernatant was aspirated and the cells were washed twice with PBS and digested with 0.25% trypsin. DMEM supplemented with 10% fetal bovine serum was then added to terminate digestion. The cells were suspended by pipetting, followed by centrifugation (1000 rpm, 5 min). The supernatant was aspirated, and the cells were washed with PBS and centrifuged again to obtain a cell pellet. The cells were resuspended by adding and thoroughly mixing 200 μL of PBS in a microcentrifuge tube. Finally, the samples were stained with JC-1 dye and then analyzed by the flow cytometer. Each experiment was conducted in three-parallel replicates.
5.2.9. Cell Apoptosis and Necrosis Observation by AO/PI Staining
Apoptosis and necrosis induced by varying shapes of COM crystals in HK-2 cells was observed by a fluorescence microscope with an AO/PI double-staining assay. Briefly, the cells were harvested after 12 h of exposure to 400 μg/mL COM-HL, COM-HLA, COM-TL, and COM-TLA crystals and then stained using AO/PI dye (1:1, 10 μmol/L) for 15 min. After the color separation by 0.1 mol/L CaCl2 for 1 min, the cells were observed by a fluorescence microscope.
5.2.10. Cell Apoptosis and Necrosis Detection
Apoptosis and necrosis induced by varying shapes of COM crystals in HK-2 cells were measured by a flow cytometer with an Annexin V-FITC/PI double-staining assay. Briefly, the cells were harvested after 12 h of exposure to 400 μg/mL COM-HL, COM-HLA, COM-TL, and COM-TLA crystals, and then stained using an Annexin V-FITC/PI cell death assay kit according to the manufacturer’s instructions. About 1.5 × 10⁵ cells were collected and washed with PBS (centrifuged at 1000 rpm for 5 min). The cells were resuspended in 200 μL of binding buffer. Afterward, 5 μL of Annexin V-FITC was added and then incubated in darkness at room temperature for 10 min. The cells were again resuspended in 200 μL of binding buffer and stained with 5 μL of PI. The prepared cells were then analyzed using a flow cytometer. Each experiment was conducted in three-parallel replicates.
5.2.11. Quantitative Analysis of Adherent COM Crystals by Flow Cytometry
The adhesion amount of FITC-IgG fluorescence-labeled COM crystals of various shapes on HK-2 cells was measured by a flow cytometer. The experimental model was divided into two groups: (a) control group: in which only a normal serum-free culture medium was added; (b) adhesion group: cells were exposed to 400 μg/mL COM-HL, COM-HLA, COM-TL, and COM-TLA crystals for 1 h. Afterward, the culture medium was removed by suction and the cells were washed twice with PBS (to eliminate the unbound crystals) followed by trypsinization, respectively. The cells were resuspended with 200 μL of PBS. The cellular adhesion of crystals was then quantitatively determined by a flow cytometer; cells with positive FITC signal were directly counted as those with adherent crystals. Each experiment was conducted in three-parallel replicates.
5.2.12. Statistical Analysis
Statistical analyses were performed using the SPSS 13.0 software. Data were expressed as the mean ± SD. Multiple group comparisons were performed using one-way ANOVA, followed by the Tukey post hoc test. If p < 0.05, there was a significant difference; if p < 0.01, the difference was extremely significant; and if p > 0.05, there was no significant difference. The symbols * and ** are used to indicate the significance between the COM-treated groups and control group, and the symbols # and ## are used to indicate the significance between the COM-HL treatment group and COM-HLA treatment group or the COM-TL treatment group and COM-TLA treatment group.
Acknowledgments
This work was supported by the National Natural Science Foundation of China (No. 21371077) and the China Postdoctoral Science Foundation Funded Project (No. 2017M612837).
The authors declare no competing financial interest.
References
- Saita A.; Bonaccorsi A.; Motta M. Stone compsition: Where do we stand?. Urol. Int. 2007, 79, 16–19. 10.1159/000104436. [DOI] [PubMed] [Google Scholar]
- Moe O. W. Kidney stones: pathophysiology and medical management. Lancet 2006, 367, 333–344. 10.1016/S0140-6736(06)68071-9. [DOI] [PubMed] [Google Scholar]
- Hovda K. E.; Guo C.; Austin R.; McMartin K. E. Renal toxicity of ethylene glycol results from internalization of calcium oxalate crystals by proximal tubule cells. Toxicol. Lett. 2010, 192, 365–372. 10.1016/j.toxlet.2009.11.013. [DOI] [PubMed] [Google Scholar]
- He J.-Y.; Deng S.-P.; Ouyang J.-M. Morphology, particle size distribution, aggregation, and crystal phase of nanocrystallites in the urine of healthy persons and lithogenic patients. IEEE Trans. Nanobiosci. 2010, 9, 156–163. 10.1109/TNB.2010.2045510. [DOI] [PubMed] [Google Scholar]
- Robertson W. G.; Peacock M.; Nordin B. E. Calcium crystalluria in recurrent renal-stone formers. Lancet 1969, 2, 21–24. 10.1016/S0140-6736(69)92598-7. [DOI] [PubMed] [Google Scholar]
- Wang Z.; Xie D.; Liu H.; Bao Z.; Wang Y. Toxicity assessment of precise engineered gold nanoparticles with different shapes in zebrafish embryos. RSC Adv. 2016, 6, 33009–33013. 10.1039/C6RA00632A. [DOI] [Google Scholar]
- Ispas C.; Andreescu D.; Patel A.; Goia D. V.; Andreescu S.; Wallace K. N. Toxicity and developmental defects of different sizes and shape nickel nanoparticles in zebrafish. Environ. Sci. Technol. 2009, 43, 6349–6356. 10.1021/es9010543. [DOI] [PMC free article] [PubMed] [Google Scholar]
- Qiu Y.; Liu Y.; Wang L.; Xu L.; Bai R.; Ji Y.; Wu X.; Zhao Y.; Li Y.; Chen C. Surface chemistry and aspect ratio mediated cellular uptake of Au nanorods. Biomaterials 2010, 31, 7606–7619. 10.1016/j.biomaterials.2010.06.051. [DOI] [PubMed] [Google Scholar]
- Daudon M.; Jungers P.; Bazin D. Stone morphology: implication for pathogenesis. AIP Conf. Proc. 2008, 1049, 199–215. 10.1063/1.2998023. [DOI] [Google Scholar]
- Bazin D.; Daudon M.; Combes C.; Rey C. Characterization and some physicochemical aspects of pathological microcalcifications. Chem. Rev. 2012, 112, 5092–5120. 10.1021/cr200068d. [DOI] [PubMed] [Google Scholar]
- Inoue M.; Hirasawa I. The relationship between crystal morphology and XRD peak intensity on CaSO4·2H2O. J. Cryst. Growth 2013, 380, 169–175. 10.1016/j.jcrysgro.2013.06.017. [DOI] [Google Scholar]
- Walton R. C.; Kavanagh J. P.; Heywood B. R. The density and protein content of calcium oxalate crystal precipitated from human urine: a tool to investigate ultrastructure and the fractional volume occupied by organic matrix. J. Struct. Biol. 2003, 143, 14–23. 10.1016/S1047-8477(03)00117-5. [DOI] [PubMed] [Google Scholar]
- Schepers M. S. J.; Duim R. A. J.; Asselman M.; Romijn J. C.; Schroder F. H.; Verkoelen C. F. Internalization of calcium oxalate crystals by renal tubular cells: A nephron segment-specific process?. Kidney Int. 2003, 64, 493–500. 10.1046/j.1523-1755.2003.00107.x. [DOI] [PubMed] [Google Scholar]
- Sheng X.; Jung T.; Wesson J. A.; Ward M. D. Adhesion at calcium oxalate crystal surfaces and the effect of urinary constituents. Proc. Natl. Acad. Sci. U.S.A. 2005, 102, 267–272. 10.1073/pnas.0406835101. [DOI] [PMC free article] [PubMed] [Google Scholar]
- Malugin A.; Ghandehari H. Cellular uptake and toxicity of gold nanoparticles in prostate cancer cells: a comparative study of rods and spheres. J. Appl. Toxicol. 2010, 30, 212–217. 10.1002/jat.1486. [DOI] [PubMed] [Google Scholar]
- Sunshine J. C.; Perica K.; Schneck J. P.; Green J. J. Particle shape dependence of CD8+ T cell activation by artificial antigen presenting cells. Biomaterials 2014, 35, 269–277. 10.1016/j.biomaterials.2013.09.050. [DOI] [PMC free article] [PubMed] [Google Scholar]
- Zhang Y.; Tekobo S.; Tu Y.; Zhou Q.; Jin X.; Dergunov S. A.; Pinkhassik E.; Yan B. Permission to enter cell by shape: nanodisk vs nanosphere. ACS Appl. Mater. Interfaces 2012, 4, 4099–4105. 10.1021/am300840p. [DOI] [PubMed] [Google Scholar]
- Hallson P. C.; Rose G. A. Chemical measurement of calcium oxalate crystalluria: results in various causes of calcium urolithiasis. Urol. Int. 1990, 45, 332–335. 10.1159/000281731. [DOI] [PubMed] [Google Scholar]
- Mulay S. R.; Kulkarni O. P.; Rupanagudi K. V.; Migliorini A.; Darisipudi M. N.; Vilaysane A.; Muruve D.; Shi Y.; Munro F.; Liapis H.; Anders H.-J. Calcium oxalate crystals induce renal inflammation by NLRP3-mediated IL-1β secretion. J. Clin. Invest. 2013, 123, 236–246. 10.1172/JCI63679. [DOI] [PMC free article] [PubMed] [Google Scholar]
- Sheng X.; Ward M. D.; Wesson J. A. Crystal surface adhesion explains the pathological activity of calcium oxalate hydrates in kidney stone formation. J. Am. Soc. Nephrol. 2005, 16, 1904–1908. 10.1681/ASN.2005040400. [DOI] [PubMed] [Google Scholar]
- Sheng X.; Jung T. S.; Wesson J. A.; Ward M. D. Adhesion at calcium oxalate crystal surfaces and the effect of urinary constituents. Proc. Natl. Acad. Sci. U.S.A. 2005, 102, 267–272. 10.1073/pnas.0406835101. [DOI] [PMC free article] [PubMed] [Google Scholar]
- Shirane Y.; Kurokawa Y.; Sumiyoshi Y.; Kagawa S. Morphological effects of glycosaminoglycans on calcium oxalate monohydrate crystals. Scanning Microsc. 1995, 9, 1081–1088. [PubMed] [Google Scholar]
- Huang X.; Teng X.; Chen D.; Tang F.; He J. The effect of the shape of mesoporous silica nanoparticles on cellular uptake and cell function. Biomaterials 2010, 31, 438–448. 10.1016/j.biomaterials.2009.09.060. [DOI] [PubMed] [Google Scholar]
- Yin L.; Dai Y.; Cui Z.; Jiang X.; Liu W.; Han F.; Lin A.; Cao J.; Liu J. The regulation of cellular apoptosis by the ROS-triggered PERK/EIF2alpha/chop pathway plays a vital role in bisphenol A-induced male reproductive toxicity. Toxicol. Appl. Pharmacol. 2017, 314, 98–108. 10.1016/j.taap.2016.11.013. [DOI] [PubMed] [Google Scholar]
- Li Y.; Sun L.; Jin M.; Du Z.; Liu X.; Guo C.; Li Y.; Huang P.; Sun Z. Size-dependent cytotoxicity of amorphous silica nanoparticles in human hepatoma HepG2 cells. Toxicol. In Vitro 2011, 25, 1343–1352. 10.1016/j.tiv.2011.05.003. [DOI] [PubMed] [Google Scholar]
- Nel A.; Xia T.; Mädler L.; Li N. Toxic potential of materials at the nanolevel. Science 2006, 311, 622–627. 10.1126/science.1114397. [DOI] [PubMed] [Google Scholar]
- Umekawa T.; Tsuji H.; Uemura H.; Khan S. R. Superoxide from NADPH oxidase as second messenger for the expression of osteopontin and monocyte chemoattractant protein-1 in renal epithelial cells exposed to calcium oxalate crystals. BJU Int. 2009, 104, 115–120. 10.1111/j.1464-410X.2009.08374.x. [DOI] [PMC free article] [PubMed] [Google Scholar]
- Park E.-J.; Yi J.; Chung Y.-H.; Ryu D.-Y.; Choi J.; Park K. Oxidative stress and apoptosis induced by titanium dioxide nanoparticles in cultured BEAS-2B cells. Toxicol. Lett. 2008, 180, 222–229. 10.1016/j.toxlet.2008.06.869. [DOI] [PubMed] [Google Scholar]
- Kroemer G.; Dallaporta B.; Resche-Rigon M. The mitochondrial death/life regulator in apoptosis and necrosis. Annu. Rev. Physiol. 1998, 60, 619–642. 10.1146/annurev.physiol.60.1.619. [DOI] [PubMed] [Google Scholar]
- Sun X. Y.; Ouyang J. M. New view in cell death mode: effect of crystal size in renal epithelial cells. Cell Death Dis. 2015, 6, e2013 10.1038/cddis.2015.359. [DOI] [PMC free article] [PubMed] [Google Scholar]
- Schepers M. S.; Van Ballegooijen E. S.; Bangma C. H.; Verkoelen C. F. Crystals cause acute necrotic cell death in renal proximal tubule cells, but not in collecting tubule cells. Kidney Int. 2005, 68, 1543–1553. 10.1111/j.1523-1755.2005.00566.x. [DOI] [PubMed] [Google Scholar]
- Khan S. R.; Byer K. J.; Thamilselvan S.; Hackett R. L.; McCormack W. T.; Benson N. A.; Vaughn K. L.; Erdos G. W. Crystal-cell interaction and apoptosis in oxalate-associated injury of renal epithelial cells. J. Am. Soc. Nephrol. 1999, 10, S457–463. [PubMed] [Google Scholar]
- Li S.-Q.; Zhu R.-R.; Zhu H.; Xue M.; Sun X.-Y.; Yao S.-D.; Wang S.-L. Nanotoxicity of TiO 2 nanoparticles to erythrocyte in vitro. Food Chem. Toxicol. 2008, 46, 3626–3631. 10.1016/j.fct.2008.09.012. [DOI] [PubMed] [Google Scholar]
- Liu Z.; Xiao Y.; Chen W.; Wang Y.; Wang B.; Wang G.; Xu X.; Tang R. Calcium phosphate nanoparticles primarily induce cell necrosis through lysosomal rupture: the origination of material cytotoxicity. J. Mater. Chem. B 2014, 2, 3480–3489. 10.1039/c4tb00056k. [DOI] [PubMed] [Google Scholar]
- Ouyang J.-M.; Xia Z.-Y.; Zhang G.-N.; Chen H.-Q. Nanocrystallites in urine and their relationship with the formation of kidney stones. Rev. Inorg. Chem. 2012, 32, 101–110. 10.1515/revic-2012-0002. [DOI] [Google Scholar]
- Robertson W. G. Kidney models of calcium oxalate stone formation. Nephron Physiol. 2004, 98, P21–P30. 10.1159/000080260. [DOI] [PubMed] [Google Scholar]
- Khan S. R. Renal tubular damage/dysfunction: key to the formation of kidney stones. Urol. Res. 2006, 34, 86–91. 10.1007/s00240-005-0016-2. [DOI] [PubMed] [Google Scholar]
- Loth E. Drag of non-spherical solid particles of regular and irregular shape. Powder Technol. 2008, 182, 342–353. 10.1016/j.powtec.2007.06.001. [DOI] [Google Scholar]
- Kok D. J.; Khan S. R. Calcium oxalate nephrolithiasis, a free or fixed particle disease. Kidney Int. 1994, 46, 847–854. 10.1038/ki.1994.341. [DOI] [PubMed] [Google Scholar]
- Robertson W. G.; Peacock M. Calcium oxalate crystalluria and inhibitors of crystallization in recurrent renal stone-formers. Clin. Sci. 1972, 43, 499–506. 10.1042/cs0430499. [DOI] [PubMed] [Google Scholar]
- Rosón M. I.; Cavallero S.; Della Penna S.; Cao G.; Gorzalczany S.; Pandolfo M.; Kuprewicz A.; Canessa O.; Toblli J. E.; Fernandez B. E. Acute sodium overload produces renal tubulointerstitial inflammation in normal rats. Kidney Int. 2006, 70, 1439–1446. 10.1038/sj.ki.5001831. [DOI] [PubMed] [Google Scholar]
- Jones-Burton C.; Mishra S. I.; Fink J. C.; Brown J.; Gossa W.; Bakris G. L.; Weir M. R. An in-depth review of the evidence linking dietary salt intake and progression of chronic kidney disease. Am. J. Nephrol. 2006, 26, 268–275. 10.1159/000093833. [DOI] [PubMed] [Google Scholar]
- Heilberg I. P.; Schor N. Renal stone disease: Causes, evaluation and medical treatment. Arq. Bras. Endocrinol. Metabol. 2006, 50, 823–831. 10.1590/S0004-27302006000400027. [DOI] [PubMed] [Google Scholar]
- Curhan G. C.; Willett W. C.; Rimm E. B.; Stampfer M. J. Family history and risk of kidney stones. J. Am. Soc. Nephrol. 1997, 8, 1568–1573. [DOI] [PubMed] [Google Scholar]


