Abstract
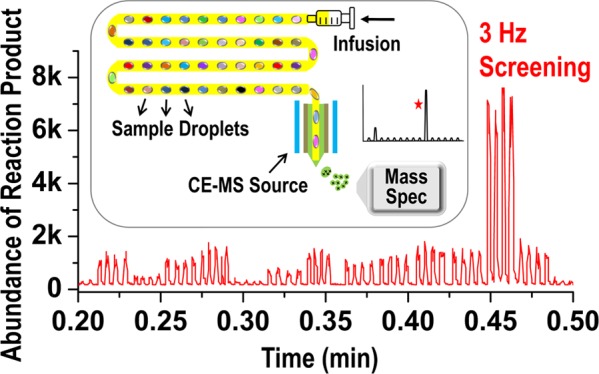
Directed Evolution is a key technology driving the utility of biocatalysis in pharmaceutical synthesis. Conventional approaches to Directed Evolution are conducted using bacterial cells expressing enzymes in microplates, with catalyzed reactions measured by HPLC, high-performance liquid chromatography-mass spectrometry (HPLC-MS), or optical detectors, which require either long cycle times or tailor-made substrates. To better fit modern, fast-paced process chemistry development where solutions are rapidly needed for new substrates, droplet microfluidics interfaced with electrospray ionization (ESI)-MS provides a label-free high-throughput screening platform. To apply this method to industrial enzyme screening and to explore potential approaches that may further improve the overall throughput, we optimized the existing droplet–MS methods. Carryover between droplets, traditionally a significant issue, was reduced to undetectable level by replacing the stainless steel ESI needle with a Teflon needle within a capillary electrophoresis (CE)–MS source. Throughput was improved to 3 Hz with a wide range of droplet sizes (10–50 nL) by tuning the sheath flow within the CE–MS source. The optimized method was demonstrated by screening reactions using two different transaminase libraries. Good correlations (r2 ∼ 0.95) were found between the droplet–MS and LC–MS methods, with 100% match on hit variants. We further explored the capability of the system by performing in vitro transcription–translation inside the droplets and directly analyzing the intact reaction mixture droplets by MS. The synthesized protein attained comparable activity to the protein standard, and the complex samples appeared well tolerated by the MS. The success of the above applications indicates that the MS analysis of the microfluidic droplets is an available option for considerably accelerating the screening of enzyme evolution libraries.
Introduction
Biocatalysis has become a valuable tool in the synthetic chemist’s toolbox,1−7 often providing unmatched specificities for producing the desired products. However, industrial substrates and reaction environments are typically very different from those for which native enzymes have originally evolved, and these differences often lead to the suboptimal performance for industrial biocatalysts. Directed Evolution provides a methodology for the retuning of an enzyme to a new substrate and new reaction conditions by re-engineering the amino acid sequence.2,8−13 Directed Evolution is becoming widely used on many enzymes for the chemical synthesis of commercial products.3 As an example, Merck Sharp & Dohme (MSD) engineered an optimized transaminase for the production of sitagliptin that underwent 11 rounds of Directed Evolution carried out over the course of one year, ultimately changing 27 amino acids in the enzyme sequence.8 The large number of biocatalytic opportunities, combined with the relatively long cycle time for each round of evolution, creates a compelling need for speeding and simplifying the Directed Evolution process.14
Screening of enzyme libraries is a hallmark of Directed Evolution and is often the rate-limiting step in a Directed Evolution project. Consequently, improved technologies for carrying out the rapid analysis of enzyme performance are an area of active research interest. One exciting technology developed recently has been the advancement of a high-throughput screening (HTS) in microfluidic droplets.15−17 This technology dramatically decreases the assay volume while increasing the rate of analysis, enabling the rapid identification of rare, sought-after events in the library. A recent review18 surveyed the analytical techniques currently in use for Directed Evolution studies. Most experiments have been designed to liberate a fluorophore upon reaction, and similar strategies have taken advantage of chemiluminescence, electrochemistry, light scattering, and absorbance differences between tailor-made substrates and their corresponding products. However, as “you get what you screen for”, the design of substrate/product pairs to match the analytical readout is poorly received by industrial scientists, whose flexibility to modify the desired substrate is highly limited.19 Industrial biocatalysis applications require an analytical method that is more general, less compound specific, and faster to develop.
Mass spectrometry (MS) is among the most preferred detectors for the pharmaceutical industry. It is ubiquitous, rapidly tunable to target analytes, and highly sensitive. Two ionization technologies—electrospray ionization (ESI) and matrix-assisted laser desorption ionization (MALDI)—are most widely employed. ESI-MS is more readily available due to the lower price and the flexibility to be interfaced with liquid-introducing sources, such as high-performance liquid chromatography (HPLC), flow injection, and droplet microfluidics. The throughput of universally used, conventional HPLC-ESI-MS is limited by a typical 3 min/sample, corresponding to 2 weeks of screening for a typical round of selection of 5000 protein variants. Alternative approaches, such as multiple injections in a single experimental run (MISER) and RapidFire can potentially increase the throughput to 10 s/sample,20−22 reducing the analysis time to ∼14 h for the same size of a library. Given the power of modern mass spectrometers to identify a product mass in a complex sample matrix, a chromatographic step is often not necessary to monitor enzyme activity. Interfacing droplet microfluidics with ESI-MS would bypass the separation and therefore improve the speed. The high-throughput droplet–MS method developed by the Kennedy laboratory demonstrated a label-free screening with the throughput as high as 1.7 samples/s (0.6 s/sample),23,24 further reducing the analysis time to less than 1 h for 5000 samples, representing a 15-fold improvement over the MISER-based approaches21 and a 300-fold over typical LC–MS methods. It is getting close to some optical methods,18 but can be achieved without the need for a surrogate substrate development. Recent studies have also demonstrated the success of using MALDI-time-of-flight for HTS with automatic sample preparation (∼30 min for 1536 samples), high analysis rate (∼1 s/sample),25−27 and decent agreement with orthogonal assays (e.g., correlation coefficient r2 ∼ 0.9 with RapidFire screening25). Nevertheless, the expense of the instrument, the consumables, and the spotting robot (e.g., mosquito) understandably prevents the technology from being quickly adopted by most laboratories, especially resource-limited ones.
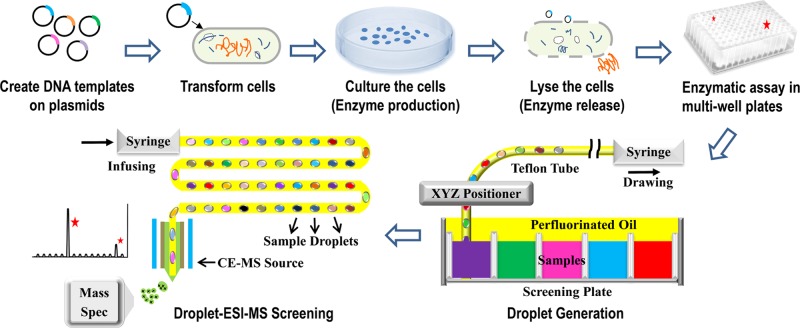
In this work, we further tailored the droplet–MS methodology23 for use in Directed Evolution in pharmaceutical process development (Figure 1). First, we implemented the technology on an Agilent single quadrupole that is the most basic ESI-MS system at MSD. More importantly, we generalized the method with commercially available components to allow a rapid implementation by industrial scientists. Second, carryover between the droplet samples was more sustainably overcome by using a Teflon ESI needle within a capillary electrophoresis–mass spectrometry (CE–MS) ESI source that had the added benefit of being able to apply a sheath flow to stabilize electrospray for certain applications. Third, the analysis rate was increased to 3 samples/s (3 Hz), which enabled screening of one 96-well plate in 30 s. Two different transaminase libraries were screened using this optimized method. The screening results were compared with the optimized LC–MS methods, and good correlations (r2 ∼ 0.95) were found between the two methods with 100% match on hits. Finally, we demonstrated that the new MS configuration was capable of handling complex cell free protein synthesis reaction samples generated through in vitro transcription/translation (ivTT), which offers a further speed advantage by skipping the cell growth and protein harvest steps.
Figure 1.
Droplet–ESI-MS methodology for high-throughput biocatalysts screening in Directed Evolution. Following the arrows: DNA templates of selected enzymes are created on plasmids; the cells are transformed with DNA-carrying plasmids; the cells are cultured and the target enzymes are produced; the cells are lysed to release the enzymes; enzymatic assays are carried out in multiwell plates; sample droplets are generated into a Teflon tube from the assay plates; sample droplets are infused into ESI-MS for high-throughput screening.
Results and Discussion
Droplet Generation
To make droplets from multiwell plates, we purchase the XYZ positioner, attach a power supply as described by the manufacturer, and train the positioner to multiwell plates using a G-Code as described previously (Figure S1A).23 To verify this instrument worked satisfactorily, the droplet carrier Teflon tubing is clamped onto the Z positioning head and connected on the other end to a syringe loaded into a syringe pump. A well plate is filled with blue dye and overlaid with perfluorinated oil. With the syringe pump operating in filling mode, the positioner moves the tubing to each well alternating between the sample and the oil. As shown in Figure 2A, the samples are aspirated through a Teflon sipper directly inserted into the droplet carrier tubing. The blue dye droplets are ∼50 nL and the clear oil gap is a slightly larger than the droplets.
Figure 2.
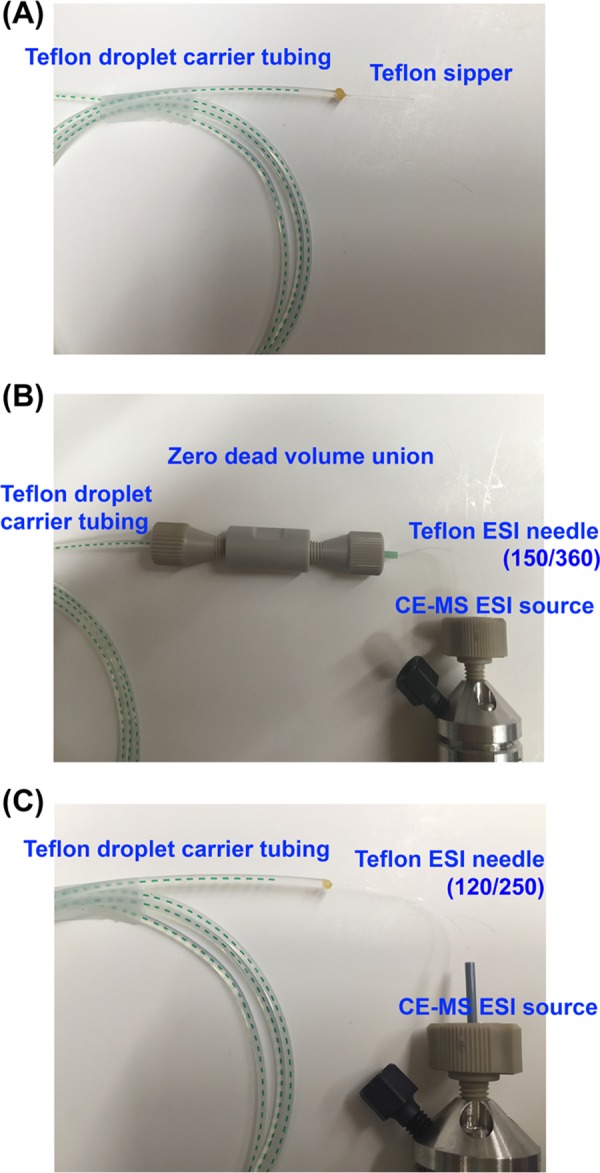
All-Teflon fluid path for droplet generation and droplet–MS analysis. (A) Droplet generation is accomplished using a 120/250 Teflon sipper connected to a 250/1600 carrier tubing via a wax seal (B) during MS analysis droplet carrier tubing is connected to a 150/360 Teflon needle by a zero dead volume PEEK union. (C) Alternatively, a 120/250 Teflon needle can be inserted into the droplet carrier tubing directly and sealed with wax.
The droplet generation rate is ∼0.3 Hz (droplets/s) from a single plate. The XYZ positioner used in this study is capable of parallel sample reformatting from 4 plates into 4 tubes (Figure S1A), corresponding to 1.2 Hz (∼25 min for 1536 droplets). Detaching the droplet carrier tubing from the positioner and reattaching it to ESI-MS takes <30 s. If multiple tubes of droplets are to be screened, each manual detaching and reattaching needs <30 s.23 Although tubing change is not a speed-limiting step in the entire screening process, one can envision that a fully automated platform, potentially with a valving control, will reduce the required time to negligible.
Carryover Elimination with Teflon ESI Needle
Carryover is a frequent issue when droplets are transferred from fluorophilic Teflon tubing into nonfluoriphilic tubing due to differences in surface chemistry. Unlike Teflon, which is wetted by the fluorinated oil that encapsulates and prevents the aqueous samples from interacting with each other, the hydrophilic stainless steel (SS) needle used in most ESI sources is wetted by the aqueous samples, leading to cross contamination. Carryover is observed in the first 5 droplets (50 nL each) of each sample when using the default SS needle (∼9 cm) on an Agilent single-quadrupole MS (Figure 3A). In previous studies, the carryover is mitigated by replacing the SS needle with an internally fluorosilane-functionalized fused silica (FS) capillary, which is externally sputter coated with gold–platinum alloy for electrical conductivity.23 Although the fluorinated FS capillary significantly reduced the carryover at low analysis rate, ∼20% carryover is observed when the throughput is increased to >3 Hz. Additionally, the process of treating the inside of the FS capillary to be hydrophobic and sputter coating the outside for conductivity is time consuming and labor intensive. Therefore, a commercial solution enabling the direct electrospray from a Teflon needle is desired.
Figure 3.
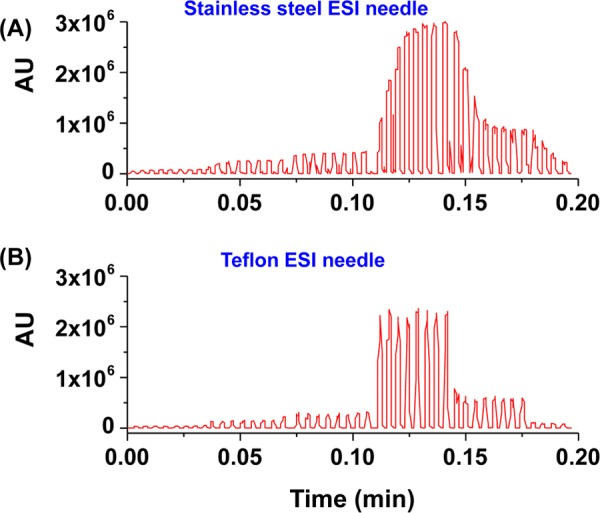
Carryover comparison between the default SS needle (A) and a 150/360 Teflon needle (B). A series of pyridinyl amine standards from 0.05 to 1.5 mM reformatted into sets of eight 50 nL droplets were used to evaluate the carryover. Carryover generated by SS needle is 5 droplets. In contrast, the Teflon needle generated no carryover.
Unlike most MS that applies high voltage onto the ESI source, the Agilent single-quadrupole MS applies high voltage to the transferring capillary inside the MS, whereas the ESI source remains grounded. Such settings broaden the choice of ESI needles to those that are nonconductive, such as Teflon. However, standard ESI sources have a thin needle (<200 μm o.d.) and a Teflon tubing is not readily available at such small diameters. As an alternative, the CE–MS ESI source (Figure S1C,D) from Agilent’s capillary electrophoresis hardware is compatible with the 360 μm o.d. tubings that are commonly used in capillary electrophoresis and is a commonly available size of Teflon tubing. To demonstrate the electrospray compatibility with a Teflon tubing, we first test a 150/360 Teflon needle, connected to the droplet carrier tubing through a zero-dead-volume union (Figure 2B), and find that it provides a stable electrospray and a minimal carryover (Figure 3B) for most analytical samples. However, the droplets with complex components are more likely to break at tubing connections. To mitigate this issue, we replace the 150/360 needle and the union with a 120/250 Teflon needle that can be directly inserted into the 250/1600 droplet carrier tubing with a simple wax seal (Figure 2C). We find this configuration also provides minimal carryover and is more suitable for fragile droplets.
The MS signal quality using a Teflon ESI needle is evaluated with a pyridinyl amine (Scheme 1) standard containing trace amount of pyridinyl ketone. The amine is sampled into ∼200 droplets and continuously sprayed into the MS. Both high amine signal and low ketone signals are detected with fair stability over the 200 droplets (Figure S2A,B). The relative standard deviation (% RSD) was 12 and 15% for the amine and ketone, respectively; however % RSD can be reduced to <5% by dividing the signal for a given analyte by the total signal for both analytes (same as % conversion calculation). To determine if the Teflon ESI needle has an effect on linear range, a series of standards are measured (Figure S2C,D). Response remained linear from 1 to 100 μM (r2 ∼ 0.99) and a positive correlation is observed from 0.5 to 1000 μM, demonstrating a good sensitivity and a wide semiquantitative window.
Scheme 1. Pyridinyl Amine Converted to Pyridinyl Ketone.
Throughput Improvement with Agilent Single Quad
The previous study demonstrates a 1.7 Hz droplet analysis rate, which is the highest throughput robustly achievable for at least 4200+ droplets.23 The sampling rate of the Agilent single-quadrupole MS is set by the “peak width” parameter in the MS setup software; the fastest data acquisition rate required setting the peak width to the lowest value (0.005 min), which corresponds to ∼35 data points/s in the MS. Assuming that 5 data points are collected for each droplet and the same for the oil gap, the MS should support a 3.5 Hz analysis. Infusion rate is another key factor affecting the throughput and needs to be tuned with the droplet size to attain a stable signal, a sufficient number of scans over each peak, and a low pressure on droplets to avoid breakage and merging. Typical experiments used 50 nL droplets with a 2.5:1 length-to-width ratio and with an oil gap slightly larger than the droplets. This type of segmented flow is found to be most stable within the 250 μm i.d. tubing. After testing the infusion rates from 1 to 200 μL/min, 20 μL/min was found to provide the best performance in terms of the droplet stability, spray efficiency, and throughput for 50 nL droplets. Under these conditions, Figure 3B demonstrates the analysis rate—44 droplets assayed in 0.2 min, which corresponds to 3.7 Hz. Similar result is shown in Figure S2A—200 droplets detected in 0.925 min, which corresponds to 3.6 Hz.
Broader Droplet Size Compatibility with Sheath Flow
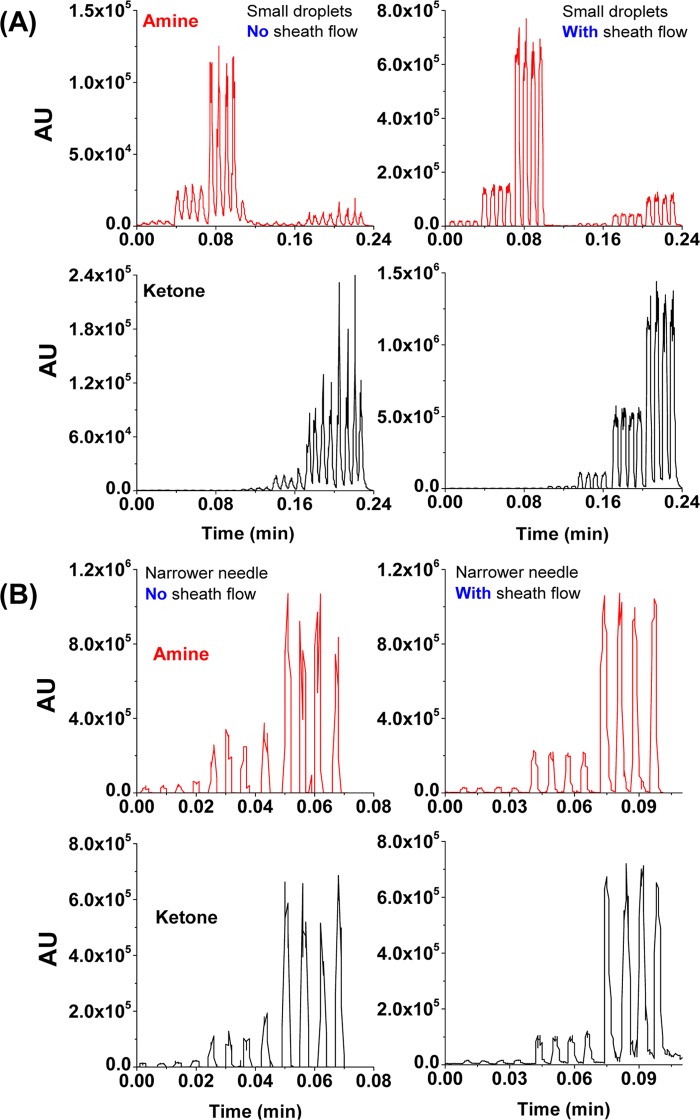
During flow rate optimization, the electrospray becomes unstable at flow rates below 5 μL/min. Although such low flow rates are unnecessary with 50 nL droplet samples, they are required for analysis of smaller droplets (e.g., <15 nL) to avoid undersampling by MS. Because of the low electro-osmotic flow rate in CE, the CE–MS source has an additional inlet for the introduction of a coaxial flow (termed “sheath flow” in CE–MS technology) to facilitate efficient electrospray. In the same way, an additional sheath flow can enhance the spray efficiency of the droplets. When infusing droplets as small as 10 nL (compatible with microfluidic devices16,28) at 5 μL/min, significant improvement is seen in both MS signal intensity and distinguishability with the addition of a 20 μL/min sheath flow (Figure 4). For poorly ionized compounds (ketone traces, Figure 4), the improvement is even more pronounced. The best performance is seen when the sheath liquid has the same solvent composition of the droplet (i.e., 20% acetonitrile (ACN) and 0.1% formic acid). Typically, a nano-ESI source16 is required to analyze low-volume samples (e.g., 10 nL droplets), but the addition of a sheath flow in the CE–MS source expanded the range of sample volumes compatible with the traditional electrospray.
Figure 4.
Droplets signal enhanced by sheath flow: (A) small (10 nL) pyridinyl amine (upper) and ketone (lower) droplets with three concentrations were analyzed at 5 μL/min through a 150/360 Teflon needle. The left is without sheath flow and the right is with 20 μL/min sheath flow (20% ACN, 0.1% formic acid) (B) regular size (50 nL) amine (upper) and ketone (lower) droplets were analyzed at 15 μL/min through a narrower (120/250) Teflon needle. The left is without a sheath flow and the right is with a 30 μL/min sheath flow.
The 120/250 Teflon needle is evaluated with the same pyridinyl amine droplets at different concentrations with or without the sheath flow using regular size droplets (50 nL). Droplets without the sheath flow are infused to the MS at 20 μL/min, whereas those with the sheath flow are infused at 15 μL/min plus a sheath flow at 30 μL/min. As illustrated in Figure 4B, the sheath flow greatly increases the signal quality. In the process of optimizing the sheath flow rate, we observe that when the sheath flow exceeds 30 μL/min, the gaps between the droplet peaks contract, indicating that the total infusion rate is too high for the MS data acquisition to distinguish one droplet from another. After testing several flow rate combinations, the optimal conditions are 15 μL/min droplet infusion and a 30 μL/min sheath flow.
Transaminase ATA-036 Screening
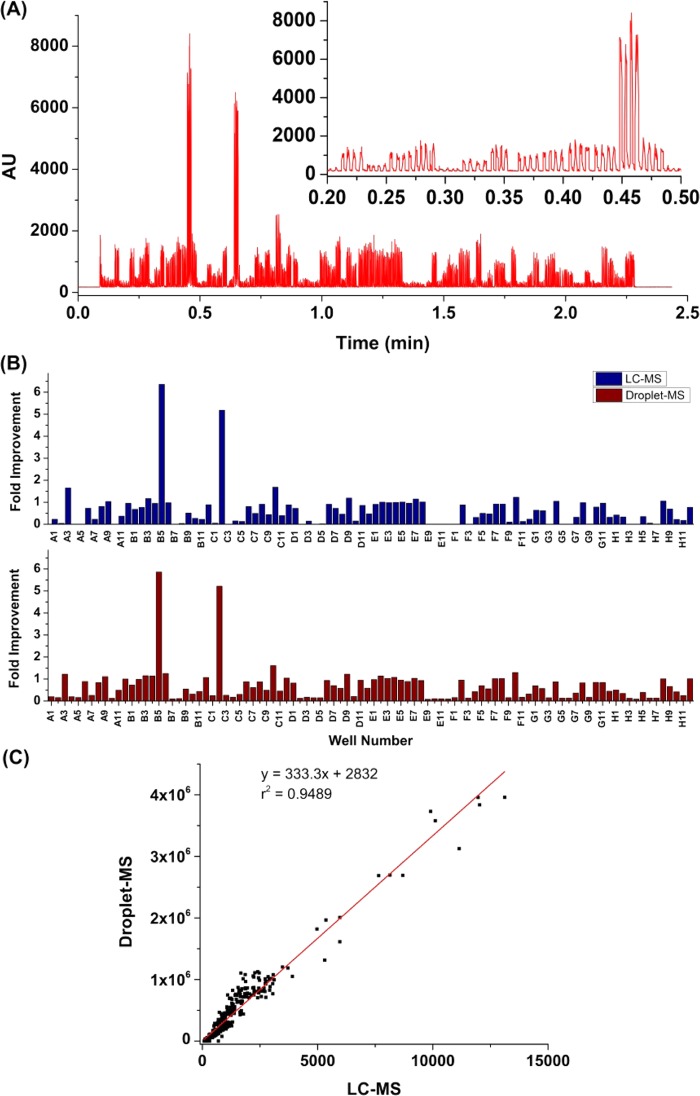
Once the stability and feasibility of utilizing this CE–MS source and the Teflon needle are confirmed, the new droplet–MS system is used for variant library screening. The parent transaminase is able to convert methyl 4-methyl-3-oxopentanoate (ketoester) to its corresponding amine, which then spontaneously undergoes hydrolysis under the reaction conditions to form β-leucine as the final product (Scheme 2). Eighty-four variants are mapped to individual well in rows A–D, and F–H. Row E contains positive controls in E1–E8 and negative controls in E9–E12. The variants are grown, induced to express enzyme, and treated to produce a clarified lysate for screening. After the transamination reaction and sample preparation (including acetonitrile precipitation of protein and plate filtration), these samples are first analyzed on a commercial HPLC-MS (Figure 5B). Then, the plate is further diluted 5-fold to a final 18 v/v % ACN and reformatted into perfluorodecalin (PFD) segmented droplets quadruplicatedly for each sample. Although the reaction mixture contains high amount of dimethyl sulfoxide (DMSO), pyridoxal-5-phosphate (PLP) cofactor, salts, and cell lysate proteins and surfactants that destabilize the droplets, the plate filtration and further dilution resolve this issue, enabling the sample droplets to be directly analyzed by MS. The raw droplet trace of the plate is captured in Figure 5A. For a total of ∼400 droplets, the entire assay time is 130 s, corresponding to the analysis rate of 3 Hz, whereas the HPLC-MS assay has a throughput of 4 min/sample. Because the substrate ketone has a very low ionization efficiency on the MS, only the product β-leucine is used to evaluate the activities of various genes. After the data analysis, the fold improvement of each gene is calculated by normalizing the β-leucine intensity to the positive control. Figure 5B clearly shows that HPLC-MS and droplet–MS produce very similar results in terms of fold improvement for each variant and the hits identification. The high correlation (r2 = 0.95) between the two data sets validates the reliability of the droplet–MS approach, and importantly, is 700× faster than the LC–MS method.
Scheme 2. Formation of β-Leucine from Ketoester.
Figure 5.
A 96-well plate filled with 84 variants of a transaminase was screened for the reaction in Scheme 2. Each variant was sampled 4 times. Droplet size: 50 nL. Droplet infusing rate: 20 μL/min. No sheath flow was used. Assay throughput was 3 droplets/s (3 Hz). (A) Droplet trace of raw screening data. Inset is the zoomed in region of 0.2–0.5 min. (B) Comparison of the fold improvement of 96 samples from the droplet–MS method and LC–MS method. (C) Correlations between droplet–MS data and LC–MS data.
Transaminase ATA-117 Screening
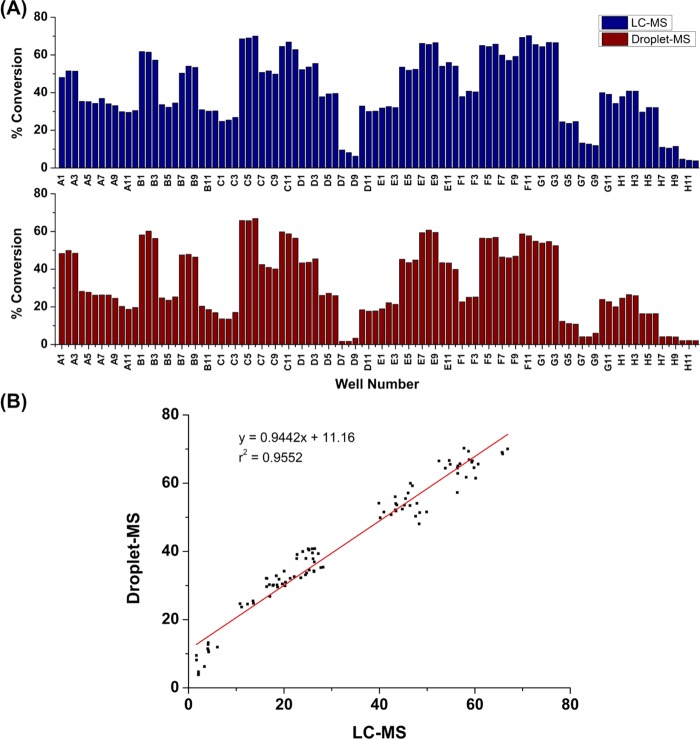
To further establish the robustness of the optimized droplet–MS method for analyzing the pharmaceutical protein engineering samples, we screen a transaminase hit plate from an earlier evolution project, as shown in Scheme 3. Previously, transaminase ATA-117 undergoes two rounds of evolution to convert this 1-(3-(trifluoromethyl)-5,6-dihydro-[1,2,4]triazolo[4,3-a]pyrazin-7(8H)-yl)butane-1,3-dione (THTP-BDO) methyl ketone to amine, and this provides a collection of variants of improved activity (Moore et al. submitted). Thirty variants are mapped in triplicate on a 96-well plate, including the best variant from the initial round (wells H4–H6), the wild-type ATA-117 (wells H7–H9), and the negative control (well H10–H12). Reactions are run using THTP-BDO as previously described, and the screening results are obtained from both LC–MS and droplet–MS methods. Because both the substrate and the product have a high ionization efficiency, the conversion is calculated based on the signal of both. Figure 6A demonstrates the conversion data obtained from LC–MS and droplet–MS methods are equivalent regarding the relative activities among the variants. Figure 6B also confirms the good correlation (r2 ∼ 0.96) between the two sets of results. The primary difference is that screening this one plate takes 6 h using LC–MS, but it takes only 120 s to assay the same plate in quadruplicates with the droplet–MS method—again a 700× throughput upgrade.
Scheme 3. formation of Truncated Sitagliptin Amine.
Figure 6.
Screening results of a 96-well plate filled with 32 gene variants of ATA-117 for Scheme 3; each gene was placed in triplicate on the 96-well plate. Droplet size: 50 nL. Droplet infusing rate: 20 μL/min. No sheath flow was used. Assay throughput was 3 Hz. (A) Comparison of the % conversion results of these 96 samples from the droplet–MS method and LC–MS method. (B) Correlations between droplet–MS data and LC–MS data.
One-Step ivTT and Enzymatic Assay in Droplets
The two examples above indicate that the droplet–MS method can be used to save significant assay time when applied to industrial enzyme screening. In this event, the throughput-limiting step in the enzyme evolution process then shifts to protein expression and running the reaction. The traditional cell-based protein expression approach requires cell transformation, cell culturing, protein harvesting, and sample preparation requiring multiple days of effort. Alternatively, cell free protein synthesis (or ivTT) dramatically accelerates protein expression, as it only requires mixing of the template DNA with key reagents and incubation for 2 h.29−31 One major reason that ivTT has not been widely used is that the reagents are expensive relative to the traditional approach. We and others envision ivTT would find application in the droplet format, as the reagent consumption is only a few nanoliters per sample.32,33 We test in-droplet ivTT by performing the cell free synthesis of transaminase ATA-117 and the ketone/amine conversion using the synthesized ATA-117 in one step. All of the ivTT components, including the ivTT mixes, RNAse inhibitor, PLP, and DNA template, along with the reaction substrates pyridinyl amine and pyruvate (Scheme 1) are mixed together in a well plate, and then immediately (within 1.5 min) reformatted into the PFD-segmented droplets and stored in the Teflon tubing for incubation. Initially, significant droplet breakage inside the tubing is observed after only 30 min of incubation. These droplets break down further upon infusion into the MS. We hypothesize that the interfacial tension of the droplet and oil is weakened by the relatively high concentration of the complex components as compared to the previous diluted samples from transaminase screening plates. Typically, this is managed by adding surfactant to the carrier oil, and an MS friendly oil–surfactant system has been reported.34 After switching to a similar oil–surfactant system (HFE 7500 with 2% fluorosurfactant, a perfluoropolyether–poly(ethylene glycol) triblock co-polymer), the droplets are stable even after overnight incubation and remained stable when moving inside the tubing. The new oil–surfactant fluid provides abundant signal and very nice stability on the MS (Figure S3). Additionally, the ESI needle is changed to a 12 cm long 120/250 Teflon needle, which is directly inserted into the carrier tubing with wax seal, as shown in Figure 2C. Stable spray and good droplet traces are obtained with the help of the 30 μL/min sheath flow (Figure S3). The optimal sheath liquid is discovered to be 100% H2O, which matches the solvent composition for ivTT. Based on our data, the best practice is to select the same solvent for the sheath liquid as the sample.
With the new oil–surfactant system in place, the one-step ivTT and enzyme assay is revisited. An ivTT reaction designed to make ATA-117 is set up as described in Table S1. In a positive control reaction, we spiked in a small amount of the ATA-117 enzyme, and in the negative control, we omitted the DNA coding for the enzyme. Pyridinyl amine and pyruvate are used as substrates because the equilibrium lies heavily in favor of the pyridinyl ketone and alanine (Scheme 1) and therefore no additional enzymes for pulling the reaction forward are required. Figure 7 presents the measured product (ketone) and substrate (amine) signals from the three reactions incubated in droplets. The transaminase produced by ivTT is active, similar to that of the ATA-117 standard positive control, whereas omitting the DNA results in no reaction under identical conditions. This successful one-step study shows that the cell free transaminase synthesis and transaminase reaction can be performed in one step for an overnight incubation (∼14 h). The one-step study is unaffected by the new oil–surfactant system, this system is effective at maintaining individual droplets without carryover, and the MS is capable of analyzing complex ivTT reactions without an additional sample preparation. This allows for taking advantage of the tiny volume of droplets to save considerable reagent cost. Additionally, the identification of the appropriate oil–surfactant system broadens the scope of droplet–MS screening setup, as samples no longer need to be confined to relatively clean, prepared sample plates,24 or buffer-switched reactions16 but can be employed as routine reaction vessels in a protein engineering process.
Figure 7.
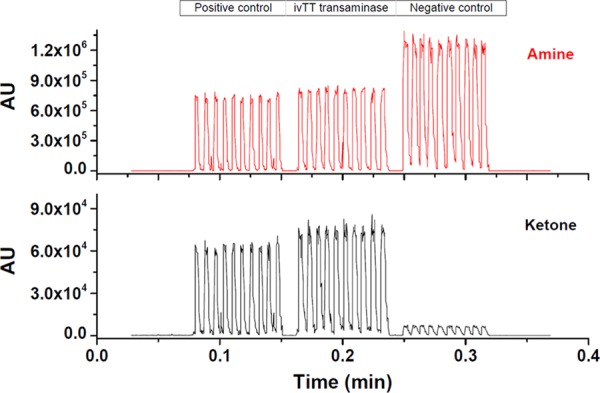
Droplet–MS analysis of one-step ivTT of transaminase and amine/ketone conversion (Scheme 1): ivTT reactions, positive and negative control reactions were performed with details described in Table S1. Each reaction was sampled 10 times. Teflon needle: 120/250. Droplet size: 50 nL. Droplet infusing rate: 15 μL/min. Sheath flow rate: 30 μL/min (100% H2O).
Conclusions
With the upgraded analysis rate, robustness, flexibility, and applicability, we demonstrated the droplet–MS methodology as an efficient, label-free, high-throughput screening technology for pharmaceutical biocatalysis. Utilizing an all-Teflon fluid path, the carryover was eliminated without losing signal stability and sensitivity. Escherichia coli expressed enzymes were screened using the droplet–MS platform following the standard sample preparation. Screening results of two types of transaminases by droplet–MS were in good agreement with the LC–MS method, but with significantly faster rate, validating the methodology as a viable high-throughput analytical technique for industrial biocatalyst screening. The adoption of the selected surfactant–oil carrier fluid alleviated the droplet instability caused by complex reaction components, at the same time sustaining a high-quality MS signal. The success of cell free synthesis of transaminase in nanoliter droplets suggested a great potential for accelerating the activity testing of DNA libraries in a round of protein engineering from 3–4 weeks to within 24 h at significant cost savings compared to traditional ivTT experiments.
Materials and Methods
Chemicals and Reagents
All of the enzyme libraries, lactate dehydrogenase (LDH), glucose dehydrogenase (GDH), and nicotinamide adenine dinucleotide (NAD) were from Codexis. Inc. (Redwood City, CA). PURExpress In Vitro Protein Synthesis Kit, RNAse inhibitor, and SOC outgrowth medium were from New England BioLabs (Ipswich, MA). Truncated sitagliptin ketone 1-(3-(trifluoromethyl)-5,6-dihydro-[1,2,4]triazolo[4,3-a]pyrazin-7(8H)-yl)butane-1,3-dione, abbreviated THTP-BDO, was from MSD.8 1-Pyridin-3-yl-ethylamine (pyridinyl amine) was purchased from AstaTech, Inc. (Bristol, PA). OmniCleave Endonuclease was purchased from Epicentre (Madison, WI). Teflon aerosols were from DuPont (Wilmington, DE). Luria-Bertani (LB) and Super broth cell culture media were from TEKnova (Hollister, CA). Kanamycin and IPTG were obtained from Thermo Scientific (Waltham, MA). All of the other chemicals were obtained from Sigma-Aldrich (St. Louis, MO) unless otherwise stated. All of the buffers were prepared using an ultrapure deionized water from the Milli-Q Water Purification System (EMD Millipore, Billerica, MA). The ultrapure nuclease free water for the ivTT work was from Invitrogen (Carlsbad, CA).
Droplet Generation From Multiwell Plates
The droplet generation system is depicted in Figure S1A. Fluorinated oil segmented droplets were generated based on the method described previously23 with a few optimizations. First, the reaction samples were diluted with acetonitrile (ACN) and H2O, both containing 0.1% formic acid to make the final ACN concentration ∼20%. The diluted sample solutions were filtered through a filter plate (0.45 μm filter, EMD Millipore, Billerica, MA) to remove the precipitates. The diluted samples were then loaded onto the treated multiwell plate (using Teflon aerosol). Next, this plate was placed in a custom three-dimensional-printed plate holder (Figure S1B) with raised edges around the plate to hold an extra layer of perfluorodecalin (PFD) oil. After the oil was placed on top of each sample and the whole plate, the sample droplets were sipped into a 250 μm i.d., 1600 μm o.d. (250/1600) carrier Teflon tubing (IDEX Health and Science, Oak Harbor, WA), which was connected to a 500 μL syringe (Hamilton Robotics, Reno, NV). The syringe was mounted on a PHD 2000 syringe pump (Harvard Apparatus, Holliston, MA) and set to withdraw at 2 μL/min. On the open inlet of the 250/1600 carrier Teflon tubing, a 2 cm long, 120 μm i.d., 250 μm o.d. (120/250) thin Teflon tubing (Zeus Industrial Products, Inc., Orangeburg, SC) was inserted in and sealed with capillary wax (Hampton Research, Aliso Viejo, CA) to function as a “sipper” (Figure 2A). Before the droplets generation, the syringe and the tubing were prefilled with PFD. To sample the whole plate into droplets in an array, a computer numerical control device (purchased from Zen Toolworks, Concord, CA, and custom assembled according to the provided instructions) was used as the XYZ positioner. The carrier Teflon tubing was mounted on the Z head and the XYZ positioner was programmed to reformat the desired number of droplets from screening plates with the desired size.
ESI-MS Detection of Sample Droplets
Before screening the enzymatic reaction samples, the droplet–MS conditions were optimized using pyridinyl amine and pyridinyl ketone standards (Scheme 1). Consequently, the amount of ketone and amine in each sample were measured to evaluate the activity of the transaminase. An Agilent MS-6120A (Santa Clara, CA) single-quadrupole mass spectrometer was used for droplet analysis. The regular ESI source with the stainless steel (SS) ESI needle was replaced with a CE–MS ESI source (Figure S1C,D), which has similar configuration as the traditional ESI source, but allows direct insertion of a 12 cm long, 150 μm i.d., 360 μm o.d. (150/360), or 120/250 thin Teflon tubing as the ESI needle and with the capability of introducing sheath flow to the spray. The entire fluid path is shown in Figure 2B,C. Once generation of droplets was finished, the small Teflon sipper was removed and the open end of the droplet carrier tubing was connected to the 150/360 Teflon ESI needle through a PEEK zero dead volume union (Valco Instruments Co. Inc., Houston, TX) or by the direct insertion of a 120/250 Teflon needle. For analysis, the same syringe pump was used to infuse the droplets into the ESI source at 15–20 μL/min. Positive ESI mode was used with voltage set at 3 kV. The nebulizing gas flow pressure was 35 psig, and the temperature of transferring capillary was 250 °C. Selected ion monitoring mode was used to measure the MS signals for the substrate and product from each reaction.
Droplet Data Analysis
Droplet traces were analyzed using ChemStation (Agilent, Santa Clara, CA). Absolute abundance (peak height) of the substrate and the product was correlated to the concentration. The peak height information of each droplet was exported to Excel (Microsoft Corporation, Redmond, WA). The list of peaks was automatically assigned back to each well on the 96-well plates using Excel based on the different oil spacing (reflected as different numbers of MS data points) within the replicates of each sample, between samples, and between rows. The averaged peak height of replicated droplets for each sample was used for calculation. The % conversion was calculated as the percentage of the peak height of the product over the sum of the peak heights of the product and the substrate. The fold improvement was calculated as the peak height of the product of each variant over that of the positive control sample. All of the calculations were performed with Excel.
Enzyme Variant Construction, Expression, Lysis, and Reaction
The ATA-036 transaminase variants were constructed by a single site-directed mutagenesis of a C-terminus 6xHis tag variant of the ATA-036 enzyme, a hit selected as a part of sitagliptin evolution work.8 To perturb the activity of the enzyme, 84 variants containing single mutations within 10 Å of the ATA binding pocket were selected. These variants were cloned into an expression vector containing a p15A-based replication origin, chloramphenicol antibiotic resistance marker, and an IPTG-inducible promoter.8 The final plasmids were transformed into an E. coli W3110 mutant.8 The enzyme variants, eight replicates of the positive control (ATA-036), and three replicates of a negative control (that expresses β-lactamase instead of ATA-036) were grown overnight at 30 °C and 200 rpm in a NUNC 96-well microplate filled with 160 μL LB media supplemented with 35 ng/μL chloramphenicol and 1% glucose. 10 μL cells from each well was then subcultured into 390 μL terrific broth (TB) media supplemented with 35 ng/μL chloramphenicol and 100 μM pyridoxine, and grown at 30 °C and 250 rpm. After 3 h, 1 mM IPTG was added and the cells were grown for another 18 h. The cells were harvested by centrifugations at 4000 rpm and the cell pellets were stored at −80 °C until ready for lysis. The cell lysis step was initiated by preparing a fresh lysis buffer containing 0.25 mg/mL lysozyme, 100 mM TEoA, pH 7.5, 0.2 mg/mL polymyxin B sulfate, and 100 μM pyridoxal-5-phosphate (PLP). 200 μL of the lysis buffer was added to cell pellets and the lysis reaction mixture was incubated for 2 h at room temperature and 1000 rpm. The lysis mixture was then centrifuged at 4000 rpm and 60 μL of the supernatant was added to 140 μL of a reaction master mix such that the final reaction contains 20 g/L methyl 4-methyl-3-oxopentanoate (ketoester, Scheme 2), 18 vol % DMSO, 50 vol % of a buffer composed of 0.2 M borate and 1.5 M iPrNH2, 1 g/L PLP, and 30 vol % ATA-036 lysate. The reaction was run overnight at 60 °C and 800 rpm then quenched by the addition of 200 μL of acetonitrile (ACN), followed by a 5-fold dilution with 10% ACN/H2O for the subsequent droplet–MS analysis.
To vary the activity of ATA-117, a library of 32 variants were selected from our previous study (Moore et al. submitted) cloned into a pD451 expression vector (ATUM, formerly DNA2.0) and the final plasmids were transformed into an E. coli BL21 (DE3) strain. Glycerol stocks of these variants were prepared by the addition of glycerol to overnight cultures of these variants in LB media supplemented with 50 ng/μL Kanamycin. To express this library, each variant was grown overnight in the LB-Kanamycin media at 37 °C. 10 μL from each sample was subcultured into 400 μL of Super broth (SB) media supplemented with 50 ng/μL Kanamycin. The mixture was incubated at 37 °C and 250 rpm for 3 h. Then, the protein expression was induced by the addition of 40 μL IPTG (10 mM). The induced cells were incubated at 37 °C, 250 rpm for 4 h. Finally, the cells were collected by centrifuging the culture at 4000 rpm for 10 min and discarding the supernatant. The cells were stored at −80 °C before the lysis step. The lysis buffer composed of 50 mM Tris–HCl (pH 8.0), 300 mM NaCl, 1 mg/mL lysozyme, and 25 U/μL endonuclease. 50 μL of the lysis solution was added to each sample, and the lysis mixture was incubated at 4 °C and 750 rpm. Finally, after centrifugation at 4000 rpm for 10 min, the supernatant containing the expressed enzyme was collected. A reaction stock solution containing 0.5 g/L PLP, 0.1 g/L lactate dehydrogenase (LDH), 0.5 g/L glucose dehydrogenase (GDH), 0.25 g/L NAD, 1 M d-alanine, 0.5 M glucose, 0.1 M Na2HPO4 (pH 7.0), and 10 mg/mL truncated sitagliptin ketone (Scheme 3) was prepared. Each reaction was set up by the addition of 10 μL cell lysate to 90 μL of the reaction stock. The final reaction mixture was incubated overnight at 30 °C and 450 rpm and then quenched by the addition of 100 μL ACN.
In Vitro Transcription–Translation (ivTT) Reaction in Droplets
For reactions of ivTT-synthesized transaminase with pyridinyl amine (Scheme 1), a reaction stock solution composed of 250 mM pyridinyl amine and 250 mM pyruvate was prepared before assembling the ivTT reaction. Cell free transaminase synthesis was performed using PURExpress in vitro protein synthesis kit. Two solutions, A and B, reconstituted from the purified components necessary for E. coli translation, were provided from the kit. Following the protocol for a 200 μL reaction, 80 μL of solution A, and 60 μL of solution B were added sequentially in a nuclease free microfuge tube placed on ice. Next, 4 μL RNAse inhibitor (40 000 units/mL) and 8 μL PLP (2.5 mM) were added to the mixture. Then, 36 μL of the nuclease free water and 12 μL plasmid DNA (TA-pD451, 300 ng/μL) were added into the mixture. After all of the ivTT components were added, 180 μL ivTT reaction solution was taken and added with 20 μL substrate stock solution. The positive control reaction contained the same components except that expressed ATA-117 standard replaced the plasmid DNA. The negative control contained neither ATA-117 standard nor its DNA, thus no conversion was expected (Table S1). The final mixtures of ivTT reaction, positive control, and the negative control were immediately sampled (∼1.5 min after mixing) into droplets and then stored in a 250/1600 Teflon tubing. Once sampling was finished, both ends of the tubing were sealed with capillary wax and placed in the 37 °C incubator overnight (∼14 h).
HPLC-MS Analysis
For the plate-based transaminase screening, the reactions on the 96-well plates were also analyzed with the Agilent HPLC-MS system as a comparison to the droplet–MS results. For Scheme 2 with ATA-036, after the sample preparation, the samples were injected onto a HPLC column (Zwix (−) 100 mm × 3 mm, 3 μm particle size) with a separation time of 4 min. Selected ion monitoring (SIM) signals of β-leucine (m/z 132) were measured. For Scheme 3 with ATA-117, the samples were injected onto the same column with a separation time of 3.5 min. Selected ion monitoring (SIM) signals of truncated sitagliptin ketone and amine (m/z 277 and m/z 278, respectively) were measured.
Acknowledgments
The authors are grateful to Dr. Stefan Lutz and his graduate student Leann Q. Teadt from Emory University for providing technical assistance on in vitro transcription–translation. We also thank Merck Research Laboratories (MRL) Post-doctoral Research Fellows Program for the financial support provided by a fellowship (X.W.D.) and thank MRL for making available of materials and instruments for this study.
Supporting Information Available
The Supporting Information is available free of charge on the ACS Publications website at DOI: 10.1021/acsomega.7b01973.
Droplet generation system (Figure S1), signal stability and linearity using Teflon ESI needle (Figure S2), evaluation of the impact of new oil–surfactant carrier fluid on MS signal (Figure S3), ivTT reaction conditions (Table S1) (PDF)
Author Present Address
∥ 3579 NW Paisley Ct., Beaverton, Oregon 97006, United States (X.W.D.).
The authors declare no competing financial interest.
Supplementary Material
References
- Hugentobler K. G.; Sharif H.; Rasparini M.; Heath R. S.; Turner N. J. Biocatalytic approaches to a key building block for the anti-thrombotic agent ticagrelor. Org. Biomol. Chem. 2016, 14, 8064–8067. 10.1039/c6ob01382a. [DOI] [PubMed] [Google Scholar]
- Porter J. L.; Rusli R. A.; Ollis D. L. Directed Evolution of Enzymes for Industrial Biocatalysis. ChemBioChem 2016, 17, 197–203. 10.1002/cbic.201500280. [DOI] [PubMed] [Google Scholar]
- Bornscheuer U. T.; Huisman G. W.; Kazlauskas R. J.; Lutz S.; Moore J. C.; Robins K. Engineering the third wave of biocatalysis. Nature 2012, 485, 185–194. 10.1038/nature11117. [DOI] [PubMed] [Google Scholar]
- Clouthier C. M.; Pelletier J. N. Expanding the organic toolbox: a guide to integrating biocatalysis in synthesis. Chem. Soc. Rev. 2012, 41, 1585–1605. 10.1039/c2cs15286j. [DOI] [PubMed] [Google Scholar]
- Gotor-Fernández V.; Brieva R.; Gotor V. Lipases: Useful biocatalysts for the preparation of pharmaceuticals. J. Mol. Catal. B: Enzym. 2006, 40, 111–120. 10.1016/j.molcatb.2006.02.010. [DOI] [Google Scholar]
- de Souza R. O. M. A.; Miranda L. S. M.; Bornscheuer U. T. A Retrosynthesis Approach for Biocatalysis in Organic Synthesis. Chem. - Eur. J. 2017, 23, 12040–12063. 10.1002/chem.201702235. [DOI] [PubMed] [Google Scholar]
- Panke S.; Held M.; Wubbolts M. Trends and innovations in industrial biocatalysis for the production of fine chemicals. Curr. Opin. Biotechnol. 2004, 15, 272–279. 10.1016/j.copbio.2004.06.011. [DOI] [PubMed] [Google Scholar]
- Savile C. K.; Janey J. M.; Mundorff E. C.; Moore J. C.; Tam S.; Jarvis W. R.; Colbeck J. C.; Krebber A.; Fleitz F. J.; Brands J.; Devine P. N.; Huisman G. W.; Hughes G. J. Biocatalytic Asymmetric Synthesis of Chiral Amines from Ketones Applied to Sitagliptin Manufacture. Science 2010, 329, 305–309. 10.1126/science.1188934. [DOI] [PubMed] [Google Scholar]
- Hammer S. C.; Knight A. M.; Arnold F. H. Design and evolution of enzymes for non-natural chemistry. Curr. Opin. Green Sustainable Chem. 2017, 7, 23–30. 10.1016/j.cogsc.2017.06.002. [DOI] [Google Scholar]
- Sun H.; Yeo W. L.; Lim Y. H.; Chew X. Y.; Smith D. J.; Xue B.; Chan K. P.; Robinson R. C.; Robins E. G.; Zhao H. M.; Ang E. L. Directed Evolution of a Fluorinase for Improved Fluorination Efficiency with a Non-native Substrate. Angew. Chem., Int. Ed. 2016, 55, 14277–14280. 10.1002/anie.201606722. [DOI] [PubMed] [Google Scholar]
- Jeschek M.; Reuter R.; Heinisch T.; Trindler C.; Klehr J.; Panke S.; Ward T. R. Directed evolution of artificial metalloenzymes for in vivo metathesis. Nature 2016, 537, 661. 10.1038/nature19114. [DOI] [PubMed] [Google Scholar]
- Obexer R.; Godina A.; Garrabou X.; Mittl P. R. E.; Baker D.; Griffiths A. D.; Hilvert D. Emergence of a catalytic tetrad during evolution of a highly active artificial aldolase. Nat. Chem. 2017, 9, 50–56. 10.1038/nchem.2596. [DOI] [PubMed] [Google Scholar]
- Denard C. A.; Ren H. Q.; Zhao H. M. Improving and repurposing biocatalysts via directed evolution. Curr. Opin. Chem. Biol. 2015, 25, 55–64. 10.1016/j.cbpa.2014.12.036. [DOI] [PubMed] [Google Scholar]
- Truppo M. D. Biocatalysis in the Pharmaceutical Industry: The Need for Speed. ACS Med. Chem. Lett. 2017, 8, 476–480. 10.1021/acsmedchemlett.7b00114. [DOI] [PMC free article] [PubMed] [Google Scholar]
- Agresti J. J.; Antipov E.; Abate A. R.; Ahn K.; Rowat A. C.; Baret J.-C.; Marquez M.; Klibanov A. M.; Griffiths A. D.; Weitz D. A. Ultrahigh-throughput screening in drop-based microfluidics for directed evolution. Proc. Natl. Acad. Sci. U.S.A. 2010, 107, 4004–4009. 10.1073/pnas.0910781107. [DOI] [PMC free article] [PubMed] [Google Scholar]
- Sun S.; Slaney T. R.; Kennedy R. T. Label Free Screening of Enzyme Inhibitors at Femtomole Scale Using Segmented Flow Electrospray Ionization Mass Spectrometry. Anal. Chem. 2012, 84, 5794–5800. 10.1021/ac3011389. [DOI] [PubMed] [Google Scholar]
- Sjostrom S. L.; Bai Y.; Huang M.; Liu Z.; Nielsen J.; Joensson H. N.; Svahn H. A. High-throughput screening for industrial enzyme production hosts by droplet microfluidics. Lab Chip 2014, 14, 806–813. 10.1039/C3LC51202A. [DOI] [PubMed] [Google Scholar]
- Mair P.; Gielen F.; Hollfelder F. Exploring sequence space in search of functional enzymes using microfluidic droplets. Curr. Opin. Chem. Biol. 2017, 37, 137–144. 10.1016/j.cbpa.2017.02.018. [DOI] [PubMed] [Google Scholar]
- Hibbert E. G.; Dalby P. A. Directed evolution strategies for improved enzymatic performance. Microb. Cell Fact. 2005, 4, 29 10.1186/1475-2859-4-29. [DOI] [PMC free article] [PubMed] [Google Scholar]
- Welch C. J.; Gong X. Y.; Schafer W.; Pratt E. C.; Brkovic T.; Pirzada Z.; Cuff J. F.; Kosjek B. MISER chromatography (multiple injections in a single experimental run): the chromatogram is the graph. Tetrahedron: Asymmetry 2010, 21, 1674–1681. 10.1016/j.tetasy.2010.05.029. [DOI] [Google Scholar]
- Zawatzky K.; Barhate C. L.; Regalado E. L.; Mann B. F.; Marshall N.; Moore J. C.; Welch C. J. Overcoming “speed limits” in high throughput chromatographic analysis. J. Chromatogr. A 2017, 1499, 211–216. 10.1016/j.chroma.2017.04.002. [DOI] [PubMed] [Google Scholar]
- Leveridge M.; Collier L.; Edge C.; Hardwicke P.; Leavens B.; Ratcliffe S.; Rees M.; Stasi L. P.; Nadin A.; Reith A. D. A High-Throughput Screen to Identify LRRK2 Kinase Inhibitors for the Treatment of Parkinson’s Disease Using RapidFire Mass Spectrometry. J. Biomol. Screening 2016, 21, 145–155. 10.1177/1087057115606707. [DOI] [PubMed] [Google Scholar]
- Sun S.; Kennedy R. T. Droplet Electrospray Ionization Mass Spectrometry for High Throughput Screening for Enzyme Inhibitors. Anal. Chem. 2014, 86, 9309–9314. 10.1021/ac502542z. [DOI] [PMC free article] [PubMed] [Google Scholar]
- Sun S.; Buer B. C.; Marsh E. N. G.; Kennedy R. T. A label-free Sirtuin 1 assay based on droplet-electrospray ionization mass spectrometry. Anal. Methods 2016, 8, 3458–3465. 10.1039/C6AY00698A. [DOI] [PMC free article] [PubMed] [Google Scholar]
- Haslam C.; Hellicar J.; Dunn A.; Fuetterer A.; Hardy N.; Marshall P.; Paape R.; Pemberton M.; Resemannand A.; Leveridge M. The Evolution of MALDI-TOF Mass Spectrometry toward Ultra-High-Throughput Screening: 1536-Well Format and Beyond. J. Biomol. Screening 2016, 21, 176–186. 10.1177/1087057115608605. [DOI] [PubMed] [Google Scholar]
- Heap R. E.; Hope A. G.; Pearson L. A.; Reyskens K.; McElroy S. P.; Hastie C. J.; Porter D. W.; Arthur J. S. C.; Gray D. W.; Trost M. Identifying Inhibitors of Inflammation: A Novel High-Throughput MALDI-TOF Screening Assay for Salt-Inducible Kinases (SIKs). SLAS Discovery 2017, 22, 1193–1202. 10.1177/2472555217717473. [DOI] [PMC free article] [PubMed] [Google Scholar]
- Si T.; Li B.; Comi T. J.; Wu Y. W.; Hu P. F.; Wu Y. Y.; Min Y. H.; Mitchell D. A.; Zhao H. M.; Sweedler J. V. Profiling of Microbial Colonies for High-Throughput Engineering of Multistep Enzymatic Reactions via Optically Guided Matrix-Assisted Laser Desorption/Ionization Mass Spectrometry. J. Am. Chem. Soc. 2017, 139, 12466–12473. 10.1021/jacs.7b04641. [DOI] [PMC free article] [PubMed] [Google Scholar]
- Guetschow E. D.; Kumar S.; Lombard D. B.; Kennedy R. T. Identification of sirtuin 5 inhibitors by ultrafast microchip electrophoresis using nanoliter volume samples. Anal. Bioanal. Chem. 2016, 408, 721–731. 10.1007/s00216-015-9206-0. [DOI] [PMC free article] [PubMed] [Google Scholar]
- Quertinmont L. T.; Orru R.; Lutz S. RApid Parallel Protein EvaluatoR (RAPPER), from gene to enzyme function in one day. Chem. Commun. 2015, 51, 122–124. 10.1039/C4CC08240K. [DOI] [PubMed] [Google Scholar]
- Daugherty A. B.; Govindarajan S.; Lutz S. Improved Biocatalysts from a Synthetic Circular Permutation Library of the Flavin-Dependent Oxidoreductase Old Yellow Enzyme. J. Am. Chem. Soc. 2013, 135, 14425–14432. 10.1021/ja4074886. [DOI] [PubMed] [Google Scholar]
- Quertinmont L. T.; Lutz S. Cell-free protein engineering of Old Yellow Enzyme 1 from Saccharomyces pastorianus. Tetrahedron 2016, 72, 7282–7287. 10.1016/j.tet.2016.01.007. [DOI] [Google Scholar]
- Saeki D.; Sugiura S.; Kanamori T.; Sato S.; Ichikawa S. Microcompartmentalized cell-free protein synthesis in semipermeable microcapsules composed of polyethylenimine-coated alginate. J. Biosci. Bioeng. 2014, 118, 199–204. 10.1016/j.jbiosc.2014.01.014. [DOI] [PubMed] [Google Scholar]
- Carlson E. D.; Gan R.; Hodgman C. E.; Jewett M. C. Cell-free protein synthesis: Applications come of age. Biotechnol. Adv. 2012, 30, 1185–1194. 10.1016/j.biotechadv.2011.09.016. [DOI] [PMC free article] [PubMed] [Google Scholar]
- Smith C. A.; Li X.; Mize T. H.; Sharpe T. D.; Graziani E. I.; Abell C.; Huck W. T. S. Sensitive, High Throughput Detection of Proteins in Individual, Surfactant-Stabilized Picoliter Droplets Using Nanoelectrospray Ionization Mass Spectrometry. Anal. Chem. 2013, 85, 3812–3816. 10.1021/ac400453t. [DOI] [PubMed] [Google Scholar]
Associated Data
This section collects any data citations, data availability statements, or supplementary materials included in this article.


