Abstract
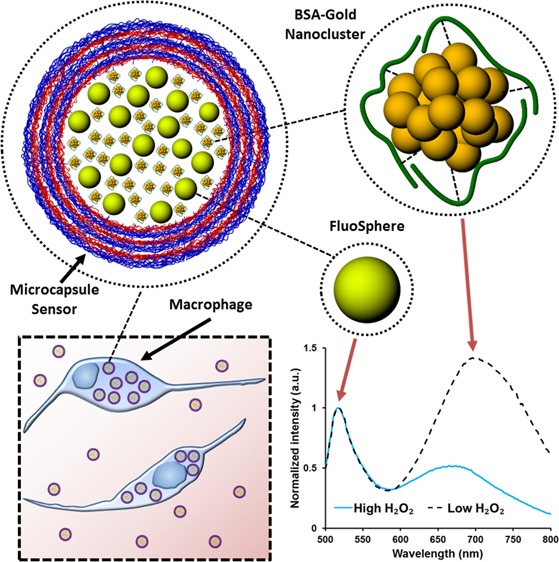
A new approach to sensing and imaging hydrogen peroxide (H2O2) was developed using microcapsule-based dual-emission ratiometric luminescent biosensors. Bovine serum albumin-capped gold nanoclusters (BSA-AuNCs) sensitive to H2O2 were coencapsulated with insensitive FluoSpheres (FSs) within polymeric capsules fabricated via the layer-by-layer method. Under single-wavelength excitation, the microcapsule-based biosensors exhibited emission bands at ∼516 and ∼682 nm resulting from the FSs and BSA-AuNCs, respectively. The polyelectrolyte multilayers lining the microcapsules were effective in protecting BSA-AuNCs from the degradation catalyzed by proteases (chymotrypsin, trypsin, papain, and proteinase K) and subsequent luminescent quenching, overcoming a key limitation of prior BSA-AuNC-based sensing systems. The luminescent response of the sensors was also found to be independent of local changes in pH (5–9). Quenching of the AuNCs in the presence of H2O2 enabled the spectroscopic quantification and imaging of changes in H2O2 concentration from 0 to 1 mM. The microcapsule sensors were easily phagocytized by murine macrophage cells (RAW 264.7), were effective as intracellular H2O2 imaging probes, and were successfully used to detect local release of H2O2 in response to an external chemical stimulus.
1. Introduction
Detection of hydrogen peroxide (H2O2) has received extensive attention due to its relevance in chemical, environmental, clinical, and biological applications.1,2 H2O2 is a reactive oxygen species and an important metabolite in living systems acting as a biomarker for oxidative stress and an indicator of cell damage.3,4 Over the years, it has also been established that H2O2 is of paramount importance for cellular signal transduction pathways.5,6 In mammals, H2O2 has been associated with triggering immune cell response cascades and remodeling injured vasculature.7 Physiological levels of H2O2 fluctuate in the micromolar range, and under pathological conditions, H2O2 concentrations may rise to millimolar levels.8,9 Additionally, H2O2 is released as a by-product of several enzymatic reactions, which enables the indirect detection of the reaction substrates by monitoring fluctuations in H2O2 levels.1,10 The multifaceted role of H2O2 in biochemical processes has motivated research to quantify and image cellular H2O2 concentrations using small-molecule fluorescent probes,8,11−14 nanoparticles,15−17 and recombinant fluorescent proteins.18−20
Gold nanoclusters (AuNCs) have emerged as a promising tool for biosensing and bioimaging applications owing to their high quantum yield, large Stokes shift, photo- and chemical stability, nanosize, and low toxicity.21−23 AuNCs are usually capped by a protein or chemical ligand to enhance the structural stability and photoluminescence characteristics.24,25 The bovine serum albumin (BSA)-mediated biomineralization technique to fabricate luminescent AuNCs entrapped within BSA (BSA-AuNCs) has gained popularity due to its moderately high quantum yield, long wavelength emission, surface modification capabilities, and facile synthesis using mild reaction conditions. The BSA scaffold covalently interacts with the AuNCs and provides steric shielding, enhancing the structural stability of the AuNCs that in turn engenders highly stable luminescence over a broad range of pH and salt concentrations.26 Prior studies have shown that the luminescence of BSA-AuNCs is sensitive to H2O2, potentially offering a cheaper and nontoxic alternative to commercially available H2O2 quantification systems (e.g., o-dianisidine, tetramethylbenzidine, and 2,2-azino-bis(3-ethylbenzothiazoline-6-sulphonicacid)). To further take advantage of H2O2-mediated quenching of BSA-AuNCs, a number of optical sensing assays for analytes including glucose, cholesterol, and acetylcholine have been developed by combining BSA-AuNCs and substrate-specific enzymes.27−29 However, protease-induced enzymatic degradation of the BSA scaffold can also affect the luminescence of BSA-AuNCs,30,31 which poses a problem for the use of BSA-AuNC-enabled sensors to detect small-molecule analytes (e.g., H2O2, glucose, lactate, etc.) in complex biological samples.
In this work, microcapsules containing BSA-AuNCs and FluoSpheres (FSs) are introduced as H2O2 sensors with two key features overcoming the limitations of nonencapsulated BSA-AuNCs: (1) the capsules protect the BSA-AuNCs from detrimental interactions with the external environment and (2) the incorporation of FSs with complementary emission spectra facilitates ratiometric luminescence intensity measurements. Micro- and nano-sized polymeric capsules fabricated with the layer-by-layer (LbL) method have been shown as effective carriers for optical indicators in biosensing applications32−34 due to the semipermeable nature of the polyelectrolyte multilayer (PEM) films. These LbL nanofilms physically confine the sensing reagents, allowing selective permeability of small molecules while excluding larger macromolecules and proteins.35−37 In this case, the capsules shield BSA-AuNCs from damaging proteases while permitting the free entry of the analyte (H2O2).
The photostable FSs are unaffected by changes in pH38 and therefore serve as a highly effective reference material when they are used in combination with BSA-AuNCs to monitor changes in H2O2. Such an intensity reference enables ratiometric measurements by reducing the influence of nonspecific effects on sensor response such as excitation source intensity fluctuations, variations in sensor concentration, and sample scattering; this is imperative for intensity-based in vivo and intracellular measurements where there are numerous interfering factors. There have been a few prior examples of BSA-AuNC-based ratiometric sensors that take advantage of intrinsic blue emission from oxidized BSA or emission from fluorescein-isothiocyanate (FITC) covalently tagging the amine groups of BSA.39−43 The FITC-tagged sensors exhibit strong pH sensitivity, potentially making them susceptible to errors in tracking H2O2 fluctuations. Herein, the response of the FS- and BSA-AuNC-containing microcapsule sensors to changes in H2O2 was evaluated and for the first time the use of these ratiometric microcapsule-based sensors to image H2O2 in murine RAW 264.7 macrophage cells was demonstrated.
2. Experimental Section
2.1. Chemicals
Sodium carbonate (Na2CO3), calcium chloride (CaCl2), BSA, α-chymotrypsin from bovine pancreas, trypsin from bovine pancreas, papain from papaya latex, proteinase K from Tritirachium album, gold(III) chloride trihydrate (HAuCl4·3H2O), hydrogen peroxide (H2O2), poly(sodium 4-styrenesulfonate) (PSS, average MW 70 000 Da), poly(diallyldimethylammonium chloride) (PDADMAC, average MW 100 000–200 000 Da), phorbol 12-myristate 13-acetate (PMA), poly(vinylsulfonic acid) (PVSA), Dulbecco’s modified Eagle’s medium (DMEM), fetal bovine serum (FBS), sodium hydroxide (NaOH), phosphate-buffered saline (PBS), buffer salts (NaHCO3, HEPES, CHES, and CH3COONa), and ethylenediaminetetraacetic acid (EDTA) were purchased from Sigma-Aldrich and used without further purification. Carboxylate-modified, 0.02 μm, yellow-green (505/515) FSs were obtained from Thermo Fisher Scientific.
2.2. Fabrication of H2O2-Sensing Polymeric Microcapsules
BSA-AuNCs were fabricated using the green one-pot synthesis method described elsewhere.26 Briefly, 1 mL of aqueous BSA (50 mg/mL), 1 mL of HAuCl4 (10 mM), and 100 μL of NaOH (1 M) were mixed and stirred moderately for 12 h at 37 °C. The resulting AuNC solution was mixed with FSs (0.78 nM) and 0.2 M Na2CO3 to obtain a final volume of 9 mL while maintaining the volume ratio 66:3:95. To the mixture, 9 mL of 0.16 M CaCl2 was added and allowed to react for 10 min at 25 °C while being stirred rapidly (800 rpm). PVSA (225 μL, 25 wt % in H2O) was also added to the mixture, 2 min after the start of the reaction. PEMs were coated onto the BSA-AuNC/FS-loaded CaCO3 microparticles as described elsewhere.37 Briefly, microparticles were alternately suspended in 2 mL of PDADMAC (20 mg/mL, pH 8) and PSS (20 mg/mL, pH 8) for 2 min, followed by centrifugation at 500g to remove excess polyelectrolytes. After each polyelectrolyte deposition step, the particles were resuspended in 2 mL of NaHCO3 (5 mM, pH 8) to get rid of loosely bound polyelectrolytes. This sequence of polyelectrolyte deposition and washing was repeated until 10 bilayers were deposited. To quantify the loading efficiency, a fraction of the cargo-loaded microparticles was exposed to EDTA (0.2 M, pH 7.2) to release encapsulated materials.32,44 The relative amount of BSA-AuNCs and FSs released (loading efficiency) was calculated by measuring the fluorescence intensity at 682 and 516 nm, respectively, when excited at 445 nm and using calibration curves obtained from known concentrations of BSA-AuNCs and FSs. Finally, hollow microcapsules were made by suspending the PEM-coated CaCO3 microparticles containing BSA-AuNCs/FSs in the EDTA solution (0.2 M, pH 7.2) for 1 h, followed by washing with NaHCO3 (5 mM, pH 8). The zeta potential was measured using a Malvern ZetaSizer Nano Series ZEN 3600 spectrometer.
2.3. Sensitivity of Sensors to Proteases and to pH Variation
Nonencapsulated BSA-AuNCs (10 μL from the prepared stock) or encapsulated BSA-AuNCs/FSs ratiometric sensors (made from 0.67 mg of LbL coated microparticles) were added to the protease solution (1 mg/mL in PBS) and incubated at 37 °C for 4 h. The control experiments were similarly conducted in the absence of proteases. The relative sensor response R/R0 was calculated, where R and R0 represent BSA-AuNC luminescence intensities in the presence and absence of proteases, respectively. To evaluate the sensitivity of the ratiometric sensors to pH, microcapsules were suspended in CH3COONa (5 mM, pH 5), HEPES (5 mM, pH 7), and CHES (5 mM, pH 9) for 2 h at 37 °C. Photoluminescence measurements were performed using Tecan Infinite M200 PRO with i-Control 1.8 software. Samples contained in black 96-well plates were excited at 445 nm to collect emission spectra from 500 to 800 nm.
2.4. Sample Preparation for Sensing H2O2
Microcapsule sensors fabricated by dissolving 0.67 mg of PEM-coated microparticles were incubated for 30 min at 37 °C in different concentrations of H2O2 (0–1000 μM, 100 μL). H2O2 solutions were prepared using PBS, and the photoluminescence response of the sensors at each H2O2 concentration was measured. The response time of the sensors when exposed to H2O2 was computed by evaluating the time required for the response ratio to drop by 63.2% from the initial ratio.45 The limit of detection (LOD) and maximum observable peroxide concentration (MOPC) were calculated by determining the H2O2 concentrations at R516/682(min) + 3σ and R516/682(max) – 3σ, respectively, where R516/682(min) is the sensor response at 0 μM H2O2, R516/682(max) is the sensor response at 1000 μM H2O2, and σ is the standard error of the response across three separate sensor batches. The analytical range was calculated as range = MOPC – LOD, and the sensor sensitivity was computed using the following equation: S = {[R516/682(max) – R516/682(min)]/R516/682(min) × 100}/range.
2.5. Cell Culture
Murine macrophage cells (RAW 264.7) were cultured in DMEM, containing high glucose concentration and 10% FBS. The cell cultures were split (1/6) twice a week. A day before incubating the cells with the microcapsule sensors, the cells were passaged and seeded at a density of 3 × 10⁴ cells/dish in 35 mm glass bottom dishes (Cellvis). For all sensor-response experiments, the cells were incubated at 37 °C and 5% CO2 with microcapsule sensors (fabricated from 6.7 mg of PEM-coated microparticles) for 1 h. However, the cells were incubated with the sensors for 24 h for the cell vitality assay analysis. Before imaging, all cells were moderately washed with PBS to remove unbound cells and excess microcapsule sensors. PMA (1 mg/mL stock) and H2O2 (10 mM stock) were directly added to cell culture media and incubated for 30 min before imaging. For cell vitality assay experiments, the cells were incubated with 3 mL of PBS containing calcein AM (2 μM) and ethidium homodimer (1 μM) for 15 min.
2.6. Confocal Imaging
All confocal and differential interference contrast (DIC) images of samples were obtained using an inverted microscope (Olympus IX81) having a spinning disk confocal unit (Yokogawa CSU-X1) and attached to an iXon897 electron-multiplying charge-coupled device camera (Andor Technology). For confocal imaging, samples were viewed with a 40× oil immersion objective (1.3 NA) and excited using a 445 nm laser. Fluorescence images of FSs and BSA-AuNCs were captured using 525/15 nm band-pass and 633 nm long-pass emission filters, respectively. To image the response of microcapsule sensors to varying concentrations of H2O2, 10 μL of the microcapsule suspension was dropped on a cover slip for imaging. Confocal images of macrophages were obtained directly in glass bottom dishes. The mean luminescence intensity values were calculated from the images of the FSs and BSA-AuNC emission channels; sensor response ratios were generated by dividing the FS mean intensity by the BSA-AuNC average intensity values. Pseudocolored images were obtained by dividing the FSs pixel intensities by the BSA-AuNCs pixel intensities. All images were analyzed using ImageJ software. Sensor parameters were calculated from mean sensor intensity ratios.
3. Results and Discussion
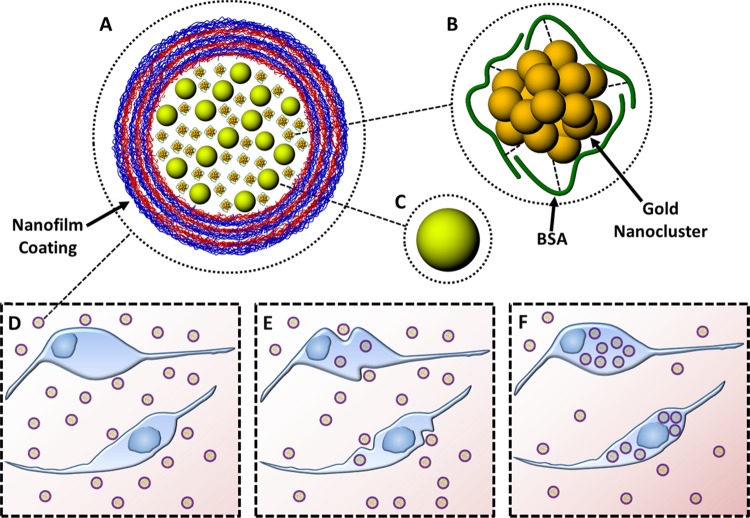
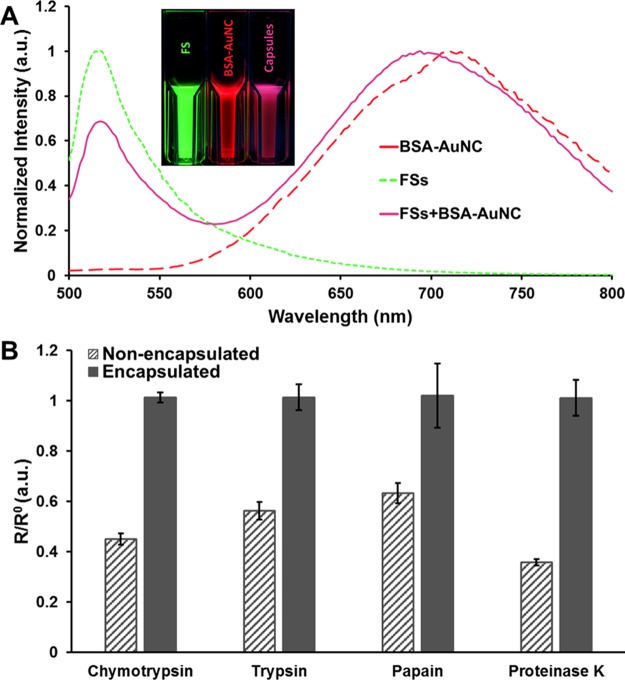
Microcapsule-based ratiometric hydrogen peroxide sensors (Scheme 1A) were fabricated by coecapsulating H2O2 sensitive BSA-AuNCs (Scheme 1B) and H2O2-insensitive FSs (Scheme 1C). These materials have spectrally separate emission spectra but overlapping excitation spectra,26,38 which enables the use of a single excitation source to simultaneously excite both materials and generate dual emission. Figure 1A depicts the individual emission spectra of the FSs and the BSA-AuNCs along with the emission spectra of the microcapsule sensors containing both the FSs and the BSA-AuNCs. When excited at 445 nm the microcapsule sensors exhibited dual emission with peaks centered at 516 and 682 nm, which are similar to those observed when illuminating FSs and AuNCs separately. The loading efficiency of BSA-AuNCs and FSs was estimated to be ∼53 and ∼20%, respectively; proteins (BSA) act as additives during the nucleation process and are more readily adsorbed onto the surface of the primary nanocrystallites that ultimately combine to form the highly porous CaCO3 microstructure, resulting in higher encapsulation.46 As estimated from analysis of confocal images (Figure S1), the mean diameter of the microcapsule sensors was ∼7 μm. Furthermore, the number of FSs and BSA-AuNCs in each microcapsule was assessed to be 2 × 10¹⁰ and 7.18 × 10⁸ respectively. When suspended in buffer solution (0.01 M NaHCO3, pH 8) the microcapsule sensors were well dispersed and showed no visible signs of aggregation; zeta potential measurement revealed that the PEM-coated microcapsules had a high surface charge (−70.3 ± 1.4 mV) corroborating their colloidal stability.
Scheme 1. (A) Microcapsule-Based Hydrogen Peroxide Sensor, (B) BSA-AuNC, (C) FS, (D) Microcapsule Sensors Incubated with Macrophages, (E) Microcapsule Sensors Being Engulfed by Macrophages, and (F) Microcapsule Sensors Ingested by Macrophages.
Figure 1.
(A) Normalized emission spectra of FSs (green dashed line), BSA-AuNC (red dashed line), and microcapsules containing both FSs and BSA-AuNC (pink line), (Inset) photographs of luminescent FSs, BSA-AuNC, and microcapsules containing both FSs and BSA-AuNC suspended in solution under UV illumination, (B) plots of R/R0 of nonencapsulated BSA-AuNC (dark gray stripe) and encapsulated BSA-AuNC (dark gray solid) in the presence of proteases. Here R and R0 represent BSA-AuNC luminescence intensities in the presence and absence of proteases respectively. Error bars represent 95% confidence intervals for three separate batches of sensors.
Prior studies have demonstrated that degradation of the BSA shell via protease-catalyzed hydrolysis of peptide bonds decreases BSA-AuNC luminescence intensity,30,31 thereby rendering the sensors ineffective in reporting peroxide changes in the presence of proteases found in many biological systems. We hypothesized that protecting the BSA-AuNCs within LbL microcapsules would protect against this degradation and preserve function of the BSA-AuNC in peroxide response. The ability of PEMs to exclude damaging proteases and prevent quenching of the BSA-AuNCs was assessed by exposing the sensors to common proteases (chymotrypsin, trypsin, papain, and proteinase K). Nonencapsulated BSA-AuNCs showed ∼55, ∼44, ∼37, and ∼64% loss in luminescence when exposed to chymotrypsin, trypsin, papain, and proteinase K respectively (Figure 1B). In contrast, BSA-AuNCs encapsulated in PEM-lined microcapsules retained their luminescence intensities (∼100%) when exposed to the same proteases, (Figure 1B) indicating that PEMs exclude proteases and protect the luminescent reporters. Furthermore, we found no significant difference (p > 0.05) in luminescence of coecapsulated FSs and BSA-AuNCs when incubated in different pH (5, 7, 9) solutions (Figure 2); confirming that the coecapsulated FSs serve as a more robust reference material than pH-sensitive organic dyes such as FITC.
Figure 2.
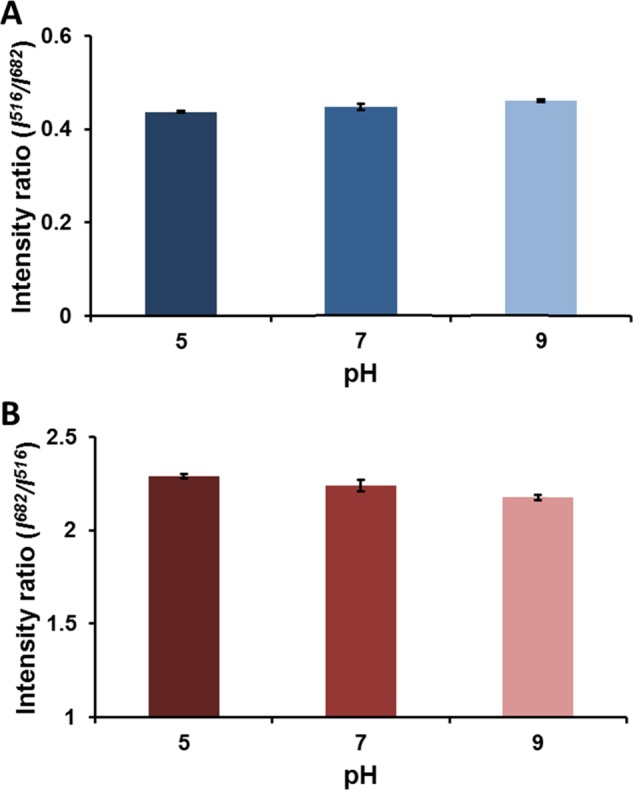
Ratiometric response of microcapsule sensors at different pH, normalized to (A) BSA-AuNC peak (682 nm) and (B) FSs peak (516 nm). Error bars represent 95% confidence intervals for three separate batches of microcapsule sensors.
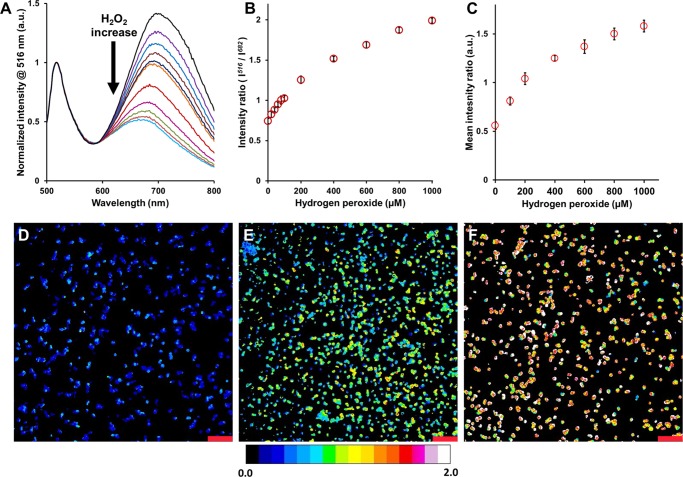
The microcapsule sensors responded rapidly to the exposure of H2O2, with a mean response time of ∼9 min. The change in response of the microcapsule sensors at varying concentrations of H2O2 was evaluated; as seen in Figure 3A an increase in H2O2 concentration decreased the emission of the BSA-AuNCs progressively, while the emission of the FSs remained relatively constant. By plotting the intensity ratios (I516/I682) against H2O2 concentrations (Figure 3B), two distinct linear regions in ranges 0–200 μM (R2 = 0.98) and 200–1000 μM (R2 = 0.98) were observed. These findings are similar to the quenching profiles reported previously for BSA-AuNCs.27,39 The average LOD, MOPC, analytical range, and sensitivity per unit range were ∼26.20 μM, ∼858.5 μM, ∼832.7 μM, and ∼0.2%/μM, respectively. Subsequently, these sensors were imaged using confocal microscopy at various H2O2 concentrations. Microcapsules were incubated in different H2O2 concentrations and were imaged to obtain average luminescence intensity ratios. Figure 3D–F shows the representative pseudocolored images of microcapsules at 0, 400, and 1000 μM H2O2, respectively. Figure 3D is predominantly blue, characteristic to a low mean intensity ratio (0.56 ± 0.04), whereas Figure 3F has a mixture of yellow-red microcapsules representing a higher mean ratio (1.58 ± 0.06) and Figure 3E has a green microcapsule population with an intermediate mean ratio (1.25 ± 0.03). By plotting the mean intensity ratios acquired from confocal imaging against H2O2 concentrations, a response curve (Figure 3C) analogous to that obtained using the plate reader was obtained. Similar to Figure 3B, Figure 3C reveals a ratiometric response with two separate linear regions spanning 0–200 μM (R2 = 0.99) and 200–1000 μM (R2 = 0.97). The average LOD, MOPC, analytical range, and sensitivity per unit range were found to be ∼34.90 μM, ∼619.8 μM, ∼584.9 μM, and ∼0.3%/μM, respectively; the differences between the calculated sensor parameters from the data acquired using spectrophotometry and confocal microscopy are ascribed to the differences in the optical setups used to collect data.
Figure 3.
(A) Emission spectra of microcapsules containing both FSs and BSA-AuNC to 0 μM (black), 20 μM (purple), 40 μM (blue), 60 μM (maroon), 80 μM (navy blue), 100 μM (orange), 200 μM (bright red), 400 μM (pink), 600 μM (green), 800 μM (red), and 1000 μM hydrogen peroxide (light blue); mean ratiometric response of microcapsules containing both FSs and BSA-AuNC to varying concentrations of hydrogen peroxide (B) obtained using a microplate spectrophotometer and (C) obtained using ratiometric images of microcapsules. Confocal, ratiometric fluorescence images of microcapsules containing both FSs and BSA-AuNC at (D) 0 μM, (E) 400 μM, and (F) 1000 μM hydrogen peroxide. Pseudocolored images represent the ratio of emission intensities collected using a 510–540 nm band-pass filter and a 633 nm long-pass filter, when excited at 445 nm. The scale bars correspond to 20 μm. The error bars represent 95% confidence intervals for at least three separate samples of microcapsule sensors.
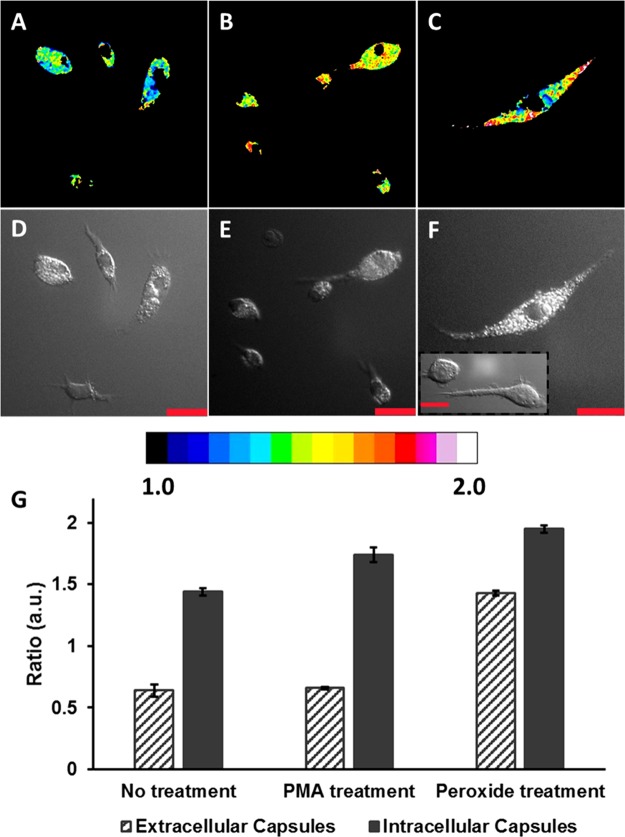
Next, the microcapsule-based H2O2 sensors were used to obtain ratiometric luminescent images of biological specimens. Confocal and DIC images of RAW 264.7 macrophages incubated with microcapsule sensors for 1 h indicated that the microcapsules were rapidly and effectively ingested by the cells (Figure 4A–F). In comparison with macrophages that had not been incubated with microcapsules (Figure 4F inset), the microcapsule-containing macrophages appear to be granular when viewed using DIC; this is ascribed to local optical-path gradients introduced by the internalized microcapsules. Using standard cell vitality assays, it was confirmed that the viability of the cells was unaltered after microcapsule ingestion (Figure S2). The mean intensity ratio (Figure 4G) of the microcapsules ingested by the cells (Figure 4A) was estimated to be 125% more than the ratio of the microcapsules that were not ingested (Figure S3B) but present in the vicinity of the macrophages. The increase in the ratio is attributed to the inherent H2O2 release by the macrophages to degrade the phagocytosed foreign materials. Treatment of the microcapsule-loaded cells with 500 μM H2O2 (Figure 4B) served as a positive control and triggered an increase in the ratio (Figure 4G) of both the microcapsules inside the cells and the microcapsules present outside (Figure S3D). The response of the extracellular microcapsules increased by 123%, whereas the sensor response of the phagocytosed microcapsules increased by 35%. To further demonstrate the feasibility of the microcapsule-based sensors to detect endogenous release of H2O2 in response to stimulants, the sensor-loaded cells were imaged after the cells were stimulated with PMA (Figure 4C). The response (Figure 4G) of the microcapsules outside the cells (Figure S3F) was almost unaltered, whereas the response of the sensors inside the cells increased by 21%. This provides strong evidence that the macrophages release endogenous H2O2 in response to the PMA stimulus, as reported by the internalized sensors, whereas the external sensors did not respond. These results demonstrate the benefit of the BSA-AuNC microcapsule ratiometric sensors for imaging physiological H2O2 and detecting endogenous bursts of H2O2.
Figure 4.
Confocal fluorescence images of RAW 264.7 macrophage cells. The pseudocolored images represent the ratio of emission intensities collected using a 510–540 nm band-pass filter and a 633 nm long-pass filter, when excited at 445 nm. (A) Cells incubated with microcapsules for 1 h at 37 °C, (B) microcapsule-loaded cells after PMA (2 μg/mL) exposure for 30 min at 37 °C, and (C) microcapsule-loaded cells after H2O2 (500 μM) exposure for 30 min at 37 °C. (D–F) DIC images of the cells in (A)–(C), respectively. The scale bars correspond to 30 μm. (G) Ratiometric response of extracellular (dark gray stripes) and intracellular (dark gray solid) microcapsule sensors. The error bars represent 95% confidence intervals for three separate batches of microcapsule sensors.
These sensing systems may be useful for studying cell-signaling mechanisms in live cells. However, it is important to appreciate that internalization of microcapsules will depend, to a degree, on the external surface charge they present as well as the specific cells involved. Therefore, it is worth noting that these microcapsules are highly tailorable; the types of polyelectrolytes used and the conditions (e.g., pH, ionic strength) used during fabrication can easily alter capsule properties. For example, if the intended application mandates a positive surface charge, the surface charge of our capsules can be easily changed to positive by switching the outer layer to a cationic polyelectrolyte (e.g., PDADMAC, poly(allylamine)).
4. Conclusions
A method to fabricate polymeric microcapsule-based ratiometric H2O2 sensors was demonstrated using a combination of BSA-AuNCs and a reference fluorescent nanoparticle. The change in H2O2 within living macrophage cells was visualized, and intracellular H2O2 fluctuations in response to external stimuli were detected. Given the excellent sensitivity and wide range of response, these sensors may be potentially used to study cellular signaling pathways that involve low levels of H2O2 generation. The microcapsules offer an inexpensive and nontoxic method for direct H2O2 detection, in applications that involve complex biological samples. Ratiometric sensing facilitates reliable measurements, and the semipermeable nature of the LbL microcapsule walls protects the BSA-AuNCs from catalytic enzymes and nonspecifically binding macromolecules. Additionally, it is noteworthy that BSA-AuNCs have also been used for environmental monitoring of hazardous materials (e.g., Hg2+, cyanide)42,47,48 and for developing enzymatic assays that detect other analytes (e.g., glucose, lactate, and choline); thus, the ratiometric microcapsule-based platform may also be advantageous for use in similar applications. In future, we will focus on using these nanomaterial systems as tools to examine endogenous levels of analytes (e.g., H2O2, glucose, and lactate) in biological samples and living systems.
Acknowledgments
This work was supported by the National Science Foundation (nos. 1258696, 1066928, and 1403002). We acknowledge Drs. Luis Rene Garcia and Wayne Versaw for allowing us access to the Olympus IX81.
Supporting Information Available
The Supporting Information is available free of charge on the ACS Publications website at DOI: 10.1021/acsomega.7b00199.
DIC and confocal, fluorescence images of FS/BSA-AuNC-containing microcapsules at 0 μM H2O2; vitality assay of RAW 264.7 macrophages; ratiometric fluorescence images of RAW 264.7 macrophage cells incubated with microcapsules (PDF)
Author Contributions
⊥ S.B. and E.V.G. contributed equally.
The authors declare no competing financial interest.
Supplementary Material
References
- Chen W.; Cai S.; Ren Q.-Q.; Wen W.; Zhao Y.-D. Recent advances in electrochemical sensing for hydrogen peroxide: a review. Analyst 2012, 137, 49–58. 10.1039/c1an15738h. [DOI] [PubMed] [Google Scholar]
- Grisham M. B. Methods to detect hydrogen peroxide in living cells: Possibilities and pitfalls. Comp. Biochem. Physiol., Part A: Mol. Integr. Physiol. 2013, 165, 429–438. 10.1016/j.cbpa.2013.02.003. [DOI] [PubMed] [Google Scholar]
- Finkel T.; Holbrook N. J. Oxidants, oxidative stress and the biology of ageing. Nature 2000, 408, 239–247. 10.1038/35041687. [DOI] [PubMed] [Google Scholar]
- Lippert A. R.; Van de Bittner G. C.; Chang C. J. Boronate Oxidation as a Bioorthogonal Reaction Approach for Studying the Chemistry of Hydrogen Peroxide in Living Systems. Acc. Chem. Res. 2011, 44, 793–804. 10.1021/ar200126t. [DOI] [PMC free article] [PubMed] [Google Scholar]
- Veal E. A.; Day A. M.; Morgan B. A. Hydrogen Peroxide Sensing and Signaling. Mol. Cell 2007, 26, 1–14. 10.1016/j.molcel.2007.03.016. [DOI] [PubMed] [Google Scholar]
- Rhee S. G. H2O2, a Necessary Evil for Cell Signaling. Science 2006, 312, 1882–1883. 10.1126/science.1130481. [DOI] [PubMed] [Google Scholar]
- Geiszt M.; Leto T. L. The Nox Family of NAD(P)H Oxidases: Host Defense and Beyond. J. Biol. Chem. 2004, 279, 51715–51718. 10.1074/jbc.R400024200. [DOI] [PubMed] [Google Scholar]
- Chang M. C. Y.; Pralle A.; Isacoff E. Y.; Chang C. J. A Selective, Cell-Permeable Optical Probe for Hydrogen Peroxide in Living Cells. J. Am. Chem. Soc. 2004, 126, 15392–15393. 10.1021/ja0441716. [DOI] [PMC free article] [PubMed] [Google Scholar]
- Luo Y.; Liu H.; Rui Q.; Tian Y. Detection of extracellular H2O2 released from human liver cancer cells based on TiO2 nanoneedles with enhanced electron transfer of cytochrome c. Anal. Chem. 2009, 81, 3035–3041. 10.1021/ac802721x. [DOI] [PubMed] [Google Scholar]
- Chen S.; Yuan R.; Chai Y.; Hu F. Electrochemical sensing of hydrogen peroxide using metal nanoparticles: a review. Microchim. Acta 2013, 180, 15–32. 10.1007/s00604-012-0904-4. [DOI] [Google Scholar]
- Srikun D.; Miller E. W.; Domaille D. W.; Chang C. J. An ICT-Based Approach to Ratiometric Fluorescence Imaging of Hydrogen Peroxide Produced in Living Cells. J. Am. Chem. Soc. 2008, 130, 4596–4597. 10.1021/ja711480f. [DOI] [PubMed] [Google Scholar]
- Miller E. W.; Tulyathan O.; Isacoff E. Y.; Chang C. J. Molecular imaging of hydrogen peroxide produced for cell signaling. Nat. Chem. Biol. 2007, 3, 263–267. 10.1038/nchembio871. [DOI] [PubMed] [Google Scholar]
- Miller E. W.; Albers A. E.; Pralle A.; Isacoff E. Y.; Chang C. J. Boronate-Based Fluorescent Probes for Imaging Cellular Hydrogen Peroxide. J. Am. Chem. Soc. 2005, 127, 16652–16659. 10.1021/ja054474f. [DOI] [PMC free article] [PubMed] [Google Scholar]
- Warren E. A. K.; Netterfield T. S.; Sarkar S.; Kemp M. L.; Payne C. K. Spatially-resolved intracellular sensing of hydrogen peroxide in living cells. Sci. Rep. 2015, 5, 16929 10.1038/srep16929. [DOI] [PMC free article] [PubMed] [Google Scholar]
- Jin H.; Heller D. A.; Kalbacova M.; Kim J.-H.; Zhang J.; Boghossian A. A.; Maheshri N.; Strano M. S. Detection of single-molecule H2O2 signalling from epidermal growth factor receptor using fluorescent single-walled carbon nanotubes. Nat. Nanotechnol. 2010, 5, 302–309. 10.1038/nnano.2010.24. [DOI] [PMC free article] [PubMed] [Google Scholar]
- Kim J.-H.; Patra C. R.; Arkalgud J. R.; Boghossian A. A.; Zhang J.; Han J.-H.; Reuel N. F.; Ahn J.-H.; Mukhopadhyay D.; Strano M. S. Single-molecule detection of H2O2 mediating angiogenic redox signaling on fluorescent single-walled carbon nanotube array. ACS Nano 2011, 5, 7848–7857. 10.1021/nn201904t. [DOI] [PMC free article] [PubMed] [Google Scholar]
- Heller D. A.; Jin H.; Martinez B. M.; Patel D.; Miller B. M.; Yeung T.-K.; Jena P. V.; Höbartner C.; Ha T.; Silverman S. K.; Strano M. S. Multimodal optical sensing and analyte specificity using single-walled carbon nanotubes. Nat. Nanotechnol. 2009, 4, 114–120. 10.1038/nnano.2008.369. [DOI] [PubMed] [Google Scholar]
- Malinouski M.; Zhou Y.; Belousov V. V.; Hatfield D. L.; Gladyshev V. N. Hydrogen peroxide probes directed to different cellular compartments. PLoS One 2011, 6, e14564 10.1371/journal.pone.0014564. [DOI] [PMC free article] [PubMed] [Google Scholar]
- Belousov V. V.; Fradkov A. F.; Lukyanov K. A.; Staroverov D. B.; Shakhbazov K. S.; Terskikh A. V.; Lukyanov S. Genetically encoded fluorescent indicator for intracellular hydrogen peroxide. Nat. Methods 2006, 3, 281–286. 10.1038/nmeth866. [DOI] [PubMed] [Google Scholar]
- Dooley C. T.; Dore T. M.; Hanson G. T.; Jackson W. C.; Remington S. J.; Tsien R. Y. Imaging dynamic redox changes in mammalian cells with green fluorescent protein indicators. J. Biol. Chem. 2004, 279, 22284–22293. 10.1074/jbc.M312847200. [DOI] [PubMed] [Google Scholar]
- Abrams M. J.; Murrer B. Metal compounds in therapy and diagnosis. Science 1993, 261, 725–730. 10.1126/science.8102010. [DOI] [PubMed] [Google Scholar]
- Zhang X.-D.; Luo Z.; Chen J.; Song S.; Yuan X.; Shen X.; Wang H.; Sun Y.; Gao K.; Zhang L.; Fan S.; Leong D. T.; Guo M.; Xie J. Ultrasmall Glutathione-Protected Gold Nanoclusters as Next Generation Radiotherapy Sensitizers with High Tumor Uptake and High Renal Clearance. Sci. Rep. 2015, 5, 8669 10.1038/srep08669. [DOI] [PMC free article] [PubMed] [Google Scholar]
- Chen L.-Y.; Wang C.-W.; Yuan Z.; Chang H.-T. Fluorescent gold nanoclusters: recent advances in sensing and imaging. Anal. Chem. 2015, 87, 216–229. 10.1021/ac503636j. [DOI] [PubMed] [Google Scholar]
- Wang G.; Huang T.; Murray R. W.; Menard L.; Nuzzo R. G. Near-IR Luminescence of Monolayer-Protected Metal Clusters. J. Am. Chem. Soc. 2005, 127, 812–813. 10.1021/ja0452471. [DOI] [PubMed] [Google Scholar]
- Wu Z.; Jin R. On the Ligand’s Role in the Fluorescence of Gold Nanoclusters. Nano Lett. 2010, 10, 2568–2573. 10.1021/nl101225f. [DOI] [PubMed] [Google Scholar]
- Xie J.; Zheng Y.; Ying J. Y. Protein-Directed Synthesis of Highly Fluorescent Gold Nanoclusters. J. Am. Chem. Soc. 2009, 131, 888–889. 10.1021/ja806804u. [DOI] [PubMed] [Google Scholar]
- Jin L.; Shang L.; Guo S.; Fang Y.; Wen D.; Wang L.; Yin J.; Dong S. Biomolecule-stabilized Au nanoclusters as a fluorescence probe for sensitive detection of glucose. Biosens. Bioelectron. 2011, 26, 1965–1969. 10.1016/j.bios.2010.08.019. [DOI] [PubMed] [Google Scholar]
- Chen X.; Baker G. A. Cholesterol determination using protein-templated fluorescent gold nanocluster probes. Analyst 2013, 138, 7299–7302. 10.1039/c3an01548c. [DOI] [PubMed] [Google Scholar]
- Li H.; Guo Y.; Xiao L.; Chen B. A fluorometric biosensor based on H2O2-sensitive nanoclusters for the detection of acetylcholine. Biosens. Bioelectron. 2014, 59, 289–292. 10.1016/j.bios.2014.03.054. [DOI] [PubMed] [Google Scholar]
- Hu L.; Han S.; Parveen S.; Yuan Y.; Zhang L.; Xu G. Highly sensitive fluorescent detection of trypsin based on BSA-stabilized gold nanoclusters. Biosens. Bioelectron. 2012, 32, 297–299. 10.1016/j.bios.2011.12.007. [DOI] [PubMed] [Google Scholar]
- Wang Y.; Wang Y.; Zhou F.; Kim P.; Xia Y. Protein-protected Au clusters as a new class of nanoscale biosensor for label-free fluorescence detection of proteases. Small 2012, 8, 3769–3773. 10.1002/smll.201201983. [DOI] [PMC free article] [PubMed] [Google Scholar]
- Biswas A.; Nagaraja A. T.; McShane M. J. Fabrication of Nanocapsule Carriers from Multilayer-Coated Vaterite Calcium Carbonate Nanoparticles. ACS Appl. Mater. Interfaces 2014, 6, 21193–21201. 10.1021/am5061195. [DOI] [PubMed] [Google Scholar]
- McShane M. J.; Brown J.; Guice K. B.; Lvov Y. M. Polyelectrolyte microshells as carriers for fluorescent sensors: loading and sensing properties of a ruthenium-based oxygen indicator. J. Nanosci. Nanotechnol. 2002, 2, 411–416. 10.1166/jnn.2002.118. [DOI] [PubMed] [Google Scholar]
- Tong W.; Song X.; Gao C. Layer-by-layer assembly of microcapsules and their biomedical applications. Chem. Soc. Rev. 2012, 41, 6103–6124. 10.1039/c2cs35088b. [DOI] [PubMed] [Google Scholar]
- McShane M.; Ritter D. Microcapsules as optical biosensors. J. Mater. Chem. 2010, 20, 8189–8193. 10.1039/c0jm01251c. [DOI] [Google Scholar]
- Shchukin D. G.; Shutava T.; Shchukina E.; Sukhorukov G. B.; Lvov Y. M. Modified Polyelectrolyte Microcapsules as Smart Defense Systems. Chem. Mater. 2004, 16, 3446–3451. 10.1021/cm049506x. [DOI] [Google Scholar]
- Biswas A.; Nagaraja A. T.; You Y.-H.; Roberts J. R.; McShane M. J. Cross-linked nanofilms for tunable permeability control in a composite microdomain system. RSC Adv. 2016, 6, 71781–71790. 10.1039/C6RA13507B. [DOI] [Google Scholar]
- Spence M. T.; Johnson I. D.. The Molecular Probes Handbook: A Guide to Fluorescent Probes and Labeling Technologies; Live Technologies Corporation, 2010. [Google Scholar]
- Ke C.-Y.; Wu Y.-T.; Tseng W.-L. Fluorescein-5-isothiocyanate-conjugated protein-directed synthesis of gold nanoclusters for fluorescent ratiometric sensing of an enzyme–substrate system. Biosens. Bioelectron. 2015, 69, 46–53. 10.1016/j.bios.2015.02.002. [DOI] [PubMed] [Google Scholar]
- Ding C.; Tian Y. Gold nanocluster-based fluorescence biosensor for targeted imaging in cancer cells and ratiometric determination of intracellular pH. Biosens. Bioelectron. 2015, 65, 183–190. 10.1016/j.bios.2014.10.034. [DOI] [PubMed] [Google Scholar]
- Wu Y.-T.; Shanmugam C.; Tseng W.-B.; Hiseh M.-M.; Tseng W.-L. A gold nanocluster-based fluorescent probe for simultaneous pH and temperature sensing and its application to cellular imaging and logic gates. Nanoscale 2016, 8, 11210–11216. 10.1039/C6NR02341J. [DOI] [PubMed] [Google Scholar]
- Hofmann C. M.; Essner J. B.; Baker G. A.; Baker S. N. Protein-templated gold nanoclusters sequestered within sol–gel thin films for the selective and ratiometric luminescence recognition of Hg 2+. Nanoscale 2014, 6, 5425–5431. 10.1039/c4nr00610k. [DOI] [PubMed] [Google Scholar]
- Wang M.; Mei Q.; Zhang K.; Zhang Z. Protein-gold nanoclusters for identification of amino acids by metal ions modulated ratiometric fluorescence. Analyst 2012, 137, 1618–1623. 10.1039/c2an16302k. [DOI] [PubMed] [Google Scholar]
- Fernández A.; Vendrell M. Smart fluorescent probes for imaging macrophage activity. Chem. Soc. Rev. 2016, 45, 1182–1196. 10.1039/C5CS00567A. [DOI] [PubMed] [Google Scholar]
- Fu K.; Chen S.; Zhao J.; Willis B. G. Dielectrophoretic Assembly of Gold Nanoparticles in Nanoscale Junctions for Rapid, Miniature Chemiresistor Vapor Sensors. ACS Sens. 2016, 1, 444–450. 10.1021/acssensors.6b00041. [DOI] [Google Scholar]
- Petrov A. I.; Volodkin D. V.; Sukhorukov G. B. Protein—Calcium Carbonate Coprecipitation: A Tool for Protein Encapsulation. Biotechnol. Prog. 2005, 21, 918–925. 10.1021/bp0495825. [DOI] [PubMed] [Google Scholar]
- Dickinson B. C.; Huynh C.; Chang C. J. A palette of fluorescent probes with varying emission colors for imaging hydrogen peroxide signaling in living cells. J. Am. Chem. Soc. 2010, 132, 5906–5915. 10.1021/ja1014103. [DOI] [PMC free article] [PubMed] [Google Scholar]
- Liu Y.; Ai K.; Cheng X.; Huo L.; Lu L. Gold-Nanocluster-Based Fluorescent Sensors for Highly Sensitive and Selective Detection of Cyanide in Water. Adv. Funct. Mater. 2010, 20, 951–956. 10.1002/adfm.200902062. [DOI] [Google Scholar]
Associated Data
This section collects any data citations, data availability statements, or supplementary materials included in this article.


