Abstract
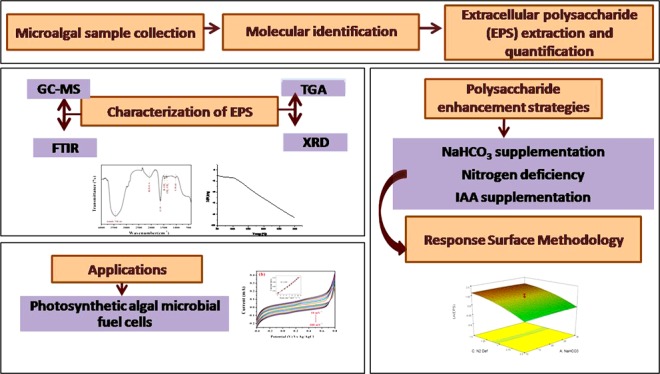
In this study, a freshwater microalga, Scenedesmus sp. SB1, was isolated, purified, and identified by its internal transcribed spacer region (ITS1-5.8S-ITS2). Media optimization through the Plackett–Burman Design and response surface methodology (RSM) showed a maximum exopolysaccharide (EPS) production of 48 mg/L (1.8-fold higher than that for unoptimized media). Characterization using gas chromatography–mass spectrometry, Fourier transform infrared, X-ray diffraction, and thermogravimetric analysis reveals that the EPS is a sulfated pectin polysaccharide with a crystallinity index of 15.2% and prompt thermal stability. Furthermore, the photoelectrogenic activity of Scenedesmus sp. SB1 inoculated in BG-11 and RSM-optimized BG-11 (ROBG-11) media was tested by cyclic voltammogram studies, revealing the potential of the inoculated strain in ROBG-11 toward photosynthetic algal microbial fuel cells over normal BG-11. To the best of our knowledge, functional group characterization, physical and thermal property and media optimization for EPS production by RSM and electrogenic activity studies are reported for the first time in Scenedesmus sp. SB1.
1. Introduction
Polysaccharides are polymers of carbohydrates that are linked to each other in a linear or branched fashion with the aid of glycosidic linkages. The composition of polysaccharides includes proteins, glycoproteins, or lipids, in addition to carbohydrates.1,2 Depending on their structure, they vary in their physicochemical properties.3,4 Microorganisms such as bacteria, cyanobacteria, and green unicellular algae produce exopolysaccharides (EPSs) on the cell outer surface for adhesion on a substratum, by increasing their resistance against erosion in a natural habitat.5−8,3 There is a rapidly growing interest in microbial EPSs from bacteria and fungi on account of their biodegradability and nontoxicity, which projects them out as ecofriendly polymers that do not cause secondary pollution.9 Thus, in addition to biological necessity, polysaccharides also possess numerous industrial and medicinal values in adhesives, detergents, textiles, cosmetics, wastewater treatment, brewing, and pharmaceuticals.10 Microalgae have a natural tendency to secrete polysaccharides into the medium, thus making it easier to extract them.11 Furthermore, the growth and cultivation of microalgae are also economical, as they could be grown with cheap nutrient media or supplements.12 In comparison to that in bacteria and fungi, the yield of polysaccharides in microalgae is less. However, the composition of EPS is unique, presenting them as rare polymers with interesting properties, distinct from other polysaccharides.
The factors such as growth rate of a microalgae, biochemical content, type, and yield percentage of EPS13,14 are greatly influenced by the composition of the culture medium and the culture’s growth conditions.15−17 Therefore, it is of utmost importance to optimize the crucial components and conditions that enhance the yield of polysaccharides. To attain this, an economic and efficient statistical design that would help in optimizing all of the vital elements and parameters for growth as well as EPS yield was employed. Furthermore, the inimitability of microalgal EPS instills interest in exploring a new polysaccharide that may pose a challenge against the existing, and explored polysaccharides in use.
In addition to the above, microalgae are also of great interest in the field of photosynthetic algal microbial fuel cells (PAMFCs), which is a potential energy-generating technology that can exploit sunlight to produce electricity in a carbon neutral fashion.18 The PAMFCs are the cells that are able to generate power by harvesting electrons from the photochemical and respiratory actions of algae. The PAMFCs are composed of an anode and a cathode separated by a polymer electrolyte membrane. Photosynthetic microalgae at anode produce electrons from the light-driven water splitting reaction and then the generated electrons are transported through an external circuit to the cathode where they are consumed by an oxidizing agent.19 The overall performance of PAMFCs depends on the electron transfer efficiency of the electrodes, emanating from the intimacy exerted between the electrode and the biofilm.
EPS produced by algae serves as a molecular glue, allowing the cells to adhere to each other, and assists in the construction of a healthier biofilm.20 Hence, it is pertinent to explore and develop new strategies to increase the biomass and EPS production to obtain proficient PAMFCs. To the best of our knowledge, this is the first report on media optimization for EPS production in Scenedesmus sp. SB1. A new strain, Scenedesmus sp. SB1, was isolated, identified, and evaluated for its EPS production and the competency of the isolated Scenedesmus sp. SB1 under various electrochemical regimes and conditions was analyzed.
2. Results and Discussion
2.1. Isolation and Molecular Characterization of Microalgae
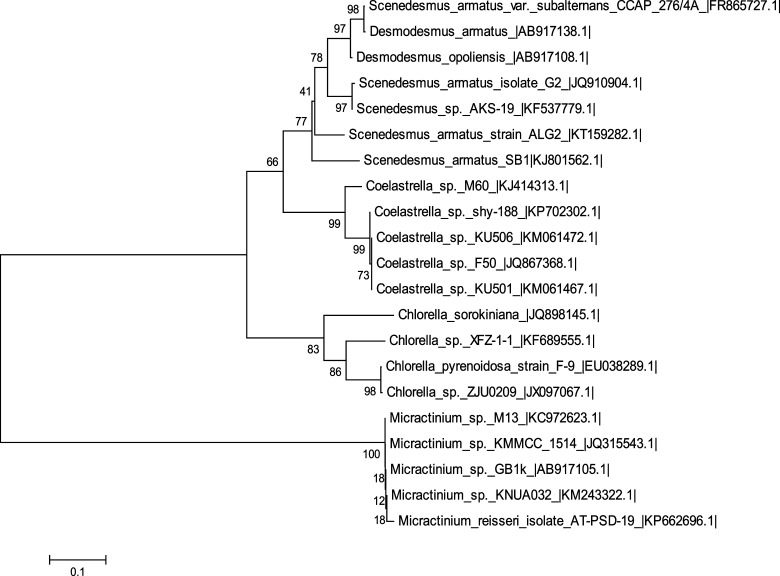
Microalgae that possess sustainability to grow in local habitats are more likely to be highly competent than those from other regions. The algae found in some habitat characteristically form mucilaginous capsules that are presumed to be polysaccharides in nature.21 However, in some microalgae, stress factors in their habitat and growth conditions not only contribute to the production of polysaccharides but also influence the changes in the structure and functional properties of the produced EPS.22 In the current study, the isolated axenic microalgal culture was maintained in a BG-11 medium and was identified on the basis of morphological observations by a light microscope. The surface topology observation unveiled that the oblong-shaped alga was composed of 2–4 cells arranged like a stack of coins with the cell diameter of about 8–12 μm, without any flagella or spines. The ultrastructure of the cells revealed the presence of a single chloroplast that occupied a major region of the cell apart from the nucleus, further confirming the strain to be Scenedesmus sp.23 Molecular characterization of Scenedesmus sp. SB1 by ITS1-5.8S-ITS2 sequences through basic local alignment search tool (BLAST) analysis revealed 99% homology with 94% query coverage to Scenedesmus armatus strain ALG2 (Genbank Accession no. KT159282.1); its phylogenetic analysis (Figure 1) with the other closely related microalgae was carried out, the sequences were submitted to Genbank (Accession no. KJ801562.1), and this unicellular green algae, Scenedesmus sp. SB1, belongs to the Scenedesmusceae family.
Figure 1.
Phylogenetic analysis of Scenedesmus sp. SB1 based on internal transcribed spacer (ITS) sequences. The percentage values at the nodes of the tree are known as bootstrap values, and the distance between the other related microalgal species is measured by the scale bar.
2.2. Effect of Stress Conditions on EPS Production of Scenedesmus sp. SB1
The production of EPSs, playing a structural and protective role in microbial biofilms,21 have been reported to be enhanced under stress conditions.24−26 The information for enhancement of EPS production in green microalgae under stress conditions is scarce. Among the nutrient stresses provided to Scenedesmus sp. SB1, the nitrogen stress did not influence EPS production noticeably (0.037 ± 0.012 mg/mL) when compared to that of the normal BG-11 (0.051 ± 0.019 mg/mL). The acidic stress (pH 6) yielded a 1.6-fold increase in the EPS production, 0.084 ± 0.037 mg/mL, than that in normal pH 6.8 ± 2 (0.051 ± 0.019 mg/mL). However, when the medium was set at a pH of 8, Scenedesmus sp. SB1 yielded 0.04 ± 0.013 mg/mL only. Generally, a pH shift is considered as an undesirable event that may be fatal to the organism. Therefore, the organism tends to produce more EPS as a protective strategy.27 But the results of this study infer that the acidic pH influences more production of EPS than alkaline pH. On the other hand, when 1% NaCl was added to the medium, Scenedesmus sp. SB1 yielded 0.086 ± 0.04 mg/mL of EPS, 1.67-fold higher than the yield in normal BG-11. Likewise, 2 and 3% salinity stresses have also been found to increase EPS production, which is not as significant as 1% salinity stress. It was also observed that heavy metal (mercuric chloride, HgCl2) stress provided to Scenedesmus sp. SB1 has not shown noticeable increase in EPS production, which is in contradiction to the previous reports28 (Supporting Information Table S1).
2.2.1. Analysis of Physical Characteristics and Chemical Composition by Fourier Transform Infrared (FTIR) and Gas Chromatography–Mass Spectrometry (GC–MS)
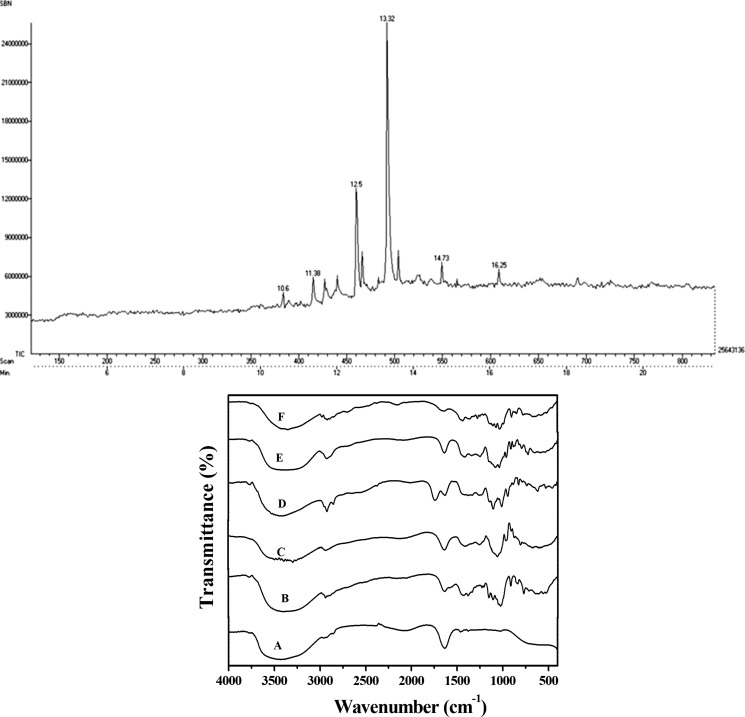
The viscosity of the EPS obtained from Scenedesmus sp. SB1 was determined using a capillary viscometer and was found to be 0.795 mPa S. The deionized EPS did not contain any protein, as determined by Lowry’s method. GC–MS analysis of the hydrolyzed EPS showed the presence of galacturonic acid, ribose, xylose, fructose, and galactose sugars (Figure 2a). Detection of EPS in the culture filtrate of Scenedesmus sp. SB1 by FTIR analysis against 11 commercially available sugars (HiMedia) revealed that the structural information of the extracellular polysaccharide obtained is in concordance with the obtained gas chromatogram. The noninvasive FTIR method is also able to detect the presence of functional groups, such as the OH stretch (3445.34 cm–1), CH stretch (2866.82), R–N=C–S (2075.47 cm–1), C=O stretch (1645.76 cm–1), CH2, CH3 (1457.91 cm–1), S=O stretch (1375.69 cm–1), and C–H stretch (750.29 cm–1) pertaining to pectic acid or polygalacturonic acid, maltose, mannose, glucose, and ribose sugars (Figure 2b). The wavenumbers pertaining to the mentioned functional groups have been compared with those reported for pectic polysaccharides and could be affirmed to be the same.29 It is noteworthy to mention the presence of sulfur group, thus pronouncing it a sulfated pectic polysaccharide which is not only reported for its high clinical applications but is exclusively prevalent among brown marine macroalgae. Polygalacturonic acid has known applications in wine making and brewing too.
Figure 2.
(a) GC chromatogram of EPS obtained from Scenedesmus sp. SB1, indicating the retention time of different sugars. (b) FTIR spectrum of EPS from Scenedesmus sp. SB1 overlaid against standard sugars; A, EPS of the strain; B, glucose; C, maltose; D, polygalacturonic acid; E ribose; F, mannose.
The presence of polygalacturonic acid in microalgae-derived EPS has already been reported in Chlamydomonas reinhardtii.4 However, the EPS profiling of Scenedesmus sp. has not been reported earlier. The results obtained by FTIR corroborate the results obtained through GC–MS, thus confirming the sugar profile of the polysachharide (Table 1a). The corresponding FTIR functional groups and wavenumber ranges are listed in Table 1b.
Table 1a. Mass Spectrum of EPS from Scenedesmus sp. SB1.
| retention time (min) | sugar name | m/z value | referred from |
|---|---|---|---|
| 11.38 | d-ribose | 87.0772 | NIST database |
| 12.5 | d-galactose | 101.0081 | NIST database |
| 13.32 | d-galacturonic acid | 103.1000 | NIST database |
| 14.73 | xylose | 73.0842 | NIST database |
| 16.25 | fructose | 147.1506 | NIST database |
Table 1b. Band Assignment for EPS from Scenedesmus sp. SB1 and the Relevant Bands of Standard Sugars.
| wavenumber (cm–1) | assignment | intensity | |
|---|---|---|---|
| Scenedesmus sp. SB1 EPS | 3445–3435 (3445) | OH stretch | medium |
| 3400–2800 (2931) | dimer OH stretch | strong | |
| 3000–2850 (2866) | CH stretch | strong | |
| 2140–1990 (2075) | R–N=C=S | medium | |
| 1645–1635 (1645) | C=O stretch | strong | |
| 1470–1450 (1457) | CH2, CH3 | strong | |
| 1370–1360 (1369) | S=O sulfonyl chloride | strong | |
| 770–730 (750) | C–H out of plane | medium | |
| polygalacturonic acid | 3445–3435 (3433) | OH stretch | medium |
| 3400–2800 (2931) | dimer OH stretch | strong | |
| maltose | 3400–2800 (2931) | dimer OH stretch | strong |
| 1645–1635 (1645) | C=O stretch | strong | |
| ribose | 770–730 (750) | C–H out of plane | medium |
| glucose | 1370–1360 (1370) | S=O sulfonyl chloride | strong |
| mannose | 1470–1450 (1457) | CH2, CH3 | strong |
2.2.2. Powder X-ray Diffraction (PXRD) Analysis
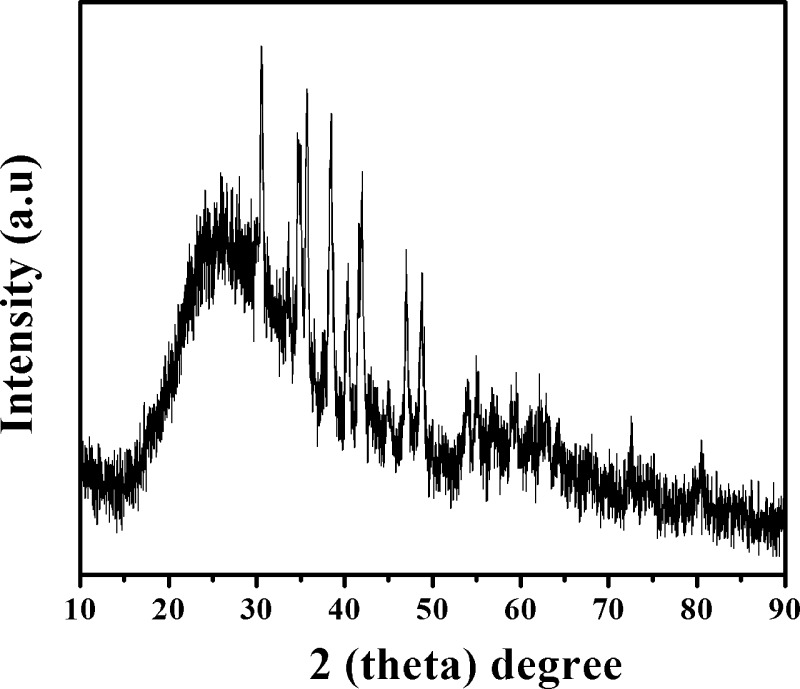
The phase composition, purity, and crystallinity (i.e., either crystalline or amorphous) of the EPS from Scendesmus sp. SB1 were analyzed by the PXRD technique, and the obtained result is depicted in Figure 3. The sharp thin characteristic diffraction peaks centered at 30.57, 34.74, 34.95, 35.72, 38.43, 40.35, 41.69, 41.98, 47.04, 48.75, 56.72, and 59.02° with interplanar spacings (d-spacings) of 2.92, 2.58, 2.56, 2.51, 2.34, 2.23, 2.16, 2.15, 1.92, 1.86, 1.62, and 1.56 A°, respectively, correspond to the crystalline parts of EPS. In addition to the aforementioned diffraction peaks, a broad peak exhibited at 26.03° was ascribed to the amorphous component of EPS. The amount of crystallinity of EPS was calculated via the ratio of the sharp thin diffraction peaks to broad peaks, which elucidated that the extracted EPS is 15.2% crystalline and 84.8% amorphous in nature. The existing crystalline domain acted as a reinforcing grid and enhanced the performance of the EPS over a wide temperature range, as evident from thermogravimetric analysis (TGA).
Figure 3.
X-ray diffraction (XRD) spectrum of EPS isolated from Scenedesmus sp. SB1.
2.2.3. TGA
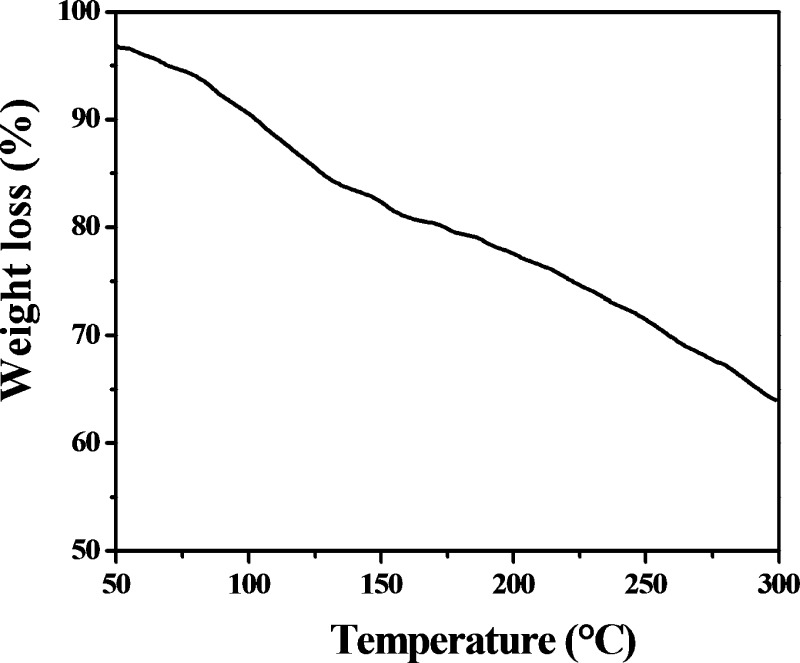
The applicability of a polysaccharide is greatly dependent on its thermal stability and rheological behavior. TGA is a simple technique that provides the percent weight loss of the polysaccharide against time.30 TGA reveals that the weight loss in the EPS from Scenedesmus sp. SB1 is a two-step process in which 80.5% mass loss is detected in the first phase at 166.869 °C and 63.95% loss is detected at 298.8 °C in the second phase, which implies the structural alignment of the compound, which is slightly crystalline and predominantly amorphous (Figure 4).
Figure 4.
Thermogravimetric thermogram of EPS obtained from Scenedesmus sp. SB1 indicating the percent mass loss of the compound.
2.3. Statistical Optimization of Media Components for Enhancing the Production of EPS Using Plackett–Burman Design (PBD)
To enhance the capability of Scenedesmus sp. SB1 for EPS production, nutrient factors sodium bicarbonate (NaHCO3), indole-3-acetic acid (IAA), and tannery effluent (TE) were selected for optimizing the growth medium via statistical modeling using PBD. Chisti in 200712 reported that owing to the economical constrains involved in the cultivation of microalgae, exploiting a cheap nutrient source such as industrial waste is one of the cost-effective strategies in demand. In this study, combinatorial interactions of crucial factors involved in enhancing the EPS production in Scenedesmus sp. were analyzed by PBD. The experiment involves 12 runs with two levels of concentrations of the foresaid factors. The response was analyzed in terms of EPS production (mg/mL) and biomass (OD600), and it was depicted by a Pareto chart (Figure 5). The positive and negative impact of the factors on EPS production were depicted by orange and blue colors, respectively, and the reference line at 2.3 (t-value limit) shows the significant level of the factors. The factors that extend beyond this line were found to be highly important, as determined by the t-values. It was inferred from the Pareto chart that the EPS production was statistically influenced by IAA (t-value, 2.73). This was also substantiated by analysis of variance (ANOVA) of the design (Table S2), according to which the model was significant for IAA with P-value <0.05 (95% confidence) given by the F-test. Furthermore, the F-value of 7.53 implies that the model is significant and there is only a 2.07% chance that the F-value could occur because of noise. In case of biomass production, the model proved to be insignificant. However, the Pareto chart implies NaHCO3 as the second crucial factor influencing biomass production in Scenedesmus sp. SB1 (Figure S1). Studies on the influence of IAA on the biomass growth in Chlorella sorokiniana have already been reported by Ozioko et al. in 2015,31 where a 10 mg/L IAA has resulted in a 9.5-fold increase in the cell concentration.
Figure 5.
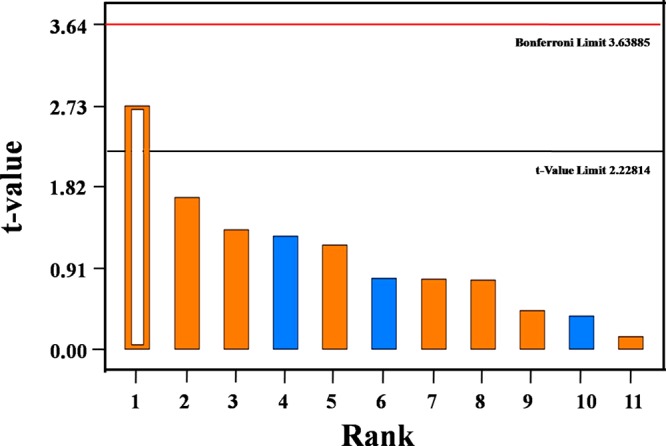
Pareto chart showing IAA (B) as a crucial factor with t-value of 2.73 for EPS production.
2.4. Response Surface Methodology (RSM)-Based EPS Production in Scenedesmus sp. SB1
Optimization of media for enhancing the production of EPS was implemented in Scenedesmus sp. SB1. On the basis of the results of PBD, IAA has been found to be significant for influencing EPS production and was therefore carried forward for RSM central composite design (CCD). The supplementation of IAA has been patented for enhancing the production of value-added products in algae.32 However, there are very scarce reports on the enhancement of polysaccharide production in freshwater microalgae, supplementing IAA in the growth media. NaHCO3 has been ranked the second crucial factor for biomass in PBD, apart from which, there are reports on marine microalgae that NaHCO3 supplementation influences biomass production.33 The third factor in PBD, the tannery effluent, did not exhibit significant effects either on EPS production or on biomass production. Therefore, an alternating stress factor, which is also cost-effective, was needed for influencing EPS in RSM CCD. On the basis of the reports of the preliminary study, NaNO3– was chosen as the stress factor. Previous reports state that nitrogen deficiency enhances EPS production in marine microalgae.34,35 Therefore, NaHCO3, IAA, and NaNO3– were selected as the variables for the RSM CCD. Hence, the optimal combination of the variables of three independent factors was determined through the CCD. Reasonable agreement of the obtained experimental response values with the software-predicted values (Table 2) reveals that the system is in accordance with a linear equation of the critical factors. The three-dimensional graph reflects the interactions of NaHCO3, IAA, and NaNO3 for the EPS production response (Figure 6).
Table 2. CCD for Actual Observed Responses for EPS Production (mg/mL) and Biomass (OD600) with Predicted Responses after Analysis.
| observed
responses |
predicted
responses |
||||||
|---|---|---|---|---|---|---|---|
| run order | factor A: NaHCO3 (mM) | factor B: IAA (μM) | factor C: NaNO3 (g/L) | EPS (mg/mL) | biomass (OD600) | EPS (mg/mL) | biomass (OD600) |
| 1 | 3.18 | 1.00 | 1.00 | 0.03 | 1.23 | 0.17 | 1.24 |
| 2 | 10.00 | 1.50 | 0.50 | –0.22 | 0.91 | –0.47 | 1.03 |
| 3 | 30.00 | 0.50 | 1.50 | 0.66 | 0.44 | 0.88 | 0.67 |
| 4 | 20.00 | 1.00 | 1.00 | 0.34 | 0.62 | 0.21 | 0.85 |
| 5 | 20.00 | 1.00 | 1.00 | 0.21 | 0.67 | 0.21 | 0.85 |
| 6 | 30.00 | 1.50 | 1.50 | 0.59 | 0.96 | 0.86 | 0.71 |
| 7 | 20.00 | 1.00 | 1.00 | 0.59 | 0.97 | 0.21 | 0.85 |
| 8 | 20.00 | 1.00 | 1.00 | 0.22 | 1.01 | 0.21 | 0.85 |
| 9 | 10.00 | 0.50 | 0.50 | –0.25 | 1.37 | –0.45 | 0.99 |
| 10 | 10.00 | 1.50 | 1.50 | 0.83 | 1.41 | 0.82 | 1.17 |
| 11 | 20.00 | 1.00 | 1.00 | 0.37 | 1.11 | 0.21 | 0.85 |
| 12 | 20.00 | 0.16 | 1.00 | 0.55 | 0.63 | 0.22 | 0.82 |
| 13 | 30.00 | 0.50 | 0.50 | –0.20 | 0.59 | –0.41 | 0.53 |
| 14 | 20.00 | 1.00 | 0.16 | –2.00 | 0.90 | –0.88 | 0.73 |
| 15 | 20.00 | 1.00 | 1.84 | 1.10 | 1.18 | 1.30 | 0.97 |
| 16 | 36.82 | 1.00 | 1.00 | 0.30 | 0.69 | 0.24 | 0.46 |
| 17 | 10.00 | 0.50 | 1.50 | 0.59 | 0.93 | 0.84 | 1.13 |
| 18 | 20.00 | 1.84 | 1.00 | 0.39 | 0.58 | 0.19 | 0.88 |
| 19 | 30.00 | 1.50 | 0.50 | –0.30 | 0.38 | –0.43 | 0.57 |
| 20 | 20.00 | 1.00 | 1.00 | 0.31 | 0.39 | 0.21 | 0.85 |
Figure 6.
Three-dimensional surface plot showing the interaction between the factors: A, NaHCO3; B, IAA; and C, NaNO3 for the EPS production response.
Among the experimental runs, run 15 of RSM CCD yielded the maximum EPS of 9.97 mg/L (1.8 folds). The design analysis using ANOVA (F-test) showed that the model chosen is significant for both the responses, biomass growth (OD600) and EPS production (mg/mL), with P-values 0.027 and 0.0017, respectively (Table 3). Furthermore, the R-squared value (0.8772) denotes that the 87.72% of variability in the EPS productivity response (mg/mL) is perhaps elucidated by the model. The significance of the model with the F-value of 7.87 indicates only a 0.17% chance that this F-value could be due to noise. This experiment was further validated to verify the model and its reproducibility; the highest-yielding run was validated by cultivation on a large scale in a medium that was formulated as the RSM-optimized medium (Table 4). The growth and EPS production of Scenedesmus sp. SB1 hit the maximum in the BG-11 medium without normal levels of NaNO3 (15 g/L), supplemented with 20 mM NaHCO3, 1 μM IAA, and 1.8 g/L NaNO3.
Table 3. ANOVA Tablea.
| response
1 |
response
2 |
|||||||||
|---|---|---|---|---|---|---|---|---|---|---|
| EPS
productivity (mg/mL) |
biomass
growth (OD600) |
|||||||||
| P-value | P-value | |||||||||
| source | sum of squares | df | mean square | F-value | prob > F | sum of squares | df | mean square | F-value | prob > F |
| model | 5.744 | 3 | 1.915 | 15.071 | <0.0001 | 0.801 | 3 | 0.267 | 4.006 | 0.027 |
| A-NaHCO3 | 0.005 | 1 | 0.005 | 0.042 | 0.840 | 0.729 | 1 | 0.729 | 10.939 | 0.004 |
| B-IAA | 0.001 | 1 | 0.001 | 0.012 | 0.916 | 0.005 | 1 | 0.005 | 0.070 | 0.794 |
| C-NaNO3 | 5.737 | 1 | 5.737 | 45.159 | <0.0001 | 0.067 | 1 | 0.067 | 1.008 | 0.330 |
P-value <0.005 indicates the model.
Table 4. Validated vs Normal BG-11 for EPS Productiona.
| response | before optimizationb | optimized mediac | fold increase |
|---|---|---|---|
| EPS (mg/L) | 27 ± 0.788 | 48.6 ± 0.733 | 1.8 |
| Biomass (OD600) | 0.916 ± 0.048 | 1.516 ± 0.03 | 1.6 |
The experiment was carried out in duplicate.
Normal BG-11.
BG-11 optimized with 20 mM NaHCO3, 1 μM IAA, and 1.8 g/L NaNO3.
Bicarbonate is one of the crucial factors influencing a microalga’s growth and metabolite production. Bicarbonate supplementation has significantly improved the photosynthetic efficacy and nitrate utilization from the external media of microalgae.36 In this study, NaHCO3 has shown significance for growth in the RSM CCD, which corroborates the existing reports as mentioned above. Apart from this, nitrogen source is one of the essential elements of a microalgal culture medium, which directly influences the growth of the organism.37 There are several reports stating that the source and concentrations of nitrogen can influence the biochemical composition and growth of microalgae.38,39 In the current study, normal levels of NaNO3 (15 g/L) were used as the nitrogen source in the BG-11 medium. However, in the RSM-optimized medium, the concentration of NaNO3 added was 1.8 g/L, which is deficient for the organism.
This condition has probably created a stress for the growth of the organism, which should have contributed to the enhancement in EPS production.40 On the other hand, the concentrations of NaNO3, lesser than 1.8 g/L of BG-11 have resulted in the depletion of the biomass itself. Some strains of algae, such as Chlorella vulgaris, Nannochloropsis sp., and Neochloris oleoabundans, were previously reported to grow well even under nitrogen-deficient conditions, utilizing their intracellular nitrogen reserves, such as pigment protein molecules.41,42 However, intracellular nitrogen reserve utilization is purely strain-dependent and Scenedesmus sp. SB1 possesses this capability with at least a minimum source of nitrogen (1.8 g/L) below which the cells die of nitrogen starvation. Therefore, 1.8 g/L of NaNO3 could be considered as an optimum concentration that influences the EPS production, without negatively influencing the growth of the microalgae. There are very few reports on the symbiotic association of bacteria (Sulfitobacter) and microalgae, in which the bacterium exchanges IAA for organosulfur compounds.43,44 This substantiates the positive impact of IAA in the growth of microalgae.
From the correlation between the actual and predicted values of the system and the 1.8-fold increase in EPS production of the strain, it is evident that the nutrient supplementation and starvation in the normal growth medium influence the biomass and EPS production of the strain directly, contributing to the significance of the model.
Studies on optimization have been done for enhancing EPS production in bacteria and yeast systems, in which a significant 1.6- and 4-fold increase have been documented, respectively.45,46 However, reports on statistical media optimization for EPS production are not prevalent. So far, a similar study has been carried out in green microalgae C. reinhardtii, in which a 1.6-fold enhancement of EPS production has been documented.4 However, to the best of our knowledge, this is the first report on statistical modeling of media optimization for EPS production in Scenedesmus sp. SB1 to yield a 1.8-fold increase, which is the highest among the green algae so far reported. It is worth mentioning that the research work pertaining to EPS production in this strain has not been reported elsewhere so far.
2.5. Electrochemical Activity of Scenedesmus sp. SB1
Electrochemical techniques are crucial tools for the evaluation and elucidation of the electrode reactions that occur in PAMFCs. Because the construction of fuel cell systems is very tedious, the laboratory-scale testing using various electrochemical methods is highly beneficial and reliable to determine the optimum circumstances. Henceforth, the electrochemical activity of Scenedesmus sp. SB1 inoculated in BG-11 and RSM-optimized BG-11 (ROBG-11) media was evaluated. The cyclic voltammetry measurements of Scenedesmus sp. SB1 inoculated in BG-11 and ROBG-11 were achieved at a carbon cloth (CC) at a scan rate of 50 mV/s (Figure 7). It could be observed that the CC exhibited only the background current in BG-11 and ROBG-11, exhibiting the electroinactivity of the media. In contrast, well-defined redox peaks were obtained in the Scenedesmus sp. SB1-inoculated media over a potential range of −0.6 to +0.5 V versus Ag/AgCl, endorsing the redox activity of Scenedesmus sp. SB1. The Scenedesmus sp. SB1-inoculated media exhibited a well-defined redox couple at 0.22 V and −0.03 V versus Ag/AgCl, which is attributed to the electroactive polysaccharides located on the cellular surface or electroactive species present in the electron-rich metabolic pool (quinone pool).47,48 Although external mediators were not added into the electrolyte solution or immobilized over the electrode surface, the studied Scenedesmus sp. SB1 produced redox peaks, which concludes that the cells are viable for direct transfer of electrons to the electrode with the aid of the EPS generated by the cells.
Figure 7.
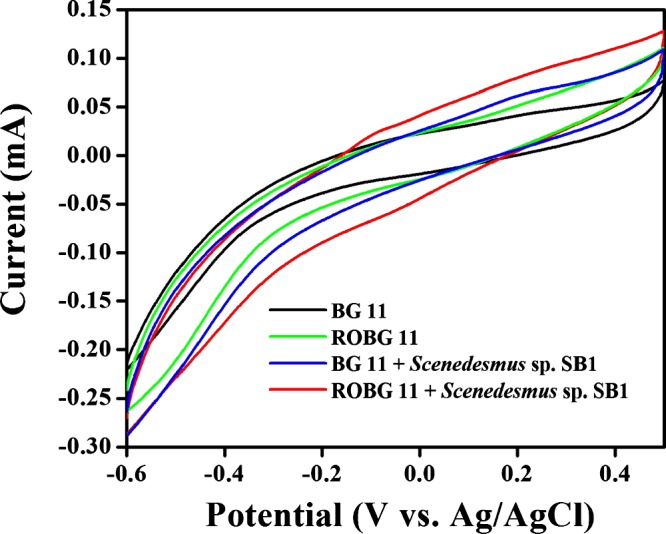
Cyclic voltammograms of the CC obtained in the presence and absence of Scenedesmus sp. in (a) BG-11 and (b) ROBG-11 at a scan rate of 50 mV/s. The experiment was carried out in duplicate.
2.6. Photoactivity of Scenedesmus sp. SB1
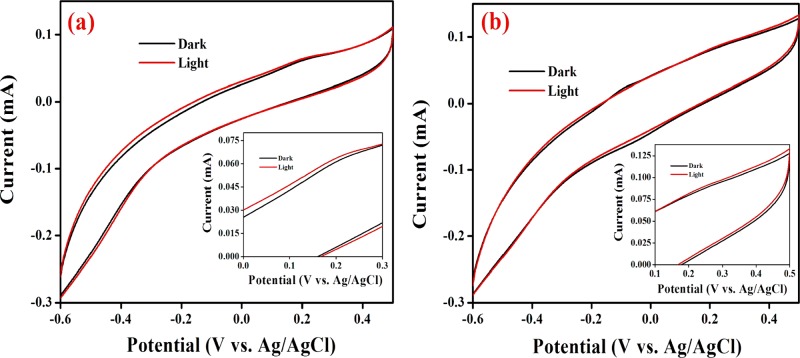
To study the photoactivity of Scenedesmus sp. SB1, cyclic voltammetry measurements were recorded under the presence and absence of light (Figure 8). Under illumination, the light-driven electrical responses of the Scenedesmus sp. SB1 inoculated in BG-11 and ROBG-11 media were directly compared with the voltammograms obtained under dark conditions. In comparison with the cyclic voltammetric responses of Scenedesmus sp. SB1 under dark conditions, the CC exhibited an increased anodic wave current in the presence of light, pronouncing the photoactivity of Scenedesmus sp. SB1 (Figure 8a,b). The increase in the anodic peak current during light illumination might have originated from the break down of intracellular metabolites and/or splitting of water molecules.49,50 The splitting of water molecules could generate electrons that are transferred to the photosynthetic electron transfer chain, resulting in the improved oxidation current of Scenedesmus sp. SB1 during light illumination.49
Figure 8.
Cyclic voltammograms of the CC in the presence of Scenedesmus sp. in (a) BG-11 and (b) ROBG-11 under dark and light conditions at a scan rate of 50 mV/s (inset: voltammograms in high magnification). The experiment was carried out in duplicate.
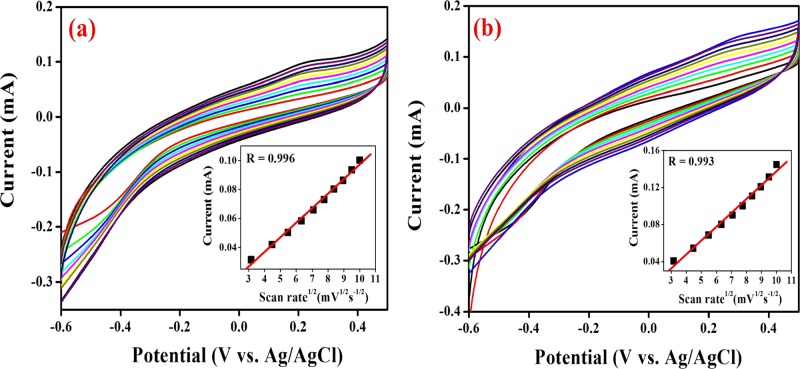
Furthermore, the kinetics involved in the electrochemical reaction was evaluated as a function of the scan rate at the CC in Scenedesmus sp. SB1 under light (Figure 9a,b). As shown in the figure, the anodic responses ascribed to the photosynthetic water splitting were increased and positively shifted with an increasing scan rate. In addition, the square root of scan rates and the anodic peak currents exhibited good linearity with high correlation coefficients (R) of 0.996 and 0.993 for the Scenedesmus sp. SB1 inoculated in BG-11 and ROBG-11 media, respectively, revealing that the electrochemical redox reaction occurring at the electrode surface is a diffusion-controlled process.
Figure 9.
Cyclic voltammograms of the CC in the presence of Scenedesmus sp. in (a) BG-11 and (b) ROBG-11 as a function of the scan rate ranging from 10 to 100 mV/s (inset: calibration plot of current vs square root of scan rate). The experiment was carried out in duplicate.
2.7. Evaluation of Photocurrent Production
Evaluation of photocurrent generation was performed with the aid of chronoamperometry experiments in the presence and absence of light, by holding a potential at 0.25 V versus Ag/AgCl (Figure 10). Irrespective of the chosen medium, Scenedesmus sp. SB1 exhibited a lower photocurrent under dark conditions. Under the illumination of light, the photocurrent generation increased, which could be attributed to the progression of light-driven photosynthetic water splitting. In comparison with BG-11, ROBG-11 exhibited a continuous, stable, higher current density in the presence of light, which indicates that Scenedesmus sp. SB1 inoculated in ROBG-11 is highly photoactive. In general, the EPS production in living organisms provide many diverse benefits to the cells, including adhesion, protection, and colonization, and EPS could act as a molecular glue, allowing the formation of well-defined biofilms. Hence, it could be concluded that the immense secretion of EPS in ROBG-11 results in the formation of a definite biofilm, which guaranteed an intact contact between the electroactive proteins located on the cellular surface and CC, facilitating improved electron transfer under light illumination. On the basis of the significant results obtained in the electrochemical analyses, we can assure that the aforesaid Scenedesmus sp. SB1 inoculated in ROBG-11 is a promising strain for the construction of PAMFCs.
Figure 10.
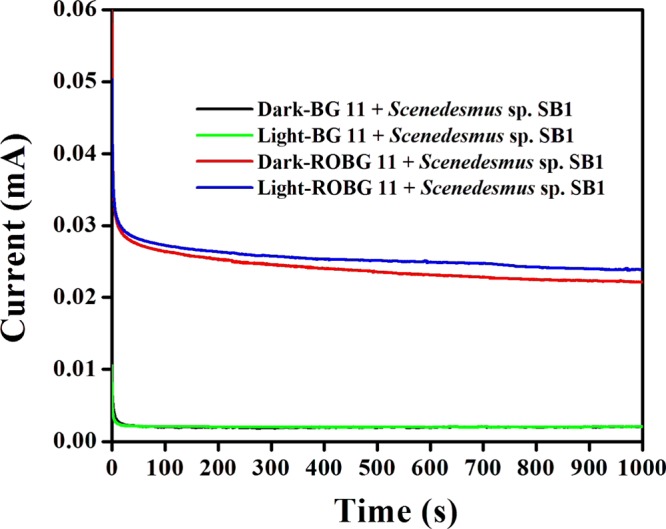
Chronoamperometry measurements of the CC carried out under dark and light conditions. The experiment was carried out in duplicate.
3. Conclusions
Media optimization through the PBD and RSM CCD has shown a significant (1.8-fold) increase in EPS production in Scenedesmus sp. SB1. Physicochemical characterization revealing the presence of galacturonic acid and thermal stability of up to 298.8 °C makes it a potential candidate for several applications. Photoelectricity generation in Scenedesmus sp. SB1 inoculated in ROBG-11 exhibited superior performance than that in normal BG-11, which was identified through cyclic voltammetry and chronoamperometry studies. These results afford a useful framework for the future design and operation of PAMFCs.
4. Methods
4.1. Sample Collection, Isolation, and Cultivation of Microalgae
Microalgal samples were collected from a temporary freshwater pond at Palkalai Nagar, Madurai District, Tamil Nadu, India (9.9405° N, 78.0105° E). The samples were isolated by serial dilution method and inoculated on BG-11 agar medium, pH 6.8 ± 0.2. The culture was incubated at 25 °C for 14 days and was maintained under constant illumination of 1500 lx of alternate photoperiod (light–dark, 12:12 h).51 The axenic culture was obtained (observed by a light microscope; Labomed, Germany) and was transferred into the BG-11 medium for further biomass development.
4.2. DNA Extraction and Polymerase Chain Reaction (PCR)
Genomic DNA was extracted from the exponential growth culture of isolate SB1 using the standard protocol.52 Genomic DNA (100 ng) was used as the template for PCR using ITS primers (5′-ACCTAGAGGAAGGAGAAGTCGTAA-3′, 5′-TTCCTCCGCTTATTGATATGC-3′) to amplify the ITS1-5.8S-ITS2 region.53 PCR (Nexus Gradient Mastercycle; Eppendorf, Germany) was performed with the following reaction conditions, initial denaturation at 94 °C for 3 min, followed by 35 cycles of denaturation at 94 °C for 30 s, annealing at 60 °C for 30 s, extension at 72 °C for 30 s, and final extension at 72 °C for 10+ min. PCR products were electrophoresed on 1.2% agarose gel and were purified using the GenElute kit (Sigma-Aldrich) using the protocol of the manufacturer. Further PCR products were sequenced by Sanger’s dideoxy method, and BLAST analysis was performed (https://blast.ncbi.nlm.nih.gov/Blast.cgi) with the ITS1-5.8S-ITS2 region of isolate SB1 as query. A phylogenetic tree was constructed by molecular evolutionary genetics analysis version 6.0 software based on the neighbor-joining tree method of phylogeny test with 1000 bootstrap replications using ribosomal sequences to determine the taxonomic level with the other closely related microalgae, and the ITS1-5.8S-ITS2 sequences were submitted to GenBank (www.ncbi.nlm.nih.gov).
4.3. Cultivation of Microalgae under Stress Conditions
Nutrient stress condition by nitrogen starvation, excluding nitrogen source NaNO3, in the normal BG-11 medium was imposed. Osmotic stress with the addition of 1, 2, and 3% NaCl was also created. Acidic and alkaline stresses were imposed by altering the pH of normal BG-11 from 7 to 6 and to 8, respectively. Heavy metal stress was created by addition of 1, 5, and 10 μg of mercuric chloride (HgCl2) to normal BG-11. Scenedesmus sp. SB1 (14 ± 0.06 mg/50 mL DW) was taken as the initial inoculum in 100 mL Erlenmeyer’s flask. Normal BG-11 was used as the control. All of the studies were performed in duplicate, and the results are expressed as mean ± standard deviation.
4.4. Biomass and EPS Productivity of Scenedesmus sp. SB1
The cell density was continuously monitored for biomass and EPS production, which was read by measuring the absorbance at 600 nm, and the log phase microalgae were harvested at 20th day. EPS was extracted from microalgae by heating the cells in a water bath at 45 °C for 20 min, followed by centrifugation at 8000 rpm for 25 min at room temperature. The supernatant was collected, and an aliquot was stored for total sugar analysis. The remaining supernatant was added with 3 times its volume of acetone54 and stored at −20 °C for 24 h. After 24 h, the acetone–supernatant mixture was spun down at 4 °C for 20 min. The polysaccharides precipitated along the sides of the tube were collected and air-dried to measure the yield of EPS gravimetrically. All of the experiments were performed in triplicate, and the results were expressed as mean ± standard deviation.
4.5. Total Sugar Estimation
Total sugars in the supernatant were estimated using the phenol sulfuric acid method.55 The supernatants collected were then ultrafiltered using an ultrafiltration membrane (10 000 molecular weight cut-off; Merck) for the removal of ions present in the precipitate. The partially purified polysaccharide was then estimated for its total sugar content by the conventional phenol sulfuric acid assay, using d-glucose as the standard.
4.6. Characterization of Physical Properties
The intrinsic viscosity was determined with a capillary viscometer (Redwood viscometer No. 1; Pune, India). The time required for the solution flow was determined and expressed in millipascals. The dried EPS was dissolved in distilled water to a concentration of 0.5 mg/mL by heating at 45 °C and stirring for 6 h at room temperature prior to testing for viscosity. Water was used as the reference. All viscosity measurements were carried out in triplicate using freshly prepared solutions. Viscosity was estimated by the following formula
| 1 |
where t1 is the time taken by the EPS to flow in the viscometer, d1 is the density of the EPS solution, t2 is the time taken by the solvent to flow in the viscometer, and d2 is the density of the solvent.
4.7. Analysis of Chemical Composition by FTIR and GC–MS
The transmittance FTIR spectrum within the 4000–400 cm–1 wavenumber range was recorded using KBr pellets in a Bruker advanced FTIR analyzer (Bruker, Germany). The spectra obtained at room temperature56 were smoothed and baseline-adjusted. The obtained spectra of the sample and monosugar standards (HiMedia) were exported to Origin 6.0 software for overlay of the standards upon the sample. The overlapped band positions were obtained by the second derivative algorithm. The functional groups were interpreted using IR PAL (8.0) software.
The chemical composition of the extracted EPS was analyzed by hydrolyzing the sample with 4 N trifluoroacetic acid for 6 h at 80 °C. The hydrolysate was then derivatized by reduction with NaBH4 and acetylation with pyridine and acetic anhydride to its corresponding alditol acetates.57 The derivatized EPS samples were analyzed by GC (Agilent Technologies 6890, N series), and the m/z values were obtained using an electron impact ionization-mass spectrometer (JEOL GC MATE-II; JEOL Ltd., Tokyo, Japan) equipped with a HP-5 MS column, photon multipler tube detector, and quadrupole double-focusing mass analyzer. Standard monosaccharides were also derivatized and analyzed by the same procedure. Each peak was also compared with the National Institute for Standards and Technology (NIST) database at the Sophisticated Analytical Instrument Facility, Indian Institute of Technology, Madras, Chennai, Tamil Nadu, India (http://www.saif.iitm.ac.in)
4.8. PXRD Analysis
PXRD spectroscopy was performed with BRUKER eco D8 advanced, Germany, with radiation generated at 40 kV and 20 mA with a LynxEye detector to study the nature of EPSs using a slow scan in 10–100Θ, and the spectrum was recorded. The irradiated length and specimen length were 10 mm with receiving slit size of 0.2 mm at a 255 mm goniometer radius. The distance between the focus and divergence slit was 100 mm. The dried EPS sample was mounted on a quartz substrate, and the intensity peaks of diffracted X-rays were continuously recorded with a scan step time of 64 s at 25 °C while d-spacings appropriate to diffracted X-rays at that value of Θ were calculated by Bragg’s law (eq 2).
| 2 |
where Θ is half of the scattering angle measured from the incident beam.
The crystallinity index (CIxrd) was calculated from the area under crystalline peaks normalized with the corresponding total scattering area that is, the ratio of the areas of the peaks of crystalline phases to the sum of the areas of crystalline peaks and the amorphous profile (eq 3)58
| 3 |
4.9. TGA
TGA of EPS was carried out on a thermal analyzer, model SDT Q600. The thermogram was obtained in the range of 30–300 °C under nitrogen atmosphere at a rise of 1 °C/min. The analysis was performed by gradually increasing the temperature, plotting the weight (percentage) against time in minutes using thermal advantage software.
4.10. Media Optimization Using the PBD
The PBD was employed to determine the most significant media components for EPS production using the software Design Expert version 9.0. The following three crucial components were selected: NaHCO3, IAA, and the TE. Each variable was represented as high and low levels, as described by the PBD, and a total of 12 experimental runs were generated. All of the experiments were carried out in duplicate, and the mean value of EPS was taken as response 1 (Y1) and optical cell density corresponding to the biomass production was taken as response 2 (Y2). The process of optimization was defined in a first-order polynomial model and represented as follows
| 4 |
where Y is the response, β is the model intercept, βi is the linear coefficient, and Xi is the level of independent variables. On the basis of the significant increase in the response, the crucial variables were further selected for the RSM CCD based on the Pareto chart depiction.
4.11. RSM–Central Composite Rotatory Design-Based Media Optimization
A statistical experimental design using RSM is long-established technique employed by researchers for increasing the production of metabolites. A five-level two-factor CCD was employed in optimizing a suitable medium with NaHCO3 (A), IAA (B), and nitrogen deficiency (NaNO3–) (C) as the independent variables. Design Expert software version 9.0 was used to launch the optimized medium. NaHCO3 and IAA were supplemented to the normal BG-11 medium, whereas NaNO3, which is one of the media components itself, was the starvation factor. The RSM CCD enclosed a total of 20 experimental runs at five coded levels, viz., −α, −1, 0, +1, + α, corresponding to NaHCO3 (3.18, 10, 20, 30, and 36.82 mM), IAA (0.159 M, 0.5 μM, 1 μM, 1.5 μM, and 1.84 μM), and NaNO3 (0.159, 0.5, 1, 1.5, and 1.84 g/L), respectively. The 20 experimental runs of the design had six center value replications. Responses Y1 and Y2 were EPS production (mg/mL) and biomass (OD600), respectively. The results were statistically analyzed by a quadratic equation as given below
| 5 |
where Y is the response, β0 is the intercept term, βi is the linear effect, βii is the squared effect, βij is the interaction effect, Xi and Xj are the factors independent variables, and ε is the error. The experiment was carried out in triplicate, and the results are expressed in terms of mean ± standard error.
4.12. Electrochemical Characterization
The cyclic voltammetry and chronoamperometry studies were performed using a CHI-650D analytical system, connected with a single-compartment cell comprising a three-electrode configuration with a CC (1 × 1 cm2) as the working electrode, Ag/AgCl (1 M KCl) as the reference electrode, and a platinum wire as the counter electrode. Scenedesmus sp. SB1, which was grown in the BG-11 medium and the ROBG-11 medium at 25 °C under the light–dark regime of 12:12 h, was used as the electrolyte. Simultaneously, the control experiments (i.e., BG-11 or ROBG-11 medium only) were also performed. The effect of light illumination on the electrochemical activity of Scenedesmus sp. SB1 was examined by placing the electrochemical cell under irradiation of 30 μmol photons/m2 s during the experiment. For the dark measurement, the system was wrapped with a black cloth and the experiment was carried out in the light-off mode and after the dark adaptation for 20 min. All the experimental measurements were carried out at room temperature, 27 ± 1 °C.
Acknowledgments
The authors gratefully acknowledge the Department of Science and Technology, New Delhi, India (DST/INSPIRE Fellowship/2014) for providing research grants to P.V. and M.J.A. to support this work, USIC, MKU for FTIR analysis, International Research Centre (IRC), Kalasalingam University, Krishnankoil, for XRD, CECRI, Karaikudi for TGA, and DST-PURSE, UGC-SAP program for instrumentation facility.
Supporting Information Available
The Supporting Information is available free of charge on the ACS Publications website at DOI: 10.1021/acsomega.7b00326.
EPS production in Scenedesmus sp. SB1 in normal BG-11 and under different stress conditions (Table S1); ANOVA table showing the significance of IAA (B) for EPS production (Table S2); NaHCO3 (A) as a crucial factor for biomass production (Figure S1) (PDF)
The authors declare no competing financial interest.
Supplementary Material
References
- Decho A. W. Microbial exopolymer <tep-common:author-query>AQ29: Please provide a DOI number for ref 1 or indicate if one doesn&#x2019;t exist.</tep-common:author-query>secretions in ocean environments: their role(s) in food webs and marine processes. Oceanogr. Mar. Biol. Annu. Rev. 1990, 28, 73–153. [Google Scholar]
- Philippis R. D.; Vincenzini M. Exocellular polysaccharides from marine cyanobacteria and their possible applications. FEMS Microbiol. Rev. 1998, 22, 151–175. 10.1111/j.1574-6976.1998.tb00365.x. [DOI] [Google Scholar]
- Kawaguchi T.; Decho W. A. Biochemical characterization of Cyanobacterial extracellular polymers (eps) from modern marine Stromatolites (bahamas). Prep. Biochem. Biotechnol. 2000, 30, 321–330. 10.1080/10826060008544971. [DOI] [PubMed] [Google Scholar]
- Bafana A. Characterization and optimization of production of exopolysaccharide from Chlamydomonas reinhardtii. Carbohydr. Polym. 2013, 95, 746–752. 10.1016/j.carbpol.2013.02.016. [DOI] [PubMed] [Google Scholar]
- Holland A. F.; Zingmark R. G.; Dean J. M. Quantitative evidence concerning the stabilization of sediments by marine benthic diatoms. Mar. Biol. 1974, 27, 191–196. 10.1007/BF00391943. [DOI] [Google Scholar]
- Dade W. B.; Davis J. D.; Nichols P. D.; et al. Effects of bacterial exopolymer adhesion on the entrainment of sand. Geomicrobiol. J. 1990, 8, 1–16. 10.1080/01490459009377874. [DOI] [Google Scholar]
- Yallop M. L.; Winder B. D.; Paterson D. M.; Stal L. J. Comparative structure, primary production and biogenic stabilization of cohesive and non-cohesive sediments inhabited by microphytobenthos. Estuarine, Coastal Shelf Sci. 1994, 39, 565–582. 10.1016/S0272-7714(06)80010-7. [DOI] [Google Scholar]
- Paterson D. M.Biological Mediation of Sediment Erodibility: Ecology and Physical Dynamics. In Cohesive Sediments; Burt N., Parker R., Watts J., Eds.; Wiley: Chichester, 1997; pp 215–229. [Google Scholar]
- Lordan S.; Ross R.; Stanton C. Marine bioactives as functional food ingredients potential to reduce the incidence of chronic diseases. Mar. Drugs 2011, 9, 1056–1100. 10.3390/md9061056. [DOI] [PMC free article] [PubMed] [Google Scholar]
- Raza W.; Yang W.; Jun Y.; Shakoor F.; Huang Q.; Shen Q. Optimization and characterization of a polysaccharide produced by Pseudomonas fluorescens WR-1 and its antioxidant activity. Carbohydr. Polym. 2012, 90, 921–929. 10.1016/j.carbpol.2012.06.021. [DOI] [PubMed] [Google Scholar]
- Gerbersdorf S. U.; Westrich B.; Paterson D. M. Microbial extracellular polymeric substances (EPS) in fresh water sediments. Microb. Ecol. 2009, 58, 334–349. 10.1007/s00248-009-9498-8. [DOI] [PubMed] [Google Scholar]
- Chisti Y. Biodiesel from microalgae. Biotechnol. Adv. 2007, 25, 294–306. 10.1016/j.biotechadv.2007.02.001. [DOI] [PubMed] [Google Scholar]
- Sutherland I. W. Microbial Polysaccharides from Gram-Negative Bacteria. Int. Dairy J. 2001, 11, 663–674. 10.1016/S0958-6946(01)00112-1. [DOI] [Google Scholar]
- Kumar A. S.; Mody K.; Jha B. Bacterial Exopolysaccharides-A Perception. J. Basic Microbiol. 2007, 47, 103–117. 10.1002/jobm.200610203. [DOI] [PubMed] [Google Scholar]
- Merchuk J. C.; Ronen M.; Giris S.; Arad S. Light/dark cycles in the growth of the red microalgae Porphyridium sp.. Biotechnol. Bioeng. 1998, 59, 705–713. . [DOI] [PubMed] [Google Scholar]
- Levasseur M.; Thompson P. A.; Harrison P. J. Physiological acclimation of marine phytoplankton to different nitrogen sources. J. Phycol. 1993, 29, 587–595. 10.1111/j.0022-3646.1993.00587.x. [DOI] [Google Scholar]
- Rotem A.; Merchuk J. C.; Arad S. Inhibition of the growth of red alga Porphyridium sp. by limitation of nutrient transfer. J. Chem. Technol. Biotechnol. 1992, 55, 263–267. 10.1002/jctb.280550310. [DOI] [Google Scholar]
- Mahesh S.; Desalegn T.; Alemayehu M. Evaluation of photosynthetic microbial fuel cell for bioelectricity production. Indian J. Energy 2013, 2, 2278–9278. [Google Scholar]
- Strik D. P. B. T. B.; Terlouw H.; Hamelers H. V. M.; Buisman C. J. N. Renewable sustainable biocatalyzed electricity production in a photosynthetic algal microbial fuel cell (PAMFC). Appl. Microbiol. Biotechnol. 2008, 81, 659–668. 10.1007/s00253-008-1679-8. [DOI] [PubMed] [Google Scholar]
- Limoli D. H.; Jones C. J.; Wozniak D. J. Bacterial extracellular polysaccharides in biofilm formation and function. Microbiol. Spectrum 2015, 3, 1–30. 10.1128/microbiolspec.MB-0011-2014. [DOI] [PMC free article] [PubMed] [Google Scholar]
- Lewin R. A. Extracellular polysaccharides of green algae. Can. J. Microbiol. 1956, 2, 665–672. 10.1139/m56-079. [DOI] [Google Scholar]
- Chakraborty T.; Sen A. K.; Pal R. Chemical characterization and the stress induced changes of the extracellular polysaccharide of the marine cyanobacterium, Phormidium tenue. J. Algal Biomass Utln. 2012, 3, 11–20. [Google Scholar]
- Song M.; Pei H.; Hu W.; Zhang S.; Maa G.; Han L.; Ji Y. Identification and characterization of a freshwater microalga Scenedesmus SDEC-8 for nutrient removal and biodiesel production. Bioresour. Technol. 2014, 162, 129–135. 10.1016/j.biortech.2014.03.135. [DOI] [PubMed] [Google Scholar]
- Rossi F.; Philippis R. D. Role of Cyanobacterial Exopolysaccharides in phototrophic biofilms and in complex. Life 2015, 5, 1218–1238. 10.3390/life5021218. [DOI] [PMC free article] [PubMed] [Google Scholar]
- Chakraborty T.; Sen A. K.; Pal R. Stress induced enhancement in exo-polysaccharide production in Spirulina subsalsa and its chemical characterization. J. Algal Biomass Utln. 2015, 6, 24–38. [Google Scholar]
- Nouha K.; Yan S.; Tyagi R. D.; Surampalli R. Y. J. Pet. Environ. Biotechnol. 2015, 7, 255. 10.4172/2157-7463.1000255. [DOI] [Google Scholar]
- Christenson L.Algal Biofilm Production and Harvesting System for Wastewater Treatment with Biofuels By-Products. All Graduate Theses and Dissertations, 2011. [Google Scholar]
- Chen B.; Li F.; Liu N.; Ge F.; Xizo H.; Yang Y. Role of extracellular polymeric substances from Chlorella vulgaris in the removal of ammonium and orthophosphage under the stress of cadmium. Bioresour. Technol. 2015, 190, 299–306. 10.1016/j.biortech.2015.04.080. [DOI] [PubMed] [Google Scholar]
- Seedevi P.; Sudarsan S.; Kumar V.; Srinivasan A.; Vairamani S.; Shanmugam A. Isolation and characterization of sulphated polysaccharides from Codium tomentosum (J. Stackhouse, 1797) collected from southeast coast of India. Adv. Appl. Sci. Res. 2013, 5, 72–77. [Google Scholar]
- Mishra A.; Kavita K.; Jha B. Characterization of extracellular polymeric substances produced by micro-algae Dunaliella salina. Carbohydr. Polym. 2011, 83, 852–857. 10.1016/j.carbpol.2010.08.067. [DOI] [Google Scholar]
- Fabian U. O.; Nneka V. C.; James C. O. Effect of some phytohormones on growth characteristics of Chlorella sorokiniana IAM-C212 under photoautotrophic conditions. Afr. J. Biotechnol. 2015, 14, 2367–2376. 10.5897/AJB2015.14641. [DOI] [Google Scholar]
- Use of Plant Growth Regulators to Enhance Algae Growth for the Production of Added Value Products. U.S. Patent US 20100210002 A1.
- Velea S.; Ilie L.; Filipescu L. Optimization of Porphyridium purpureum culture growth using two variables, experimental design: light and sodium bicarbonate. U.P.B. Sci. Bull., Ser. B 2011, 73, 81–94. [Google Scholar]
- Razaghi A.; Godhe A.; Albers E. Effects of nitrogen on growth and carbohydrate formation in Porphyridium cruentum. Cent. Eur. J. Biol. 2014, 9, 156–162. 10.2478/s11535-013-0248-z. [DOI] [Google Scholar]
- Arad S. M.; Lerental Y. B.; Dubinsky O. Effect of nitrate and sulfate starvation on polysaccharide production in Rhodella reticulate. Bioresour. Technol. 1992, 42, 141–148. 10.1016/0960-8524(92)90073-7. [DOI] [Google Scholar]
- White D. A.; Pagarette A.; Rooks P.; Ali S. T. The effect of sodium bicarbonate supplementation on growth and biochemical composition of marine microalgae cultures. J. Appl. Phycol. 2013, 25, 153–165. 10.1007/s10811-012-9849-6. [DOI] [Google Scholar]
- Arad S. M.; Friedman O. D.; Rotem A. Effect of Nitrogen on polysaccharide production in Porphyridium sp.. Appl. Environ. Microbiol. 1988, 54, 2411–2414. [DOI] [PMC free article] [PubMed] [Google Scholar]
- Fabregas J.; Abalde J.; Cabezas B.; Herrero C. Changes in protein, carbohydrates and gross energy in the marine microalgae Dunaliella tertiolecta (Butcher) by nitrogen concentration as nitrate, nitrite and urea. Aquac. Eng. 1989, 8, 223–239. 10.1016/0144-8609(89)90011-3. [DOI] [Google Scholar]
- Kaplan D.; Richmond E.; Dubinsky Z.; Aaronson A.. Algal nutrition. In Handbook for Microalgal Mass Culture; Richmond A., Ed.; CRC Press: Boca Raton, Florida, 1986; pp 147. [Google Scholar]
- Tadros M. G.; Johansen J. R. Physiological characterization of six lipid-producing diatoms from southeastern Unites Stated. J. Phycol. 1988, 24, 445–452. 10.1111/j.1529-8817.1988.tb04246.x. [DOI] [Google Scholar]
- Li Y.; Horsman M.; Wang B.; Wu N.; Lan C. Q. Effects of nitrogen sources on cell growth and lipid accumulation of green alga Neochloris oleoabundans. Appl. Microbiol. Biotechnol. 2008, 81, 629–636. 10.1007/s00253-008-1681-1. [DOI] [PubMed] [Google Scholar]
- Gu H.; Nagle N.; Pienkos P. T.; Posewitz M. C. Nitrogen recycling from fuel-extracted algal biomass: residuals as the sole nitrogen source for culturing Scenedesmus acutus. Bioresour Technol. 2015, 184, 153–160. 10.1016/j.biortech.2014.11.095. [DOI] [PubMed] [Google Scholar]
- Amin S. A.; Hmelo L. R.; van Tol H. M.; Durham B. P.; Carlson L. T.; Heal K. R.; et al. Interaction and signalling between a cosmopolitan phytoplankton and associated bacteria. Nature 2015, 522, 98–101. 10.1038/nature14488. [DOI] [PubMed] [Google Scholar]
- Ramanan R.; Kim B. H.; Cho D. H.; Oh H. M.; Kim H. S. Algae–bacteria interactions: evolution, ecology and emerging applications. Biotechnol. Adv. 2016, 34, 14–29. 10.1016/j.biotechadv.2015.12.003. [DOI] [PubMed] [Google Scholar]
- Li H.; Li J.; Dou W.; Shi J.; Xu Z. Enhancing the production of novel exopolysaccharide by Bacillus mucilaginosus CGMCC5766 using statistical experiment design. Trop. J. Pharm. Res. 2013, 12, 711–718. 10.4314/tjpr.v12i5.8. [DOI] [Google Scholar]
- Joshi M.; Patel H.; Gupte S.; Gupte A. Nutrient improvement for simultaneous production of exopolysaccharide and mycelial biomass by submerged cultivation of Schizophyllum commune AGMJ-1 using statistical optimization. 3 Biotech 2013, 3, 307–318. 10.1007/s13205-012-0103-3. [DOI] [PMC free article] [PubMed] [Google Scholar]
- Wu Y.; Guan K.; Wang Z.; Xu B.; Zhao F. Isolation, Identification and characterization of an electrogenic microalgae strain. PLoS One 2013, 8, e73442 10.1371/journal.pone.0073442. [DOI] [PMC free article] [PubMed] [Google Scholar]
- Hasan K.; Cevik E.; Sperling E.; Packer M. A.; Leech D.; Gorton L. Photoelectrochemical wiring of Paulschulzia pseudovolvox (algae) to osmium polymer modified electrodes for harnessing solar energy. Adv. Energy Mater. 2015, 5, 1501100 10.1002/aenm.201501100. [DOI] [Google Scholar]
- Zou Y.; Pisciotta J.; Billmyre R. B.; Baskakov I. V. Photosynthetic microbial fuel cells with positive light response. Biotechnol. Bioeng. 2009, 104, 939–946. 10.1002/bit.22466. [DOI] [PubMed] [Google Scholar]
- Bombelli P.; Muller T.; Herling T. W.; Howe C. J.; Knowles T. P. J. A High power-density, mediator-free, microfluidic biophotovoltaic device for cyanobacterial cells. Adv. Energy Mater. 2015, 5, 1–6. 10.1002/aenm.201401299. [DOI] [PMC free article] [PubMed] [Google Scholar]
- Rippka R.; Deruelles J.; Waterbury J. B.; Herdman M.; Stanier R. Y. Generic assignments, strain histories and properties of pure cultures of cyanobacteria. Microbiology 1979, 111, 1–61. 10.1099/00221287-111-1-1. [DOI] [Google Scholar]
- Karpagam R.; Preeti R.; Jawaharraj K.; Saranya S.; Ashokkumar B.; Varalakshmi P. Fatty acid biosynthesis from a new isolate meyerella sp. n4: molecular characterization, nutrient starvation, and fatty acid profiling for lipid enhancement. Energy Fuels 2015, 29, 143–149. 10.1021/ef501969a. [DOI] [Google Scholar]
- Hu C. W.; Chuang L. T.; Yu P. C.; Chen C. N. Pigment production by a new thermotolerant microalga Coelastrella sp. F50. Food Chem. 2013, 138, 2071–2078. 10.1016/j.foodchem.2012.11.133. [DOI] [PubMed] [Google Scholar]
- Jain R.; Raghukumar S.; Tharanathan R.; Bhosle N. B. Extracellular polysaccharide production by thraustochytrid protists. Mar. Biotechnol. 2005, 7, 184–192. 10.1007/s10126-004-4025-x. [DOI] [PubMed] [Google Scholar]
- Dubois M.; Gilles K. A.; Hamilton J. K.; Rebers P. A.; Smith F. Colorimetric method for the determination of sugars and related substances. Anal. Chem. 1956, 28, 350–356. 10.1021/ac60111a017. [DOI] [PubMed] [Google Scholar]
- Mishra A.; Jha B. Isolation and characterization of extracellular polymeric substances from micro-algae Dunaliella salina under salt stress. Bioresour. Technol. 2009, 100, 3382–3386. 10.1016/j.biortech.2009.02.006. [DOI] [PubMed] [Google Scholar]
- Beeley J. G.Glycoprotein and Proteoglycan Techniques. Laboratory Techniques in Bochemistry and Molecular Biology, 1st ed.; Elsevier: Netherlands, 1985. [Google Scholar]
- Ricou P.; Pinel E.; Juhasz N.. Temperature Experiments for Improved Accuracy in the Calculation of Polyamide-11 Crystallinity by X-ray Diffraction. Advances in X-ray Analysis; International Centre for Diffraction Data, 2005. [Google Scholar]
Associated Data
This section collects any data citations, data availability statements, or supplementary materials included in this article.


