Abstract

Endotoxin is the major structural constituent of the outer membrane of Gram-negative bacteria, which is a great threat to human health. Herein, a sensitive electrochemical biosensor for the detection of endotoxin is established by recording the voltammetric responses of the peptide-modified electrode. The utilized peptide has a high affinity for the target endotoxin, which ensures the high selectivity of this method. After the capture of endotoxin on the electrode surface, a negatively charged layer is formed, and the electron-transfer process is significantly hindered because of the increased steric hindrance and the electrostatic repulsion. The declined electrochemical signal could be used to indicate the concentration of endotoxin. This method is simple but effective, which requires limited reagents. Another highlight of this method is its user-friendly operation. Moreover, its applicability in human blood plasma promises its great potential utility in the near future.
Introduction
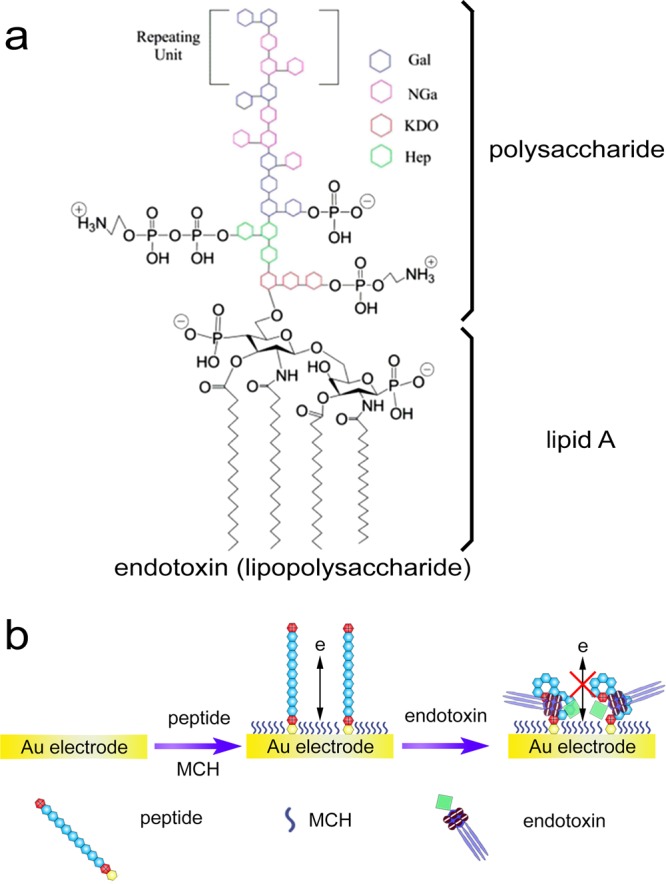
Endotoxin, commonly termed as lipopolysaccharide (LPS), is the major structural constituent of the outer membrane of Gram-negative bacteria.1,2 It comprises polysaccharide and lipid A (Scheme 1a). Lipid A moiety is of high toxicity to human beings with pyrogenic property,3 and endotoxin is highly responsible for the incidence of a diversity of human diseases such as asthma, coughing, fever, vomiting, dyspnea, diarrhea, shock, and so on.4,5 Because endotoxin can be easily released into the bloodstream during the growth of bacterial cells and cause severe human disorders, it is urgent to detect such health-threatening toxin in foodstuff and medical supplies.6−9
Scheme 1. (a) Structure of Endotoxin. Reproduced from Kalita, P.; Dasgupta, A.; Sritharan, V.; Gupta, S. Anal. Chem. 2015, 87, 11007–11012 (Ref (2)). Copyright 2015 American Chemical Society. (b) Illustration of the Peptide-Based Electrochemical Approach for the Detection of Endotoxin.
Limulus amebocyte lysate (LAL) tests are commonly used for endotoxin quantification with three main strategies including the gel-clot method,10 the turbidimetric method,11 and the chromogenic method.12 LAL reagents are an aqueous extract of blood cells produced from the horseshoe crab. After the reaction with endotoxin, obvious signals are generated, which is due to the concentration of endotoxin. To achieve higher sensitivities, more LAL reagent-based assays have been developed such as elastography method,13 quartz crystal microbalance sensor,14 and electrochemical sensor.15 However, all of these endotoxin detection methods rely on LAL reagents, which have many disadvantages including false affirmative responses and limited horseshoe crab sources.16
So far, significant efforts have been directed toward the development of LAL reagent-free analytical methods. For instance, aptamer is a specific single-stranded DNA that interacts with different targets having certain nanostructures.17,18 Su et al. made use of aptamers as the recognition element, which showed high affinity for endotoxin in the fabrication of an impedance biosensor.19 Paul et al. employed cetyltrimethylammonium bromide-capped gold nanospheres for fluorimetric sensing of endotoxin, utilizing the electrostatic interaction between nanomaterials and endotoxin that might enhance the fluorescence intensity.20 Nieradka et al. developed a microcantilever array biosensor for the sensitive detection of endotoxin with the help of a monoclonal antibody.21 Ding et al. prepared polymyxin B-immobilized gold electrodes to recognize and detect endotoxin using electrochemical impedance spectroscopy (EIS).22 Jiang et al. designed living cells to probe endotoxin, which could activate the expression of fluorescent protein, and an optical biosensor was thus established.23
Besides, peptides can also be used as an alternative recognition element.24 Endotoxin-binding peptides have been exploited recently.25 The peptides can not only neutralize the toxicity of endotoxin, blocking the induced inflammatory responses for sepsis treatment,26 but also have the potential to be used as specific ligands to develop various fast and reliable detection methods for endotoxin.27 Phage display is the standard technique for screening specific binding peptides to target molecules. The phage display library contains different phage clones that encode different peptides or proteins.28 In 2005, Kim et al. selected two peptides, AWLPWAK and NLQEFLF, by biopanning on endotoxin-conjugated epoxy beads. The two peptides were found to interact with the polysaccharide moiety of endotoxin,29 which could be used for the detection of Gram-negative bacteria.30 Guo and Chen then implemented several modifications to regular phage display procedure and selected another two peptides, ASFPPAF and SSHTISF, with improved binding affinity.31 Later, Matsumoto et al. obtained the peptide named Li5-001 (KNYSSSISSIHAC), which showed a high binding capacity to endotoxin with the Kd value of 10 nM.32 They also tried to modify the sequence of Li5-001 by replacing and deleting amino acids, and they found that the obtained peptide Li5-017 (KNYSSSISSIHC) had a higher endotoxin binding affinity.33
In this article, we have referenced the peptide with a high binding affinity and developed an electrochemical method for the detection of endotoxin in complex biological samples. The working principle of the detection method is illustrated in Scheme 1b. Gold electrode is used as the working electrode. The peptide is first immobilized onto the electrode surface through the chemical adsorption of the C-terminal cysteine residue.34 A positively charged interface derived from the other residues is thus formed after the treatment with mercaptohexanol (MCH). A negatively charged electrochemical species, Fe(CN)63–/4–, can easily get across to the electrode and generate electrochemical signals. However, after the specific interaction between the peptide and endotoxin, the electron-transfer process is significantly hindered because of the increased steric hindrance and the abundant negative charges of endotoxin that repel Fe(CN)63–/4–. By comparing differential pulse voltammetry (DPV) responses, the endotoxin concentration could be quantitatively determined.
Results and Discussion
EIS is first used for the characterization of the modified electrode in different steps using the redox probe of Fe(CN)63–/4–. In a typical Nyquist plot, the semicircle portion observed at higher frequencies is related to the electron-transfer-limiting process, and the linear portion at lower frequencies is related to the diffusion process. As shown in Figure 1, when the electrode was modified with the peptide and then MCH, a small semicircle appears, whereas a straight line is exhibited in the case of bare electrode. After the capture of a negatively charged endotoxin, the electron-transfer resistance increases owing to the steric hindrance and electrostatic repulsive force to Fe(CN)63–/4– anions, which can be reflected by the significantly enlarged semicircle portion. From the EIS curves, molecular assembly events are well-confirmed.
Figure 1.
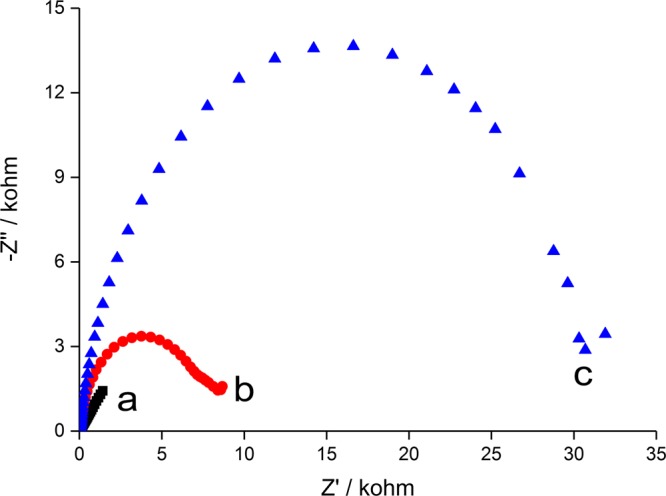
Nyquist plots corresponding to (a) bare gold electrode, (b) peptide-modified electrode, and (c) after interacting with endotoxin (10 EU/mL).
DPV is then employed to investigate the different stages of the electrode modification. As shown in Figure 2, a large current peak of Fe(CN)63–/4– is observed at bare electrode, indicating an excellent electron-transfer efficiency. With the immobilization of peptide and MCH, the peak decreases slightly because of the balance of steric hindrance and electrostatic attraction force to the electrochemical species. In the next step, endotoxin is specially attached on the electrode surface via the interaction between the peptide and endotoxin. There has been a notable decrease in the peak current because of the combined effects of steric hindrance and electrostatic repulsive force. These results confirm the successful immobilization of different molecules on the electrode surface during the experimental procedures.
Figure 2.
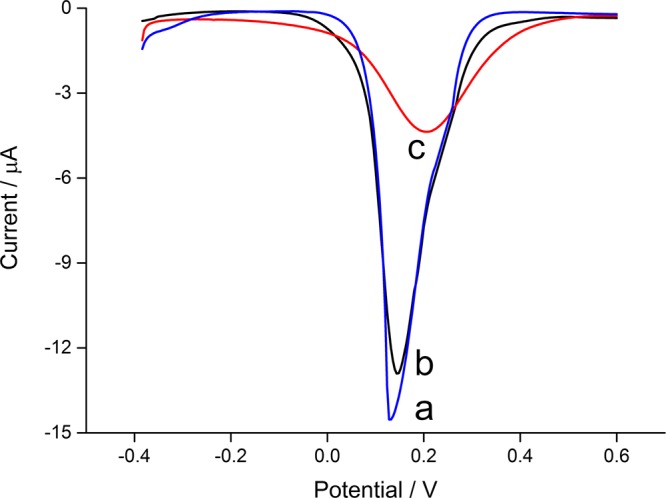
DPV curves corresponding to (a) bare gold electrode, (b) peptide-modified electrode, and (c) after interacting with endotoxin (10 EU/mL).
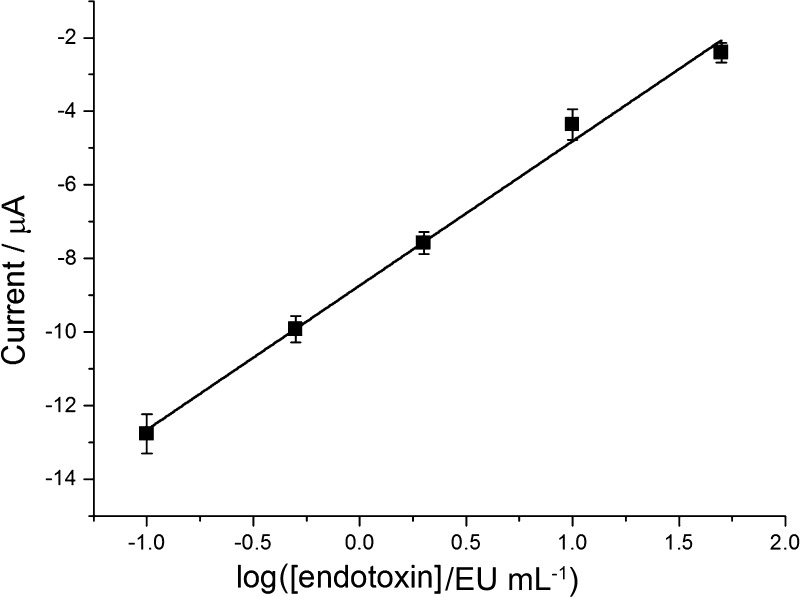
The performance of this electrochemical biosensor for the endotoxin assay at different concentrations and its repeatability are evaluated. For selective capture, peptide with high affinity is chosen as the recognition element, and the DPV peak current is used to indicate the level of endotoxin. Figure 3 shows the DPV spectra of the electrochemical biosensor incubated with different amounts of endotoxin: 0, 0.1, 0.5, 2, 10, and 50 EU/mL (from bottom to top). The calibration plot of the peak current versus the concentration of endotoxin is depicted in Figure 4 with the equation y = −8.740 + 3.923x (R2 = 0.994, n = 3), in which y is the DPV peak current and x is the logarithmic endotoxin concentration.
Figure 3.
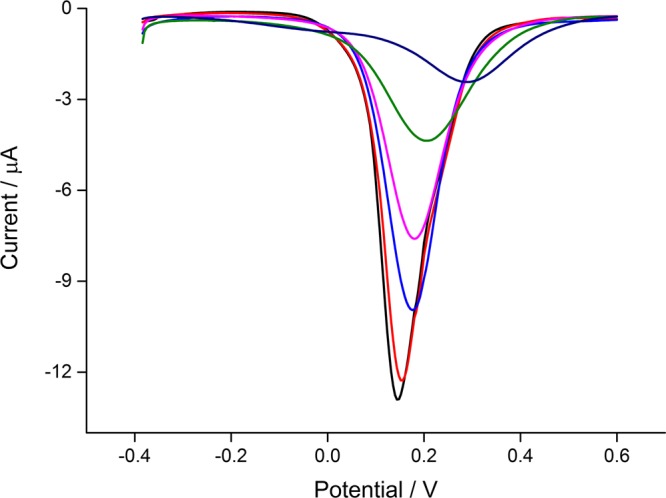
DPV curves of the peptide-modified electrode after interacting with different amounts of endotoxin (0, 0.1, 0.5, 2, 10, and 50 EU/mL, from bottom to top).
Figure 4.
Calibration curve representing the relationship between the DPV peak current and the logarithmic endotoxin concentration (the error bars display standard deviations of three independent measurements).
As shown in the plot (Figure 4), the peak current is proportional to the endotoxin level over the range 0.1–50 EU/mL, and the limit of detection is calculated to be 0.04 EU/mL at 3σ based on the standard deviation of the blank signal (n = 3). The comparison results of the analytical performances of the developed biosensor with some other reported methods are given in Table 1. The limit of detection is among the lowest, and the linear range is quite wide. Moreover, after being stored at 4 °C for 1 month, the peptide-modified electrode will still be suitable for accurate detection of endotoxin, which demonstrates the high stability of the proposed electrochemical biosensor.
Table 1. Comparison between the Proposed Method and Other Reported Sensors for Endotoxin Detection.
| technique | mechanism | limit of detection (EU/mL) | ref/kit |
|---|---|---|---|
| DPV | Boc-Val-Pro-Arg-p-nitroanilide hydrolyzation | 1 | (35) |
| pyrogen | rabbit pyrogen test | 0.5 | (36) |
| amperometry | competitive assay | 0.07 | (37) |
| EIS | endotoxin-neutralizing protein | 0.03 | (38) |
| magnetoelastic sensor | viscosity change of LAL | 0.0105 | (39) |
| ELISA | end point fluorescent microplate assay | 0.05 | EndoLISA |
| turbidimetry | kinetic turbidimetric LAL assay | 0.01 | Lonza BioScience |
| colorimetry | end point chromogenic LAL assay | 0.1 | Thermo Scientific |
| colorimetry | end point chromogenic LAL assay | 0.05 | Sigma |
| DPV | peptide-based recognition | 0.04 | this work |
Attempts are further made to evaluate the analytical features in real samples by employing Dulbecco’s modified Eagle’s medium (DMEM) and human blood plasma samples for endotoxin tests. The samples are first spiked with different amounts of endotoxin (2, 4, and 8 EU/mL), which are then used to interact with the peptide-modified electrode. DPV spectra are recorded. After comparing the peak current with the established standard curve, the endotoxin concentrations are calculated, which are listed in Table 2. The recoveries are among 97.5 and 103.5%. The relative errors are smaller than 5.6%, demonstrating excellent repeatability and accuracy in real samples. All of these results promise great potential practical applications.
Table 2. Results of Endotoxin Determination in Real Samples.
| samples | spiked (EU/mL) | amount recovered (EU/mL) | recovery (%) | relative error (%) |
|---|---|---|---|---|
| DMEM | 2 | 1.95 ± 2.7 | 97.5 | 5.53 |
| 4 | 4.14 ± 4.3 | 103.5 | 4.15 | |
| 8 | 7.90 ± 4.6 | 98.8 | 2.33 | |
| blood plasma | 2 | 2.07 ± 2.1 | 103.5 | 4.06 |
| 4 | 4.12 ± 4.2 | 103.0 | 4.08 | |
| 8 | 8.13 ± 4.8 | 101.6 | 2.36 |
Conclusions
In summary, we have presented herein a simple and cost-effective electrochemical approach for endotoxin biosensing. Proof-of-concept DPV experiments reveal that endotoxin levels could be readily distinguished. The dynamic range of the method is from 0.1 to 50 EU/mL with a limit of detection as low as 0.04 EU/mL. Because the chosen peptide has high affinity for endotoxin, interference can be inhibited, and this method is suitable for endotoxin detection in real biological samples, which has been proved by the experimental results. This developed endotoxin biosensor may have potential applications in testing the cell culture medium, pharmaceutical products, and bacterial contaminations in drinking water and environmental water.
Experimental Section
Materials and Chemicals
LAL reagents, standard endotoxin, endotoxin-free pipet tips, and water were purchased from Chinese Horseshoe Crab Reagent Manufactory Co., Ltd. (Xiamen, China). Bovine serum albumin (BSA), glucose, 1-3-β-d-glucan, tris(2-carboxyethyl)phosphine hydrochloride (TCEP), MCH, and ethylenediaminetetraacetic acid were purchased from Sigma-Aldrich (USA). MgCl2 and CaCl2 were purchased from Sinopharm Chemical Reagent Co, Ltd. (China). Immunoglobulin G was obtained from Sino Biological Inc. (China). DMEM was obtained from Gibco (Gaithersburg, USA). Peptide (K-Li5) with the sequence of KKNYSSSISSIHC was synthesized and purified by China Peptides Co., Ltd. (Shanghai, China). Human blood samples were obtained from healthy volunteers in the local hospital (Suzhou, China). The other chemicals or reagents were of analytical grade as received.
Instrumentation
Electrochemical experiments were carried out on a CHI 660D electrochemical workstation (CH instruments, China). A traditional three-electrode system was employed, which consisted of an Ag/AgCl reference electrode, a platinum wire counter electrode, and a modified gold working electrode (2 mm diameter). EIS was performed in 5 mM Fe(CN)63–/4– with 1 M KCl with the following parameters: bias potential, 0.232 V; amplitude, 5 mV; frequency range, 0.1–100 000 Hz. DPV was carried out in 5 mM Fe(CN)63–/4– with 1 M KCl. Parameters were as follows: initial potential, −0.4 V; final potential, 0.6 V; potential increment, 5 mV; amplitude, 50 mV; pulse width, 200 ms; and pulse period, 500 ms.
Electrode Pretreatment and Peptide Modification
Before the peptide modification, the substrate gold electrode was cleaned according to a previously reported literature.40 Briefly, the electrode was first immersed in piranha solution (98% H2SO4:30% H2O2 = 3:1) for about 5 min (Caution: Piranha solution reacts violently with organic solvents and should be handled with great care!). Next, the electrode was polished on P5000 sandpaper and then 1, 0.3, and 0.05 μm alumina slurry. After that, it was rinsed with pure water and then incubated in ethanol and pure water during ultrasonication for 5 min, respectively. Afterward, the electrode was soaked in 50% HNO3 for 30 min and then electrochemically cleaned in 0.5 M H2SO4. Subsequently, it was rinsed with pure water and dried with N2. To modify the peptide on the gold electrode surface, the peptide (K-Li5) was first dissolved in DMSO and was diluted to be 0.2 mM with N-(2-hydroxyethyl)piperazine-N′-ethanesulfonic acid (HEPES) (20, 10 mM TCEP, and pH 6.0). The pretreated electrode was immersed in the above peptide solution for 12 h at room temperature followed by the treatment of 0.1 M MCH for 0.5 h, which could help the formation of a well-aligned peptide monolayer. Subsequently, the electrode was rinsed using 0.2 M NaOH prepared with 95% ethanol to remove any absorbed endotoxin.
Endotoxin Analysis
Standard endotoxin was dissolved using endotoxin-free water and swirled for 1 min. Then, it was diluted to a series of concentrations. A 50 μL of standard endotoxin was mixed with 50 μL of buffer solution (20 mM Tris-HCl, 150 mM NaCl, and pH 7.5), which was then dipped onto the surface of the peptide-modified gold electrode. After 1 h, buffer solution (20 mM Tris-HCl, 150 mM NaCl, 0.1% Tween-20, and pH 7.5) was used to rinse the electrode. After being dried with N2, DPV was conducted.
Real Sample Assay
DMEM and human blood plasma were used as real samples. DMEM was diluted four times. Human blood sample was collected using a dedicated anticoagulation collection tube, which was then centrifuged at 3000g for 1 min. The obtained blood plasma was diluted 10 times using the buffer (50 mM Tris-HCl and pH 7.5), which was then heated to 70 °C for 10 min. After cooling to room temperature, the diluted DMEM and blood plasma were spiked with different amounts of endotoxin. Subsequently, the samples were detected using the proposed electrochemical method.
Acknowledgments
This work was supported by the National Natural Science Foundation of China (grant nos. 31400847 and 31400850), the Science and Technology Program of Suzhou (SYG201605), and the Postdoctoral Innovative Talents Program (BX201600184).
The authors declare no competing financial interest.
References
- Raetz C. R. H.; Whitfield C. Annu. Rev. Biochem. 2002, 71, 635–700. 10.1146/annurev.biochem.71.110601.135414. [DOI] [PMC free article] [PubMed] [Google Scholar]
- Kalita P.; Dasgupta A.; Sritharan V.; Gupta S. Anal. Chem. 2015, 87, 11007–11012. 10.1021/acs.analchem.5b02957. [DOI] [PubMed] [Google Scholar]
- Niemetz J.; Morrison D. C. Blood 1977, 49, 947–956. [PubMed] [Google Scholar]
- Karaghiosoff M.; Steinborn R.; Kovarik P.; Kriegshäuser G.; Baccarini M.; Donabauer B.; Reichart U.; Kolbe T.; Bogdan C.; Leanderson T.; Levy D.; Decker T.; Müller M. Nat. Immunol. 2003, 4, 471–477. 10.1038/ni910. [DOI] [PubMed] [Google Scholar]
- Yamagata K.; Matsumura K.; Inoue W.; Shiraki T.; Suzuki K.; Yasuda S.; Sugiura H.; Cao C.; Watanabe Y.; Kobayashi S. J. Neurosci. 2001, 21, 2669–2677. [DOI] [PMC free article] [PubMed] [Google Scholar]
- Uzarski J. R.; Mello C. M. Anal. Chem. 2012, 84, 7359–7366. 10.1021/ac300987h. [DOI] [PubMed] [Google Scholar]
- Nasir M. Z. M.; Pumera M. Electroanalysis 2015, 27, 924–928. 10.1002/elan.201400470. [DOI] [Google Scholar]
- Nasir M. Z. M.; Pumera M. Electroanalysis 2014, 26, 1901–1904. 10.1002/elan.201400174. [DOI] [Google Scholar]
- Miao P. RSC Adv. 2013, 3, 9606–9617. 10.1039/c3ra00047h. [DOI] [Google Scholar]
- Hausmann M. J.; Yulzari R.; Lewis E.; Saisky Y.; Douvdevani A. Nephrol., Dial., Transplant. 2000, 15, 680–683. 10.1093/ndt/15.5.680. [DOI] [PubMed] [Google Scholar]
- Novitsky T. J.; Roslansky P. F.; Siber G. R.; Warren H. S. J. Clin. Microbiol. 1985, 21, 211–216. [DOI] [PMC free article] [PubMed] [Google Scholar]
- Tsuji K.; Martin P. A.; Bussey D. M. Appl. Environ. Microbiol. 1984, 48, 550–555. [DOI] [PMC free article] [PubMed] [Google Scholar]
- Sun H.; Miao P.; Tang Y.; Wang B.; Qian J.; Wang D. Analyst 2015, 140, 4374–4378. 10.1039/c5an00734h. [DOI] [PubMed] [Google Scholar]
- Liu T.; Zhang W.; Zhou L.; Guo Z.; Tang Y.; Miao P. Anal. Chim. Acta 2017, 961, 106–111. 10.1016/j.aca.2017.01.014. [DOI] [PubMed] [Google Scholar]
- Miao P.; Han K.; Qi J.; Zhang C.; Liu T. Electrochem. Commun. 2013, 26, 29–32. 10.1016/j.elecom.2012.10.002. [DOI] [Google Scholar]
- Sun J.; Ge J.; Liu W.; Wang X.; Fan Z.; Zhao W.; Zhang H.; Wang P.; Lee S.-T. Nano Res. 2012, 5, 486–493. 10.1007/s12274-012-0234-1. [DOI] [Google Scholar]
- Loo A. H.; Bonanni A.; Pumera M. ChemElectroChem 2015, 2, 743–747. 10.1002/celc.201402403. [DOI] [Google Scholar]
- Chandrasekaran A. R.; Zhuo R. Appl. Mater. Today 2016, 2, 7–16. 10.1016/j.apmt.2015.11.004. [DOI] [Google Scholar]
- Su W.; Lin M.; Lee H.; Cho M.; Choe W.-S.; Lee Y. Biosens. Bioelectron. 2012, 32, 32–36. 10.1016/j.bios.2011.11.009. [DOI] [PubMed] [Google Scholar]
- Paul I. E.; Raichur A. M.; Chandrasekaran N.; Mukherjee A. J. Lumin. 2016, 178, 106–114. 10.1016/j.jlumin.2016.05.030. [DOI] [Google Scholar]
- Nieradka K.; Kapczyńska K.; Rybka J.; Lipiński T.; Grabiec P.; Skowicki M.; Gotszalk T. Sens. Actuators, B 2014, 198, 114–124. 10.1016/j.snb.2014.03.023. [DOI] [Google Scholar]
- Ding S.-J.; Chang B.-W.; Wu C.-C.; Chen C.-J.; Chang H.-C. Electrochem. Commun. 2007, 9, 1206–1211. 10.1016/j.elecom.2006.12.029. [DOI] [Google Scholar]
- Jiang H.; Jiang D.; Shao J.; Sun X.; Wang J. Sci. Rep. 2016, 6, 36987. 10.1038/srep36987. [DOI] [PMC free article] [PubMed] [Google Scholar]
- Archibong E.; Foster A.; Caldwell K.; Lita A.; Mochona B.; Mateeva N. Appl. Mater. Today 2016, 4, 78–82. 10.1016/j.apmt.2016.07.004. [DOI] [PMC free article] [PubMed] [Google Scholar]
- Taylor A. H.; Heavner G.; Nedelman M.; Sherris D.; Brunt E.; Knight D.; Ghrayeb J. J. Biol. Chem. 1995, 270, 17934–17938. 10.1074/jbc.270.30.17934. [DOI] [PubMed] [Google Scholar]
- Iwagaki A.; Porro M.; Pollack M. Infect. Immun. 2000, 68, 1655–1663. 10.1128/iai.68.3.1655-1663.2000. [DOI] [PMC free article] [PubMed] [Google Scholar]
- Voss S.; Fischer R.; Jung G.; Wiesmüller K.-H.; Brock R. J. Am. Chem. Soc. 2007, 129, 554–561. 10.1021/ja065016p. [DOI] [PubMed] [Google Scholar]
- Smith G. P.; Petrenko V. A. Chem. Rev. 1997, 97, 391–410. 10.1021/cr960065d. [DOI] [PubMed] [Google Scholar]
- Kim Y.-G.; Lee C.-S.; Chung W.-J.; Kim E.-m.; Shin D.-S.; Rhim J.-H.; Lee Y.-S.; Kim B.-G.; Chung J. Biochem. Biophys. Res. Commun. 2005, 329, 312–317. 10.1016/j.bbrc.2005.01.137. [DOI] [PubMed] [Google Scholar]
- Kim Y.-G.; Lee C.-S.; Chung W.-J.; Kim E.-M.; Shin D.-S.; Kim J.-H.; Lee Y.-S.; Chung J.; Kim B.-G. Biotechnol. Lett. 2006, 28, 79–84. 10.1007/s10529-005-4950-4. [DOI] [PubMed] [Google Scholar]
- Guo X.; Chen R. R. Biotechnol. Prog. 2006, 22, 601–604. 10.1021/bp050315o. [DOI] [PubMed] [Google Scholar]
- Matsumoto M.; Horiuchi Y.; Yamamoto A.; Ochiai M.; Niwa M.; Takagi T.; Omi H.; Kobayashi T.; Suzuki M.-M. J. Microbiol. Methods 2010, 82, 54–58. 10.1016/j.mimet.2010.04.002. [DOI] [PubMed] [Google Scholar]
- Suzuki M. M.; Matsumoto M.; Yamamoto A.; Ochiai M.; Horiuchi Y.; Niwa M.; Omi H.; Kobayashi T.; Takagi T. J. Microbiol. Methods 2010, 83, 153–155. 10.1016/j.mimet.2010.08.009. [DOI] [PubMed] [Google Scholar]
- Cao Y.; Yu J.; Bo B.; Shu Y.; Li G. Biosens. Bioelectron. 2013, 45, 1–5. 10.1016/j.bios.2012.12.061. [DOI] [PubMed] [Google Scholar]
- Inoue K. Y.; Ino K.; Shiku H.; Matsue T. Electrochem. Commun. 2010, 12, 1066–1069. 10.1016/j.elecom.2010.05.028. [DOI] [Google Scholar]
- Hoffmann S.; Peterbauer A.; Schindler S.; Fennrich S.; Poole S.; Mistry Y.; Montag-Lessing T.; Spreitzer I.; Löschner B.; van Aalderen M.; Bos R.; Gommer M.; Nibbeling R.; Werner-Felmayer G.; Loitzl P.; Jungi T.; Brcic M.; Brügger P.; Frey E.; Bowe G.; Casado J.; Coecke S.; de Lange J.; Mogster B.; Næss L. M.; Aaberge I. S.; Wendel A.; Hartung T. J. Immunol. Methods 2005, 298, 161–173. 10.1016/j.jim.2005.01.010. [DOI] [PubMed] [Google Scholar]
- Priano G.; Pallarola D.; Battaglini F. Anal. Biochem. 2007, 362, 108–116. 10.1016/j.ab.2006.12.034. [DOI] [PubMed] [Google Scholar]
- Heras J. Y.; Pallarola D.; Battaglini F. Biosens. Bioelectron. 2010, 25, 2470–2476. 10.1016/j.bios.2010.04.004. [DOI] [PubMed] [Google Scholar]
- Ong K. G.; Leland J. M.; Zeng K.; Barrett G.; Zourob M.; Grimes C. A. Biosens. Bioelectron. 2006, 21, 2270–2274. 10.1016/j.bios.2005.11.007. [DOI] [PubMed] [Google Scholar]
- Cao Y.; Chen W.; Han P.; Wang Z.; Li G. Anal. Chim. Acta 2015, 890, 1–6. 10.1016/j.aca.2015.05.023. [DOI] [PubMed] [Google Scholar]


