Abstract
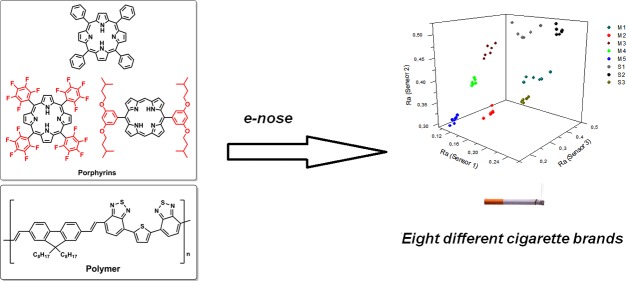
Three tobacco types (Burley, Flue Cured, and Oriental) and eight cigarette brands were unequivocally identified using an electronic nose formed by only three sensors based on a single novel conducting polymer (PF-BTB) doped with different porphyrins (H2TPP, H2TPFP, and H2BTBOP). The synthesis and characterization of the polymer are also discussed. Small changes in the porphyrin structure caused significant changes in the electrical conductance response patterns of the sensors upon exposure to complex chemical matrixes, representing a novel approach for tuning the selectivity of chemiresistive sensors for e-nose application. This e-nose is fast, cheap, reliable, can be easily operated, and could be a valuable tool for border agents fighting cigarette smuggling around the world, helping them prevent losses of millions in tax revenues and sales.
1. Introduction
Fraudulent imitation of commercial products such as cigarettes is a problem worldwide. In Brazil, the cigarette industry and the government lose yearly millions in sales and tax revenue because of such illegal activity.1 Usually, a visual inspection performed by a trained agent is not enough to identify counterfeiting, requiring an auxiliary analytical method to support an apprehension. In Brazil, the vast majority of counterfeit cigarettes enter the country via land borders and, because they are normally located in remote areas (frequently dense forests), a cheap, rapid, and portable system is necessary to help border agents in the task. Electronic noses (e-noses) come as a reasonable choice to meet all of these requirements.
e-Noses have been used to identify a great variety of analytes since their development in 1982.2 This powerful tool has assisted many fields of knowledge, from medicine to chemistry, being applied in distinct situations, such as wine-quality inspection,3 tuberculosis diagnosis,4 characterization of juices,5 and differentiation of aromatic flowers.6 Food analysis is one of the most reported in literature,7 and the reason for that lies on the fact that most products in this industry come from animal or vegetal sources, therefore containing a great variety of chemical compounds in their composition. This complexity challenges traditional analytical methods but, on the other hand, gives a perfect kind of matrix e-noses that are needed to perform a reliable differentiation.
e-Noses work with an array of sensors, each of them capable of changing its behavior differently when exposed to volatile substances released by analytes. These responses together produce a pattern that is sent to a single processing system and, to provide a good identification, it must be unique to each of the analyzed aromas.8 Sensors of different nature, relying on different chemical and physical phenomena, can play this role in the e-nose apparatus. Despite their different nature, they all aim at creating a pattern to identify the volatile compounds they are exposed to.9 Among the most popular types are polymeric sensors, composed by a doped conductive polymer layer, which is capable of changing its conductivity when exposed to organic vapors.10 Some advantages of this material are room-temperature operation, low power consumption, fast responses, high selectivity, and virtually unlimited possible polymeric structures.11 The polymeric thin film deposited on the surface of these sensors interacts with the incoming vapors, which causes a conformational change in the structure. This phenomenon affects the conductivity observed and is specific to each type of matrix analyzed, forming the physical basis for the detection of compounds.12 A further discussion of the detection mechanism has been previously published.15
Cigarette brand and tobacco analyses by e-noses have been reported in the literature using different sensors (e.g., metal oxide semiconductors and conductive polymer/carbon black)13 and other techniques;14 however, the complexity of these e-noses systems is higher when compared to the methodology discussed herein, employing 6 to 32 different sensors to perform these analyses. In a previous paper,15 we first reported a new type of composite layer to be used in e-noses: a single conductive polymer had its chemiresistive behavior modulated by chemical interaction with different porphyrins, generating independent analytical signals and, therefore, producing a rich pattern for each analyte studied. As a proof of concept, an e-nose formed by these three sensors was used for classifying four volatile organic solvents (propanone, ethanol, ethyl acetate, and toluene). To further explore this idea and solve a real analytical problem, this work was focused on testing a far more complex system, tobaccos and cigarettes, analyzing the volatile compounds released by these samples. Also, a novel conductive polymer, PF-BTB, was synthesized, characterized, and employed for this task, showing the versatility of this active layer system.
2. Results and Discussion
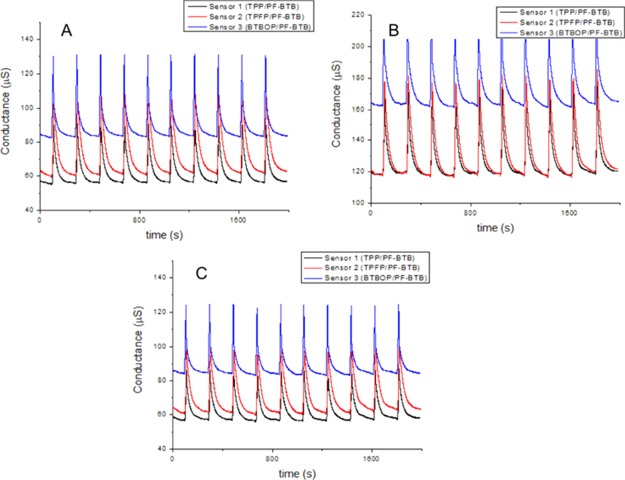
A three-sensor array was initially used to identify the three most common tobacco types produced in Brazil: Burley, Flue Cured, and Oriental. This experiment was planned to test the e-nose system and opened the possibility to more complex approaches, carried out afterward. The outputs registered in these experiments are shown in Figure 1.
Figure 1.
Conductance outputs. A: Burley; B: Flue Cured; and C: Oriental.
The data were mathematically processed to calculate the relative response (Ra) parameter to each exposure/recovery cycle for each analyzed tobacco. The Ra parameter expresses the interaction between the sensor and the volatiles released by the analyte. G1 and G2 represent, respectively, the absolute conductance measured immediately before and after the exposure (Figure 2).
Figure 2.
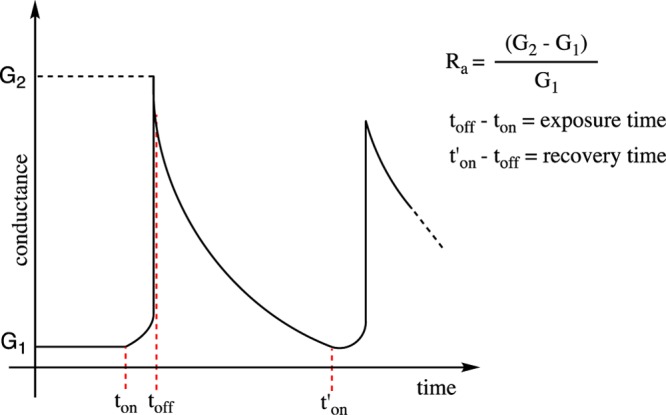
Response pattern and Ra calculation. ton = V1 and V2 on and V3 off; toff = V1 and V2 off and V3 on. For V1, V2, and V3, see Figure 11.
Calculated (Ra)s for the last six peaks in each graph, as shown in Figure 1, were plotted in a three-dimensional scatter (Figure 3), revealing three well-separated clusters that provided an outstanding classification.
Figure 3.
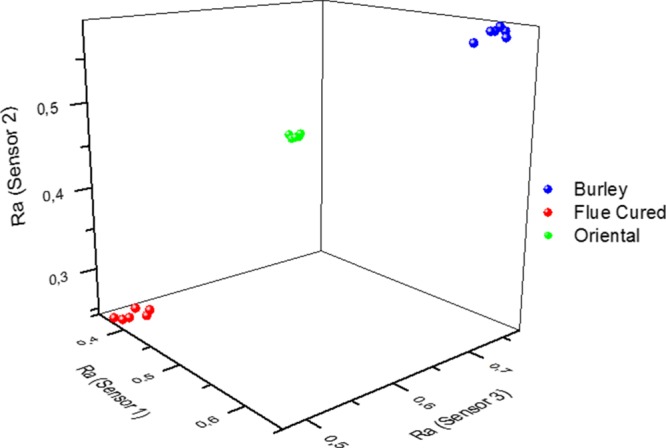
Plot of the relative responses (Ra)s for tobacco types.
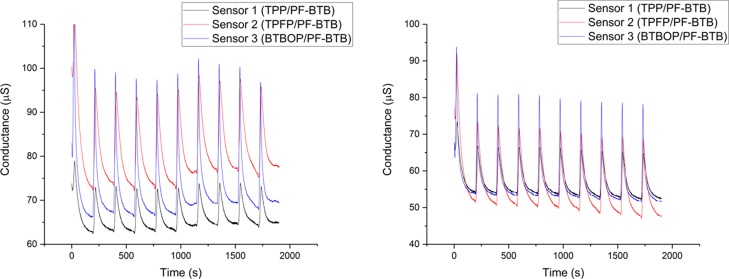
On the basis of the good selectivity observed in Figure 3, the e-nose was subjected to a more complex test: screening eight different cigarette brands (Table 1) under the same conditions. Figure 4 shows two outputs as an example (one for each supplier; please see the supporting information for the complete set of conductance outputs).
Table 1. Cigarette Brands Tested and Their Attributed Codes.
| code | brand | supplier |
|---|---|---|
| M1 | Marlboro Silver | Philip Morris |
| M2 | Marlboro Gold | Philip Morris |
| M3 | Marlboro | Philip Morris |
| M4 | Marlboro Blue Ice | Philip Morris |
| M5 | Marlboro Fresh Mint | Philip Morris |
| S1 | Dunhill | Souza Cruz |
| S2 | Lucky Strike | Souza Cruz |
| S3 | Derby | Souza Cruz |
Figure 4.
e-Nose outputs: Marlboro (left) and Lucky Strike (right).
Employing the same mathematical procedure described in Figure 2, a new three-dimensional scatter was plotted and, again, a very good clustering is observed, despite the number of brands analyzed (Figure 5).
Figure 5.
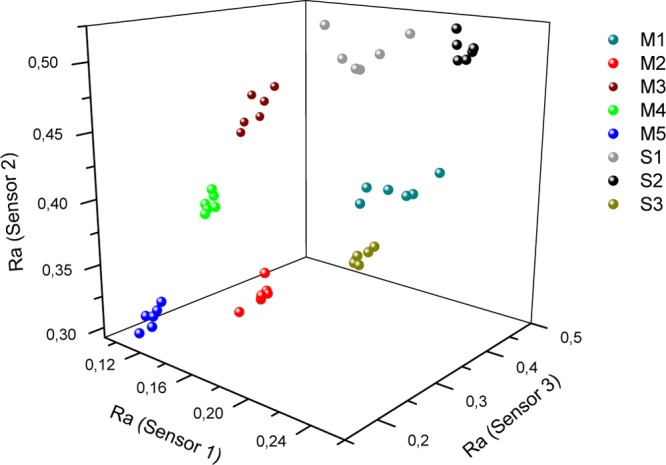
Plot of the relative responses (Ra)s for cigarette brands.
3. Conclusions
The results presented in this work showed a very efficient e-nose based on composite sensors. The scope of its application was considerably expanded from simple compounds (organic solvents) to very complex chemical matrixes, presented herein. A new conductive polymer, PF-BTB, combined in pairs with porphyrins H2TPP, H2TPFP, or H2BTBOP, generated three autonomous sensors and a fully functional e-nose array. The behavior of these pairs demonstrated their different nature, as only three distinct sensors would be capable of performing a very complicated identification involving eight chemically similar analytes (Figure 5). This result suggests an intimate molecular relationship between conductive polymers and porphyrins, showing that substitutions in these macrocyclic structures lead to substantial changes in the chemiresistive behavior of these pairs.
The analytical procedure proposed is fast, cheap, reliable and, above all, user friendly, which are all features essential to field applications carried out by border patrols fighting cigarette smuggling. The selectivity achieved broadens the application of this system to a great variety of brands and could make this method a valuable tool to differentiate genuine cigarettes from counterfeit products crossing every day national borders around the world.
4. Materials and Methods
4.1. Solvents and Reagents
Commercial grade dimethylformamide (DMF; Aldrich) was dried over anhydrous CuSO4 for 2 days and then distilled at 44–45 °C (25 mmHg) using a 40 cm Vigreux column and stored over freshly dried 4 Å molecular sieves.
Commercial grade chloroform (Synth) was heated under reflux over phosphorous pentoxide for 5 h, distilled at 58–60 °C (710 mmHg), and stored over freshly dried 4 Å molecular sieves.
Bromine (Aldrich) was shaken with concentrated H2SO4 1:1 (v/v) before use.
All other commercial chemicals were used as received (Aldrich).
4.2. Synthesis of PF-BTB
Poly(9,9-n-octyl-2,7-fluorenylenevinylene-alt-4,7-dibenzothiadiazole-2,5-thiophene), PF-BTB (5), was designed to be a low band gap polymer containing fluorene, thiophene, and 2,1,3-benzothiadiazole units, which have previously successfully produced low band gap polymers in similar structures.16 The synthesis was carried out via Heck polymerization, following the synthetic pathway, as shown below (Scheme 1).
Scheme 1. Synthetic Route toward PF-BTB.
4-Bromo-2,1,3-benzothiadiazole (1),17 2,5-bis(tri-n-butylstannyl)thiophene (2),18 and 9,9-dioctyl-2,7-divinyl-9H-fluorene (4) were synthesized according to literature procedures.16b
4.2.1. 2,5-Bis(benzo[c][1,2,5]thiadiazole-4-yl)thiophene (3)
A solution containing 2,5-bis(tri-n-butylstannyl)thiophene (2) (1.44 g, 2.17 mmol), 4-bromo-2,1,3-benzothiadiazole 94% (1) (1.00 g, 4.37 mmol), PdCl2(PPh3)2 (0.03 g, 0.05 mmol), and anhydrous tetrahydrofuran (20 mL) was stirred under reflux for 5 h. The resulting mixture was washed with distilled water, and the aqueous phase was extracted three times with CH2Cl2. The organic phase was dried over MgSO4 and evaporated under vacuum. The residue was purified by flash-column chromatography with (3:2 n-hexane/CHCl3) as eluent to afford 0.680 g (1.92 mmol) of an orange solid (η = 88%). mp 180–183 °C (188–189 °C19).
1H NMR (200 MHz, CDCl3): δ 8.18 (s, 2H), 7.90–7.94 (m, 4H), 7.62 (t, J = 8.8 Hz, 2H).
13C NMR (100 MHz, CDCl3): δ 155.6, 152.2, 140.5, 129.7, 128.8, 127.4, 125.5, 120.4.
4.2.2. Polymerization (PF-BTB) (5)
Br2 (34 μL, 0.67 mmol) dissolved in CHCl3 was added dropwise to a stirred solution of 2,5-bis(benzo[c][1,2,5]thiadiazole-4-yl)thiophene (3) (0.10 g, 0.28 mmol), FeCl3 (0.90 mg, 5.6 μmol), and CHCl3 (10 mL). The mixture was refluxed for 5 h, forming the brominated monomer BTB as an insoluble orange solid that was filtrated, washed with distilled water, and dried under vacuum overnight [1H NMR (200 MHz, CDCl3): δ 8.17 (s, 2H), 7.90 (d, J = 7.6 Hz, 2H), 7.79 (d, J = 7.6 Hz, 2H)]. Then, (0.10 g, 0.19 mmol) of this product was added without further purification to a reaction vessel containing 9,9-dioctyl-2,7-divinyl-9H-fluorene (4) (0.08 g, 0.19 mmol), P(o-tol)3 (0.03 g, 0.10 mmol), Pd(OAc)2 (3.8 mg, 0.02 mmol), triethylamine (1 mL), and 8 mL of anhydrous DMF. The mixture was degassed with anhydrous N2 and heated to 90 °C for 48 h. The polymer was precipitated by adding 80 mL of methanol, filtrated, and dried under vacuum. The solid was washed, in sequence, with methanol and hexane for 1 h each using a Soxhlet apparatus. The liquids were discarded, and then the resulting solid was extracted thoroughly with chloroform during 24 h. The chloroform was evaporated affording 0.09 g of a black solid (η = 43% over two steps). Gel permeation chromatography analysis using polystyrene as the standard revealed that the weight-average molecular weight for PF-BTB is 2.9 kDa.
4.3. Characterization of PF-BTB
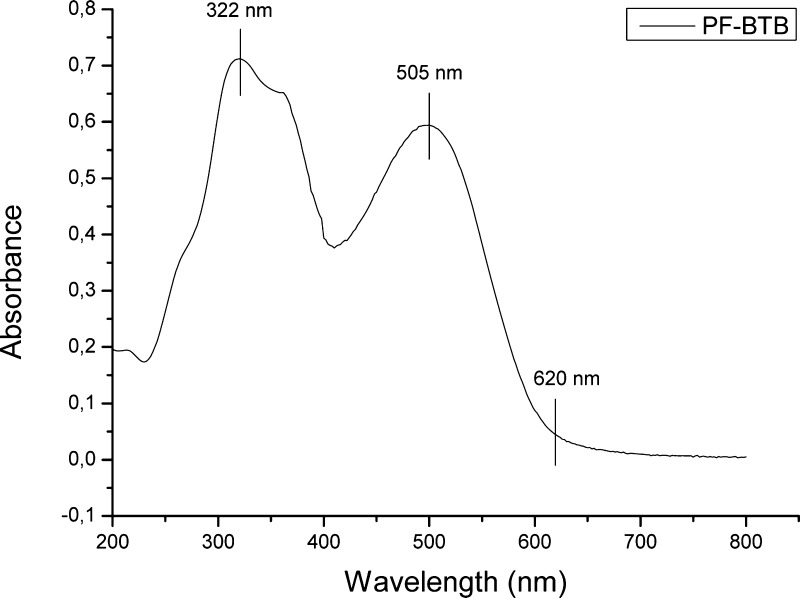
The polymer was initially characterized by UV–vis spectroscopy using a dilute chloroform solution (6 mg/L) (Figure 6).
Figure 6.
PF-BTB UV–vis absorption spectrum in chloroform solution.
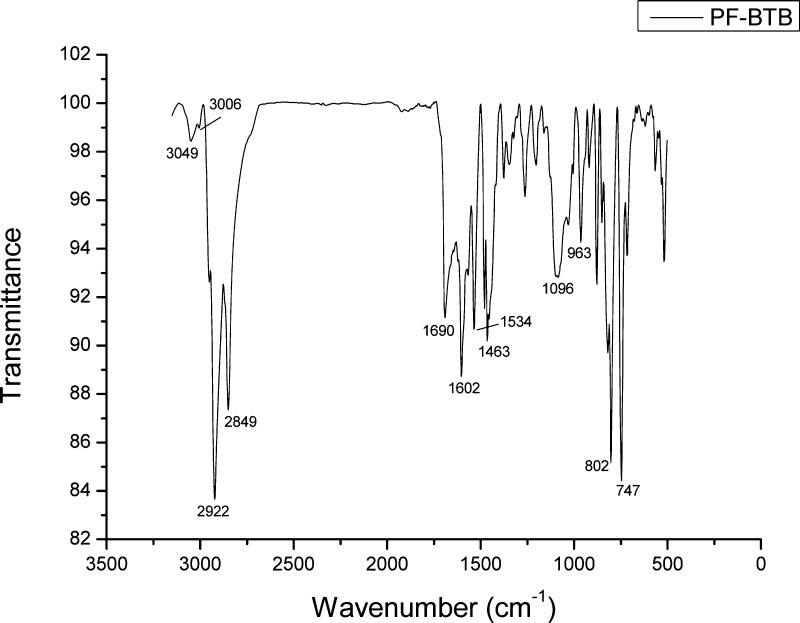
The absorption spectrum shows two strong bands: the first one at 250–400 nm, representing πdelocalized–πlocalized* and πlocalized–πdelocalized transitions, and the second one in the 425–620 nm range, representing π–π* transitions for π electron states delocalized along the polymer chain.20 The polymer optical band gap (Eg) estimated from the absorption edge is 2.0 eV (620 nm).
The infrared spectrum was registered using KBr pellets and is shown in Figure 7. The tentative assignment of the most significant bands is listed in Table 2.
Figure 7.
PF-BTB Infrared spectrum in KBr pellets.
Table 2. PF-BTB Infrared Bands Assignmenta.
| experimental bands (cm–1) | literature data17,21 (cm–1) | assignment |
|---|---|---|
| 3049 | 3047 | νC–H aromatic OP |
| 3006 | 3024 | νC–H trans-vinyl OP |
| 2922 | 2920 | νaliphatic |
| 2849 | 2852 | νaliphatic |
| 1690 | 1679 | νC=N (benzothiadiazole) |
| 1602 | 1594 | νC=C aromatic |
| 1534 | 1561 | νC=C aromatic |
| 1463 | 1423 | νC=C aromatic |
| 1096 | 1108 | δC–H aromatic IP |
| 963 | 965 | δC–H trans-vinyl IP |
| 802 | 837 | δC–H aromatic OP |
| 747 | 784 | unknown |
IP = in-plane, OP = out-of-plane.
The bands at 963 and 3006 cm–1 reveal that the Heck polymerization formed trans-double bonds between the two monomeric units in PF-BTB.
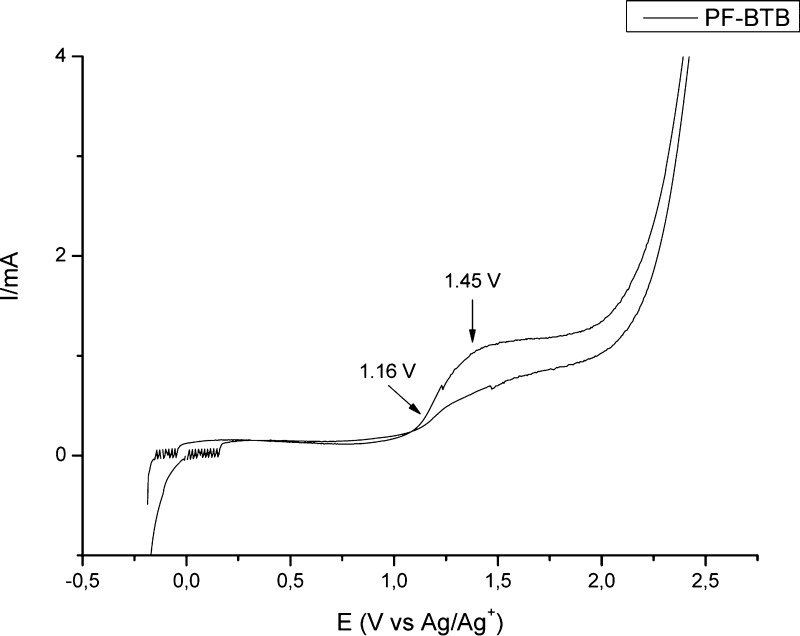
A PF-BTB sample was casted onto an indium tin oxide-coated glass electrode which was used as the working electrode in a cyclic voltammetry experiment performed in a 0.2 M solution of LiClO4 in acetonitrile at a scan rate of 50 mV/s, from −0.2 to 2.5 V, using a Pt wire as the counter electrode and Ag/Ag+ as the reference electrode. Figure 8 shows a well-defined oxidation peak starting at 1.16 V [highest occupied molecular orbital (HOMO) energy] with a maximum at 1.45 V. Using the optical band gap, the reduction potential can be estimated at −0.84 V [lowest unoccupied molecular orbital (LUMO) energy].
Figure 8.
PF-BTB cyclic voltammetry in acetonitrile solution, using 0.2 M solution of LiClO4 the as support electrolyte, at a scan rate of 50 mV/s.
4.4. Porphyrins Syntheses
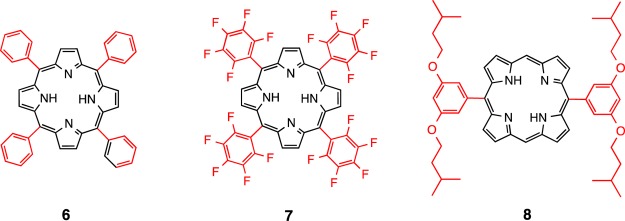
meso-Tetra(phenyl)porphyrin (H2TPP) (6),22meso-tetra(2,3,4,5,6-pentafluorophenyl)porphyrin (H2TPFP) (7),23 and 5,15-({3,5-bis(isopentyloxy)benzene}porphyrin) (H2BTBOP) (8)24 (Figure 9) were synthesized according to literature procedures.
Figure 9.
Synthesized porphyrins, H2TPP (6), H2TPFP (7), and H2BTBOP (8).
4.5. Sensors Preparation
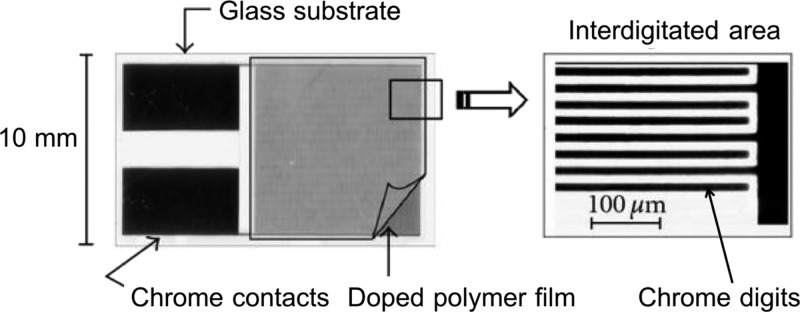
Stock solutions containing 2.5 mg of PF-BTB, 0.72 μmol of each free-base porphyrin (H2TPP, H2BTBOP, or H2TPFP), and 0.75 mL of chloroform were prepared. These solutions (20 μL) were deposited by spin-coating onto interdigitated electrodes (1 cm2, 18 μm gap between digits),16c,25 generating polymeric films of ≈1 μm thickness (Figure 10). The sensors were used over 1 week, showing no signs of decomposition or significant decrease in the conductivity observed.
Figure 10.
(25)Structure of the interdigitated sensor.
4.6. e-Nose Apparatus
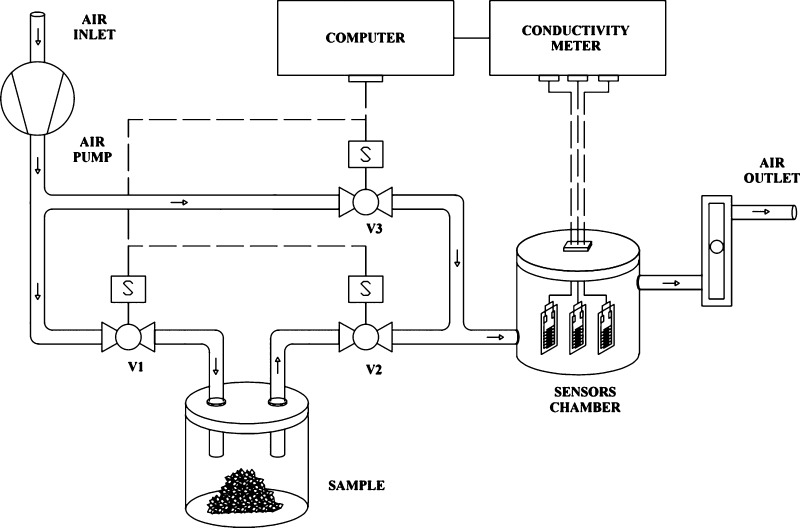
The e-nose system for dynamic sampling used in this work was entirely built in our laboratory and is shown, as a schematic representation, in Figure 11. A complete measure cycle is composed by an exposure phase (valves 1 and 2 open and valve 3 closed), when the sample headspace is carried to the sensors’ chamber, and a recovery phase (valves 1 and 2 closed and valve 3 open), when ambient air passes through the sensors. Each analyte was kept in the sample compartment at 30 °C during the whole experiment, and the airflow was maintained at 0.6 L·min–1. For all analytes, the exposure (10 s)/recovery (180 s) cycle was repeated 10 times, and the four initial peaks were disconsidered. The conductance was registered by a conductivity meter,26 operating with 80 mV peak-to-peak 2 kHz triangle wave ac voltage, and connected via a 10-bit analog-to-digital converter to a personal computer. The sensors do not require any type of cleaning or preparation between samples.
Figure 11.
Schematic view of the e-nose measuring system.
4.7. Sample Preparation
Burley, Flue Cured, and Oriental tobacco leaves, subjected to the same postharvest processing, were obtained from a national producer from Vale do Rio Pardo region, state of Rio Grande do Sul, Brazil, and grinded until the resulting aspect matched the tobacco found in cigarettes. All cigarettes were obtained from local suppliers, and the tobacco contained in a single cigarette was removed and placed in the sample’s container for each measurement.
Acknowledgments
The authors thank Conselho Nacional de Desenvolvimento Científico e Tecnológico (CNPq) (443625/2014-0, 132622/2011-4, 303717/2010-6, and 307915/2013-1) and Fundação de Amparo à Pesquisa do Estado de São Paulo (FAPESP) (2011/51249-3) for their financial support; Dr. Gustavo P. Rehder and Prof. Marcelo N. P. Carreño for the interdigitated electrodes; and Daniel Kuhn, Eduardo M. Ethur, and Taciélen Altmayer for the tobacco samples.
Supporting Information Available
The Supporting Information is available free of charge on the ACS Publications website at DOI: 10.1021/acsomega.8b00403.
Conductance versus time for all of the cigarette brands tested (PDF)
Author Present Address
⊥ Departamento de Farmácia, Faculdade de Ciências Farmacêuticas, Universidade de São Paulo, 05508-000 São Paulo, SP, Brazil.
The authors declare no competing financial interest.
Supplementary Material
References
- Brazilian Federal Police , 2008; Annual Report.
- Persaud K.; Dodd G. Analysis of discrimination mechanisms in the mammalian olfactory system using a model nose. Nature 1982, 299, 352–355. 10.1038/299352a0. [DOI] [PubMed] [Google Scholar]
- a Macías M. M.; Manso A. G.; Orellana C. J. G.; Velasco H. M. G.; Caballero R. G.; Chamizo J. C. P. Acetic Acid Detection Threshold in Synthetic Wine Samples of a Portable Electronic Nose. Sensors 2013, 13, 208–220. 10.3390/s130505528. [DOI] [PMC free article] [PubMed] [Google Scholar]; b Berna A. Z.; Trowell S.; Cynkar W.; Cozzolino D. Comparison of metal oxide-based electronic nose and mass spectrometry-based electronic nose for the prediction of red wine spoilage. J. Agric. Food Chem. 2008, 56, 3238–3244. 10.1021/jf7037289. [DOI] [PubMed] [Google Scholar]
- Bruins M.; Rahim Z.; Bos A.; van de Sande W. W. J.; Endtz H. P.; van Belkum A. Diagnosis of active tuberculosis by e-nose analysis of exhaled air. Tuberculosis 2013, 93, 232–238. 10.1016/j.tube.2012.10.002. [DOI] [PubMed] [Google Scholar]
- Qiu S.; Wang J.; Gao L. Discrimination and Characterization of Strawberry Juice Based on Electronic Nose and Tongue: Comparison of Different Juice Processing Approaches by LDA, PLSR, RF, and SVM. J. Agric. Food Chem. 2014, 62, 6426–6434. 10.1021/jf501468b. [DOI] [PubMed] [Google Scholar]
- Wali R. P. An electronic nose to differentiate aromatic flowers using a real-time information-rich piezoelectric resonance measurement. Procedia Chem. 2012, 6, 194–202. 10.1016/j.proche.2012.10.146. [DOI] [Google Scholar]
- a Loutfi A.; Coradeschi S.; Mani G. K.; Shankar P.; Rayappan J. B. B. Electronic noses for food quality: a review. J. Food Eng. 2015, 144, 103–111. 10.1016/j.jfoodeng.2014.07.019. [DOI] [Google Scholar]; b Severini C.; Ricci I.; Marone M.; Derossi A.; De Pilli T. Changes in the Aromatic Profile of Espresso Coffee as a Function of the Grinding Grade and Extraction Time: A Study by the Electronic Nose System. J. Agric. Food Chem. 2015, 63, 2321–2327. 10.1021/jf505691u. [DOI] [PubMed] [Google Scholar]; c Rizzolo A.; Bianchi G.; Vanoli M.; Lurie S.; Spinelli L.; Torricelli A. Electronic Nose to Detect Volatile Compound Profile and Quality Changes in ‘Spring Belle’ Peach (Prunus persica L.) during Cold Storage in Relation to Fruit Optical Properties Measured by Time-Resolved Reflectance Spectroscopy. J. Agric. Food Chem. 2013, 61, 1671–1685. 10.1021/jf302808g. [DOI] [PubMed] [Google Scholar]; d Arroyo T.; Lozano J.; Cabellos J. M.; Gil-Diaz M.; Santos J. P.; Horrillo C. Evaluation of Wine Aromatic Compounds by a Sensory Human Panel and an Electronic Nose. J. Agric. Food Chem. 2009, 57, 11543–11549. 10.1021/jf902109y. [DOI] [PubMed] [Google Scholar]; e Echeverría G.; Correa E.; Ruiz-Altisent M.; Graell J.; Puy J.; Lopez L. Characterization of Fuji Apples from Different Harvest Dates and Storage Conditions from Measurements of Volatiles by Gas Chromatography and Electronic Nose. J. Agric. Food Chem. 2004, 52, 4582. 10.1021/jf040262a. [DOI] [PubMed] [Google Scholar]
- Smyth H.; Cozzolino D. Instrumental Methods (Spectroscopy, Electronic Nose, and Tongue) As Tools to Predict Taste and Aroma in Beverages: Advantages and Limitations. Chem. Rev. 2013, 113, 1429–1440. 10.1021/cr300076c. [DOI] [PubMed] [Google Scholar]
- Falasconi M.; Concina I.; Gobbi E.; Sberveglieri V.; Pulvirenti A.; Sberveglieri G. Electronic Nose for Microbiological Quality Control of Food Products. Int. J. Electrochem. 2012, 2012, 715763. 10.1155/2012/715763. [DOI] [Google Scholar]
- James D.; Scott S. M.; Ali Z.; O’Hare W. T. Chemical Sensors for Electronic Nose Systems. Microchim. Acta 2005, 149, 1–17. 10.1007/s00604-004-0291-6. [DOI] [Google Scholar]
- Péres L. O.; Gruber J. The use of block copolymers containing PPV in gas sensors for electronic noses. Mater. Sci. Eng., C 2007, 27, 67–69. 10.1016/j.msec.2006.02.006. [DOI] [Google Scholar]
- Caseli L.; Gruber J.; Li R. W. C.; Péres L. O. Investigation of the Conformational Changes of a Conducting Polymer in Gas Sensor Active Layers by Means of Polarization-Modulation Infrared Reflection Absorption Spectroscopy (PM-IRRAS). Langmuir 2013, 29, 2640–2645. 10.1021/la3050797. [DOI] [PubMed] [Google Scholar]
- a Luo D.; Hosseini H. G.; Stewart J. R. Application of ANN with extracted parameters from an electronic nose in cigarette brand identification. Sens. Actuators, B 2004, 99, 253–257. 10.1016/j.snb.2003.11.022. [DOI] [Google Scholar]; b Brudzewski K.; Osowski S.; Golembiecka A. Differential electronic nose and support vector machine for fast recognition of tobacco. Expert Syst. Appl. 2012, 39, 9886–9891. 10.1016/j.eswa.2012.02.163. [DOI] [Google Scholar]; c Haddi Z.; Amari A.; Alami H.; El Bari N.; Llobet E.; Bouchikhi B. A portable electronic nose system for the identification of cannabis-based drugs. Sens. Actuators, B 2011, 155, 456–463. 10.1016/j.snb.2010.12.047. [DOI] [Google Scholar]; d Brudzewski K.; Osowski S.; Ulaczyk J. Differential electronic nose of two chemo sensor arrays for odor discrimination. Sens. Actuators, B 2010, 145, 246–249. 10.1016/j.snb.2009.12.005. [DOI] [Google Scholar]
- a Zook C. M.; Patel P. M.; LaCourse W. R.; Ralapati S. Characterization of Tobacco Products by High-Performance Anion Exchange Chromatography–Pulsed Amperometric Detection. J. Agric. Food Chem. 1996, 44, 1773–1779. 10.1021/jf950723f. [DOI] [Google Scholar]; b Ng L.-K.; Lafontaine P.; Vanier M. Characterization of Cigarette Tobacco by Direct Electrospray Ionization–Ion Trap Mass Spectrometry (ESI-ITMS) Analysis of the Aqueous Extract: A Novel and Simple Approach. J. Agric. Food Chem. 2004, 52, 7251–7257. 10.1021/jf040203x. [DOI] [PubMed] [Google Scholar]; c Zhang L.; Wang X.; Guo J.; Xia Q.; Zhao G.; Zhou H.; Xie F. Metabolic Profiling of Chinese Tobacco Leaf of Different Geographical Origins by GC-MS. J. Agric. Food Chem. 2013, 61, 2597–2605. 10.1021/jf400428t. [DOI] [PubMed] [Google Scholar]; d Xia B.; Feng M.; Xu G.; Xu J.; Li S.; Chen X.; Ding L.; Zhou Y. Investigation of the Chemical Compositions in Tobacco of Different Origins and Maturities at Harvest by GC–MS and HPLC–PDA-QTOF-MS. J. Agric. Food Chem. 2014, 62, 4979–4987. 10.1021/jf5009204. [DOI] [PubMed] [Google Scholar]
- Esteves C. H. A.; Iglesias B. A.; Li R. W. C.; Ogawa T.; Araki K.; Gruber J. Identification of organic solvents using a new composite porphyrin-conductive polymer gas sensor. Sens. Actuators, B 2013, 193, 136–141. 10.1016/j.snb.2013.11.022. [DOI] [Google Scholar]
- a Xu S.; Liu Y.; Li J.; Wang Y.; Cao S. Synthesis and characterization of low-band-gap conjugated polymers containing phenothiazine and benzo-2,1,3-thia-/seleno-diazole. Polym. Adv. Technol. 2010, 21, 663–668. 10.1002/pat.1487. [DOI] [Google Scholar]; b Pei J.; Wen S.; Zhou Y.; Dong Q.; Liu Z.; Zhang J.; Tian W. A low band gap donor-acceptor copolymer containing fluorene and benzothiadiazole units: synthesis and photovoltaic properties. New J. Chem. 2011, 35, 385–393. 10.1039/c0nj00378f. [DOI] [Google Scholar]; c Cordeiro J. R.; Li R. W. C.; Takahashi E. S.; Rehder G. P.; Ceccantini G.; Gruber J. Wood identification by a portable low-cost polymer-based electronic nose. RSC Adv. 2016, 6, 109945–109949. 10.1039/c6ra22246c. [DOI] [Google Scholar]; d Bundgard E.; Krebs F. C. Low-Band-Gap Conjugated Polymers Based on Thiophene, Benzothiadiazole, and Benzobis(thiadiazole). Macromolecules 2006, 39, 2823–2831. 10.1021/ma052683e. [DOI] [Google Scholar]
- Pilgram K.; Zupan M.; Skiles R. Bromination of 2,1,3-Benzotiadiazoles. J. Heterocycl. Chem. 1970, 3, 629–633. 10.1002/jhet.5570070324. [DOI] [Google Scholar]
- Wei Y.; Yang Y.; Yeh J.-M. Synthesis and Electronic Properties of Aldehyde End-capped Thiophene Oligomers and Other α,ω-Substituted Sexthiophene. Chem. Mater. 1996, 8, 2659–2666. 10.1021/cm960182p. [DOI] [Google Scholar]
- Zimdars S.; Langhals H.; Knochel P. Functionalization of the [c][1,2,5]thiazole Scafold via Mg-, Zn- and Mn-Intermediates. Synthesis 2011, 8, 1302–1308. 10.1055/s-0030-1259966. [DOI] [Google Scholar]
- Bradley D. D. C. Precursor-route poly(p-phenylenevinylene): polymer characterization and control of electronic properties. J. Phys. D: Appl. Phys. 1987, 20, 1389–1410. 10.1088/0022-3727/20/11/007. [DOI] [Google Scholar]
- Mancilha F. S.; Neto B. A. D.; Lopes A. S.; Moreira P. F. Jr.; Quina F. H.; Gonçalves R. S.; Dupont J. Are Molecular 5,8-π-Extended Quinoxaline Derivatives Good Chromophores for Photoluminescence Applications. Eur. J. Org. Chem. 2006, 4924–4933. 10.1002/ejoc.200600376. [DOI] [Google Scholar]
- Lindsey J. S.; Schreiman I. C.; Hsu H. C.; Kearney P. C.; Marguerettaz A. M. Rothemund and Adler-Longo Reactions Revisited: Synthesis of Tetraphenylporphyrins under Equilibrium Conditions. J. Org. Chem. 1987, 52, 827–836. 10.1021/jo00381a022. [DOI] [Google Scholar]
- Chen X.; Hui L.; Foster D. A.; Drain C. M. Efficient synthesis and photodynamic activity of porphyrin-saccharide conjugates: targeting and incapacitating cancer cells. Biochemistry 2004, 43, 10918–10929. 10.1021/bi049272v. [DOI] [PMC free article] [PubMed] [Google Scholar]
- Littler B. J.; Ciringh Y.; Lindsey J. S. Investigation of conditions giving minimal scrambling in the synthesis of trans-porphyrins from dipyrromethanes and aldehydes. J. Org. Chem. 1999, 64, 2864–2872. 10.1021/jo982452o. [DOI] [PubMed] [Google Scholar]
- Cordeiro J. R.; Martinez M. I. V.; Li R. W. C.; Cardoso A. P.; Nunes L. C.; Krug F. J.; Paixão T. R. L. C.; Nomura C. S.; Gruber J. Identification of four wood species by an electronic nose and by LIBS.. Int. J. Electrochem. 2012, 2012, 563939. 10.1155/2012/563939. [DOI] [Google Scholar]
- da Rocha R. T.; Gutz L. G. R.; do Lago C. A low-cost and high-performance conductivity meter. J. Chem. Educ. 1997, 74, 572–574. 10.1021/ed074p572. [DOI] [Google Scholar]
Associated Data
This section collects any data citations, data availability statements, or supplementary materials included in this article.


