Abstract
Human carbonic anhydrase II (HCA II) is an enzyme that catalyzes the reversible hydration of CO2 into bicarbonate (HCO3–) and a proton (H+) as well as other reactions at an extremely high rate. This enzyme plays fundamental roles in human physiology/pathology, such as controlling the pH level in cells and so on. However, the binding mechanism between apo-HCA II and CO2 or other ligands as well as related conformational changes remains poorly understood, and atomic investigation into it could promote our understanding of related internal physiological/pathological mechanisms. In this study, long-time atomic molecular dynamics simulations as well as the clustering and free-energy analysis were performed to reveal the dynamics of apo-HCA II as well as the mechanism upon ligand binding. Our simulations indicate that the crystallographic B-factors considerably underestimate the loop dynamics: multiple conformations can be adopted by loops 1 and 2, especially for loop 1 because loop 1 is one side of the binding pocket, and its left-to-right movement can compress or extend the binding pocket, leading to one inactive (closed) state, three intermediate (semiopen) states, and one active (open) state; CO2 cannot get into the binding pocket of the inactive state but can get into those of intermediate and active states. The coexistence of multiple conformational states proposes a possible conformational selection model for the binding mechanism between apo-HCA II and CO2 or other ligands, revising our previous view of its functional mechanism of conformational change upon ligand binding and offering valuable structural insights into the workings of HCA II.
Introduction
Enzymes, or proteins in general, are not static and can adopt multiple conformations, as demonstrated in three-dimensional atomic detail by the observation of structures of the same enzyme in different liganded states through X-ray crystallography and nuclear magnetic resonance (NMR) or even by the multiple conformational equilibria of an enzyme in the same liganded state revealed by NMR.1,2 It is well-known that these multiple conformational transitions are essential for ligand binding because of the conflicting structural requirements: an unbound enzyme must adopt an open conformation to allow its substrate to enter its active site to form a Michaelis complex; subsequently, to maximize transition state stabilization and prevent side reactions, the enzyme typically assumes a closed conformation, such that the substrate is buried in its active site; after the chemical reaction, the enzyme must again open up its active site to allow the product to exit.3 However, how a protein could transit from an unbound conformation to a bound conformation in a complex with a ligand, or specifically, whether an unbound enzyme can undergo large conformational changes and assume bound as well as other multiple conformations remains unknown.4−7 Insights into it will promote our understanding of protein–ligand binding, which is critical to molecular recognition as well as the drug design.8
Human carbonic anhydrase II (HCA II) has been long known as an enzyme that catalyzes the reversible hydration of CO2 into bicarbonate (HCO3–) and a proton (H+) at an extremely high rate,9−13 but its catalytic activity is not limited to the hydration of CO2: it is reported that HCA II can also catalyze the hydrolysis of 1-fluoro-2,4-dinitrobenzene14 and sulfonyl chlorides15 as well as the hydration of cyanamide to urea.16 This enzyme plays fundamental roles in human physiology/pathology: it is essential in keeping the adequate balance between carbon dioxide and bicarbonate, thus controlling the pH level in cells, and is vital to a variety of biological processes, such as vision,17 development, and function of bone,18 calcification,18 and so forth. As a cytosolic and monomeric protein with a small molecular weight of 30 kDa but multifunctions,9 it is often used as a prototypical model system for biophysical studies9,13 and medicinal chemistry applications.13,19 The 15 Å deep conical binding pocket20 (illustrated in Figure 1) is formed with 10-stranded β-sheets on one side,21 and on the other side, with the active site loop of residues 197–206 (loop 1), which has been identified to be important for ligand binding,22 especially Leu198, Thr199, and His200, which have direct contact and form hydrogen bonds with ligands;22−25 at the bottom of the pocket, a Zn2+ ion is tetrahedrally coordinated with three histidine residues (His94, 96, and 119) and a bound water/hydroxyl (H2O/OH–).26 Another loop related to ligand binding is the surface loop of residues 230–240 (loop 2), which can control the size of the entrance of the binding pocket.
Figure 1.
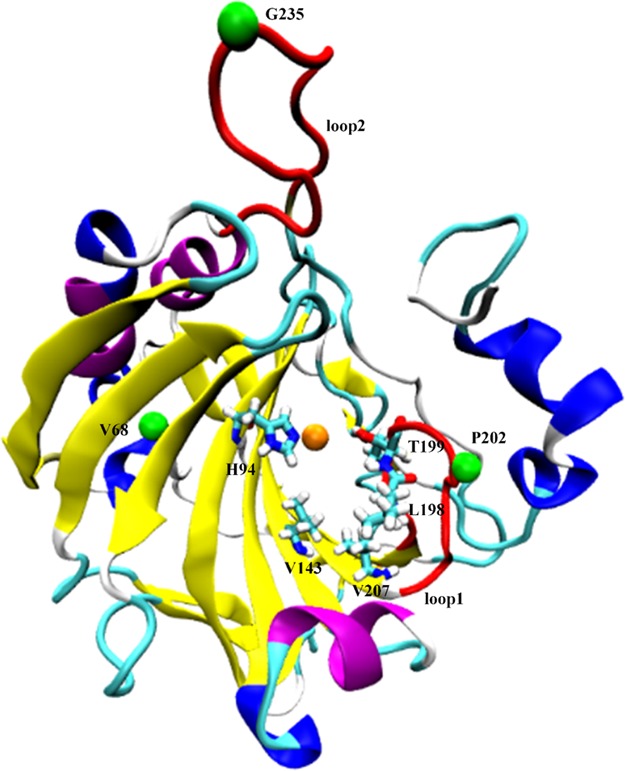
The crystal structure of apo-HCA II (PDB entry 3KS3). The zinc ions are colored orange, the loops 1 and 2 are highlighted in red, whereas residues 68, 202 and 235 are marked in green. His94, Val143, Leu198, Thr199, and Val207 are displayed as the licorice style.
The flexibility of the two loops in the apo form of the enzyme is evidenced by their higher B-factors in the crystal structure; however, in the crystal structure, the flexibility is always greatly hindered by crystal contacts between adjacent copies and lower cryogenic temperature;27−29 more importantly, the detail of their conformational changes cannot be revealed either. The conformational changes of the two loops could impact the ligand binding of the enzyme, especially for loop 1, although its B-factor values are not as large as those of loop 2, even a tiny conformational change of this loop could change the volume of the binding pocket as well as the hydrogen-bond network, which is critical to ligand binding and catalytic reactions. Therefore, in our work, conventional molecular dynamics (MD) simulations totaling 1 μs at room temperature (300 K) were applied to research the conformational transitions of apo-HCA II. Our simulations revealed multiple conformations of loops 1 and 2, including the open, semiopen, and closed conformations, thereby revising our previous view of the functional mechanism of conformational change upon CO2 or other ligand binding.
Results
Stability of the MD Trajectories
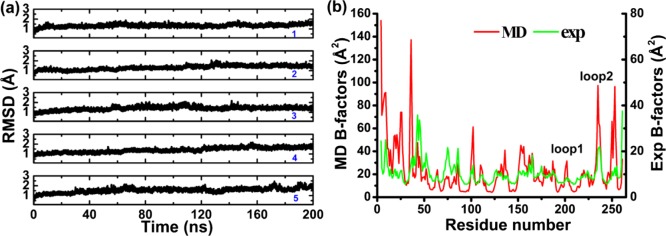
Because a stable protein structure was essential to our analysis, the root-mean-square deviation (rmsd) values were evaluated for all MD trajectories. The average rmsd value from the initial structure calculated using all Cα atoms is ∼2 Å (Figure 2a), indicating that the protein was stable during each of the 200 ns MD simulations. As measured by the B-factor values calculated for the MD trajectories (Figure 2b), loop 2 is one of the most flexible regions with its MD B-factors larger than 100 Å2; loop 1 also has a peak of MD B-factor values, revealing some large conformational change on it which, although higher than experimental values as expected (crystal contacts between adjacent copies and lower cryogenic temperature as mentioned in the Introduction section), is still well-consistent. In the simulations, the residues with the highest B-factor values in loops 1 and 2 were Pro202 and Gly235, respectively; correspondingly, Val68 is located at the edge of the protein cavity and has little mobility. Therefore, the distance between Pro202 and Val68 can be used to represent the motion of loop 1 and its opening or closing; likewise, the distance between Gly235 and Val68 can reflect the motion of loop 2 (see Figure 1).
Figure 2.
(a) Time evolution of Cα rmsds during the MD simulations and (b) the B-factor distributions derived from the MD simulations and the crystal structure.
Clustering and Conformational Network Analysis for the Trajectories
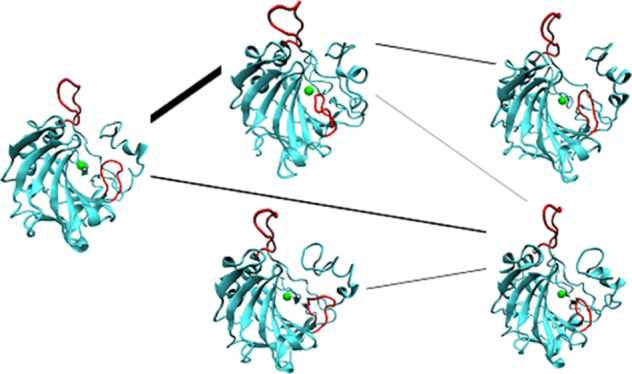
To map out the conformational states and transitions of loops 1 and 2, clustering and conformational network analyses were performed on the conformations of the two loops in the simulations, which is depicted in Figure 3. Five clusters are extracted from the MD simulations, and in them, multiple conformations of loops 1 and 2 are observed (Figure 3a); especially for loop 1, even though its B-factors are not as large as loop 2, loop 1 is one side of the binding pocket and so its movement can directly compress or extend the binding pocket, representing closed (clusters 2), semiopen (clusters 1, 3, and 4), as well as open conformations (cluster 5) of the binding pocket. For loop 2, although its B-factors are larger than loop 1, its conformations are open (clusters 1, 2, 3, and 5) or even superopen (cluster 4), keeping the entrance of the binding pocket always large enough for ligands.
Figure 3.
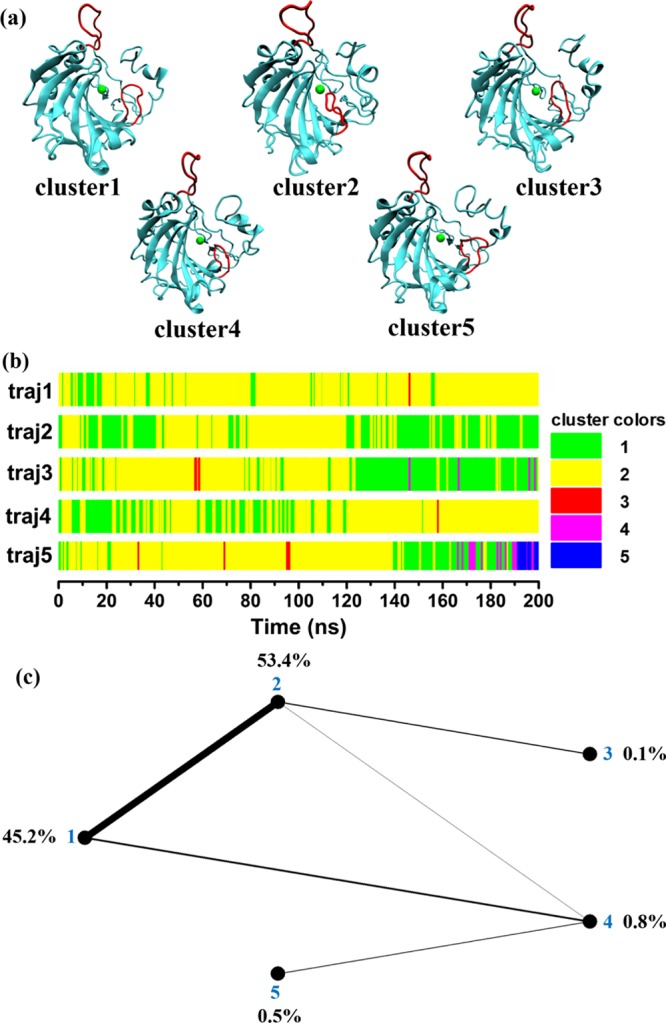
Distance root mean square (DRMS)-based clustering and network analysis of the MD simulations: (a) center structures of the clusters, (b) time evolution of the clusters, and (c) distribution and interconversion network of the clusters. In panel b, the different clusters are represented by different colors. In panel c, the relative populations of the clusters are indicated by percentage values, and the thickness of each connecting line is proportional to the corresponding frequency of interconversion.
Figure 3b shows the time series of the cluster assignments for the five trajectories. Although all trajectories start with the same initial structure belonging to cluster 1, the observed cluster types are different in different trajectories, which means that different trajectories have different conformational spaces. Clusters 1 and 2 are all included in the five trajectories, representing the broad observation of the transitions between closed and semiopen conformations of loop 1, as well as that between open and superopen conformations of loop 2; except trajectory 2, cluster 3 is present in the other four trajectories; the most dramatic conformational transitions of the two loops occur in trajectories 3 and 5, in which all the five clusters are present, which leads to multiple transitions between closed, semiopen, and open conformations of loop 1.
The occurrence percentages of these clusters and the conformational space network among them are shown in Figure 3c. Clusters 1 and 2 are dominant, with the percentages up to 45.2 and 53.4%, respectively; the other three clusters totally occupy only 1.4%. From the conformational space network, one can observe that cluster 4 is a key intermediate state: first, it provides another way from cluster 1 to 2 or vice versa; more importantly, cluster 5 connects only to cluster 4; therefore, only through cluster 4, cluster 5 can be reached by clusters 1 and 2. Because loop 1 is closed in cluster 2 while open in cluster 5, with loop 1 semiopen, cluster 4 is the intermediate state between closed and open conformations of loop 1. Another interesting cluster is cluster 3: it only has direct transitions from or to cluster 2.
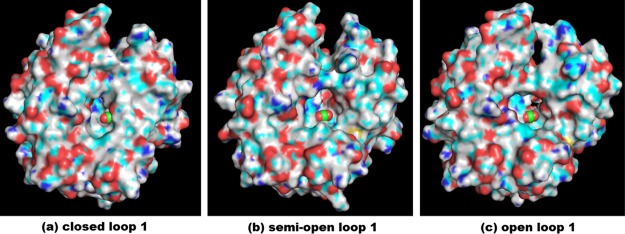
To precisely determine which conformations in our simulations are accessible to CO2 and other ligands, the experimental structure of CO2-bound HCA II (PDB entry 5DSO) and the multiple conformations of apo-HCA II from our MD simulations are aligned. As shown in Figure 4, in the closed conformations of loop 1 (Figure 4a), the entrance to the binding pocket is partially blocked, and the binding pocket is also too small to accommodate even the smallest ligand–CO2, and detailed investigation revealed that the binding pocket is occupied by His94, Val143, Leu198, Thr199, and Val207 (See Figure 1); in the semiopen conformations of loop 1, the entrance and the binding pocket are enough for CO2 entering and binding; in the open conformations, the entrance and the binding pocket are even larger, provide a possibility to accommodate and catalyze larger ligands, such as 1-fluoro-2,4-dinitrobenzene, sulfonyl chlorides, and cyanamide. Therefore, the five clusters can be identified as one inactive state (cluster 2), three intermediate states (clusters 1, 3, and 4), and one active state (cluster 5) with their percentages 53.4, 46.1, and 0.5% (see Figure 3c), which means that about one-half of the conformations from our simulations are accessible to CO2, whereas the other half are not.
Figure 4.
The alignment of the experimental structure of CO2-bound HCA II (PDB entry 5DSO) and the multiple conformations of apo-HCA II from our MD simulations: (a) closed loop 1; (b) semiopen loop 1; (c) open loop 1. With the experimental structure of the protein hidden, the graphs show the relative positions of bounded CO2 and the multiple conformations from our MD simulations. The CO2 molecule is displayed as three connected spheres with the C atom in green and the two O atoms in red, and the conformations from our simulations are in “surface” view.
The Free-Energy Landscape of Loop 1
As loop 1 is critical to ligand binding to HCA II, its two-dimensional free energy was estimated from our MD simulations and is shown in Figure 5. The Cα distance between Pro202 and Val68 was chosen as the x-coordinate, whereas the rmsd of loop 1 to the initial structure (PDB entry 3KS3) was chosen as the y-coordinate. The reason for such a choice is that the Cα distance between Pro202 and Val68 can reasonably discriminate different conformations (closed, semiopen, open) of loop 1, whereas the rmsd of loop 1 represents its conformational changes. Points representative of the central conformations of the five clusters are also shown in the graphs.
Figure 5.
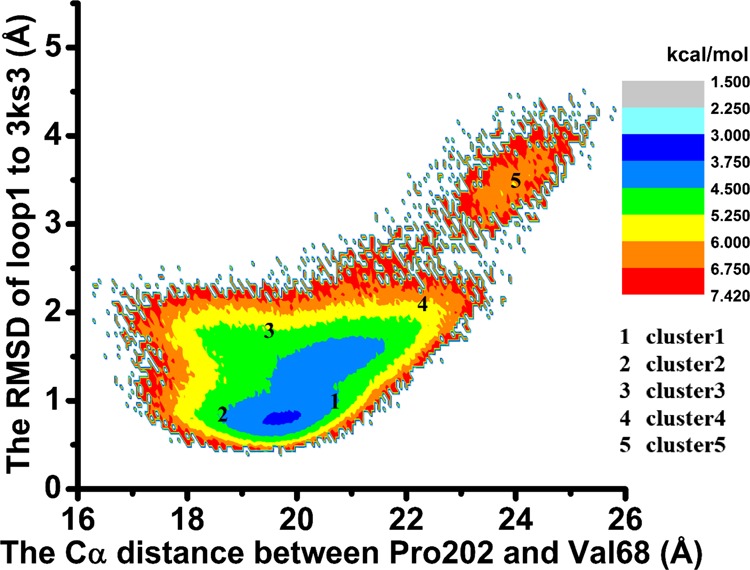
Two-dimensional free energy for loop 1 from the MD simulations. The x axis represents the Cα distance between Pro202 and Val68, whereas the y axis represents the rmsd of loop 2 to the initial structure (PDB entry 3KS3). Points representative of the central conformations of the five clusters are also shown in the graphs.
In Figure 5, clusters 1 and 2 are located at the area with lower free energies, which are consistent with those of Figure 3c; they have the largest populations. Cluster 4 is just between cluster 5 and cluster 1 or 2, thus agreeing well also with that of Figure 3c. Cluster 4 is a key intermediate state between closed and open conformations of loop 1 because the representative point of cluster 1 is closer to that of cluster 4 than cluster 2; just as shown in Figure 3c the transitions between cluster 1 and cluster 4 are more frequent than those between cluster 2 and cluster 4. Estimated from this figure, the free-energy difference between closed and open conformations of loop 1 is about 6.75–3.75 = 3 kcal/mol.
Principal Component Analysis
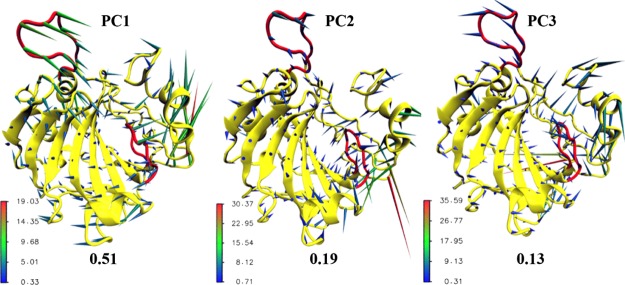
In our principal component analysis (PCA), all Cα atoms are used to define the backbone conformation of HCA II, resulting in 771 principal components from the 257 Cα atoms in the form of 771 eigenvectors and their associated eigenvalues. The validation of the PCA is certified in the Supporting Information (Table S1). Figure S2 shows that, consistent with earlier research,30 30 out of the 771 PCs (principal components) capture approximately 80% of the protein’s motion. The first three PCs, in particular, have much larger eigenvalues than the rest, and in every trajectory, they capture about 50% of the motion (see Figure S2). Hence, the first three PCs are sufficient for the analysis.
Figure 6 shows the vector-field representations of the PCs obtained from the combined data of all trajectories. The figure clearly shows that loops 1 and 2 have one of the largest motions of the protein, which is well-consistent with the B-factor graphs. From the figure, one can observe that, in the first three PCs, both loops 1 and 2 always move from left to right or vice versa; however, the consequences are quite different because loop 1 is one side the binding pocket, and such a movement can compress or extend the binding pocket; but for loop 2, it is a loop on the surface, and such a movement has little impact on the binding pocket. This is why loop 1 has closed, semiopen, and open conformations, but loop 2 has only open or superopen conformations.
Figure 6.
Vector-field representations and corresponding eigenvalues of the first three PCs obtained from the combined data of the MD trajectories.
Discussion
The Dynamics of Loops 1 and 2 of Apo-HCA II Revealed by the MD Simulations
HCA II catalyzes the reversible hydration of CO2 into HCO3– and a H+ at an extremely high rate, thus playing very fundamental roles in human physiology/pathology, such as controlling the pH level in cells. Besides that, HCA II can also catalyze the hydrolysis of 1-fluoro-2,4-dinitrobenzene and sulfonyl chlorides as well as the hydration of cyanamide to urea. Atomic investigation into this enzyme will promote our understanding of related internal physiological/pathological mechanisms.
In this study, long time (1 μs) atomic MD simulations of apo-HCA II as well as the clustering and free-energy analyses were reported, which has provided novel insights into the dynamics of apo-HCA II as well as the mechanism upon ligand binding. Multiple conformations of loops 1 and 2 can be observed in our MD simulations especially for loop 1 because loop 1 is one side of the binding pocket, and its left-to-right movement can compress or extend the binding pocket, leading to one inactive state (cluster 2 with loop 1 closed), three intermediate states semiopen (clusters 1, 3, and 4, with loop 1 semiopen), and one active state (cluster 5 with loop 1 open); both the intermediate and active states are accessible to CO2, the active state can accommodate large ligands. Loop 2 is a surface loop, so although it has larger B-factors than loop 1, its left-to-right movement can represent only open or even superopen conformations, never blocking the entrance to the binding pocket.
“Induced Fit” versus “Conformational Selection”
At present, two different models, which are generally referred to as “induced fit (IF)” and “conformational selection (CS)”, have been proposed to describe the conformational changes that occur upon ligand binding.31−33 The IF model34 presumes that the binding of the ligand may induce a conformational change in the receipt or enzyme, resulting in an optimized geometry that exists only in the complex state. In this scenario, the protein energy landscape changes upon the binding of the ligand. By contrast, the CS model presumes that more than one structural conformation pre-exists in conformational equilibrium before ligand binding.35−37 This model involves the stabilization of an accessible conformation, and the ligand binding causes a shift in the pre-existing conformational equilibrium. It is important to note that these two models are not mutually exclusive; a survey of the recent literature indicates that many processes can simultaneously include certain elements of both the IF and CS models.32,33,38−41
In our simulation, inactive, intermediate, as well as active states coexist, and CO2 can easily get into the binding pocket of the active state but cannot get into the pocket of the inactive states; the ratio between CO2 accessible and inaccessible conformations is about 1:1. The longest continuous periods of CO2 accessible and CO2 inaccessible conformations are all about 20% of total simulation time (see Figure 3b). Therefore, for the apo form of HCA II, the lasting time of CO2 accessible conformations is long enough for its entry, but the lasting time of CO2 accessible conformations is also not short, and CO2 must “select” a right time to enter HCA II and bind. In other words, the conformational changes of apo-HCA II upon ligand binding favor the CS model as the conformation of the loop 1 is variable, and its open conformations can exist prior to antibiotics binding; when the loop 1 is semiopen or open, antibiotics enter and bind to HCA II; when loop 1 is closed, such an entry is forbidden. The situation for larger ligands is similar, but the lasting time of their accessible conformations is shorter. However, in this process, the entry of CO2 can also induce minor a conformational change of HCA II, so there will still be some minor IF elements. Once CO2 enters the binding pocket, loop 1 will close and compress the pocket so that CO2 is buried into the active site, then the side chains of His119, Leu198, Thr199, and Trp209 are attracted by CO2, rotated toward and bound to CO2.
Methods
MD Simulations
The MD simulations were performed using GROMACS 5.1.442,43 and the AMBER99sb-ildn force field.44 The initial coordinates for the MD simulations were taken from the crystal structure of apo-HCA II with one Zn2+ ion and 9 crystal water molecules (PDB entry 3KS3; Figure 1).23 The protein molecule was placed in a cubic TIP3P water box,45 with the edges of the water box located at least 10 Å from the protein atoms. The system consisted of 4055 protein atoms and 45 900 solvent atoms, neutralized by 2 Cl– ions under periodic boundary conditions. To remove potential bad contacts, the initial model was subjected to two rounds of energy minimization: first, 1000 steps of steepest descent followed by 1000 steps of conjugate gradient, with the protein atoms constrained by a harmonic potential with a force constant of 100 kcal/mol, and then, 2000 steps of steepest descent and 3000 steps of conjugate gradient without any constraints. Five 200 ns MD trajectories at 300 K with different initial random velocities were obtained, resulting in a total of 1 μs of simulation. In each trajectory, the system was heated at constant volume from 0 to 300 K over 60 ps, and then, a 5 ns equilibration MD simulation and a 200 ns production MD simulations were run at constant temperature and pressure, with the temperature maintained at the temperatures set by the velocity-rescale thermostat46 with a collision time of 0.2 ps and the pressure maintained at 1.0 atm using the Parrinello–Rahman barostat47 with the coupling time of 2.0 ps. The long-range electrostatic interaction is calculated by the particle-mesh Ewald method48 with a real space cutoff of 10 Å; the cutoff distance of the van der Waals interaction is also 10 Å as well. All bonds involving hydrogen atoms were fixed to their equilibrium values using the LINCS algorithm49 to allow a 2.0 fs time step. The MD trajectories were recorded at 4 ps intervals.
Multiple Trajectories in the Simulations
In our simulations, five 200 ns MD trajectories rather than a single 1000 ns trajectory were generated. The benefits of this approach are as follows: first, five shorter simulations with different initial velocities can more efficiently cover the relevant basin in configuration space and minimize force-field-induced artifacts;50 second, the five trajectories can be run simultaneously, thereby saving time.
Conformational Clustering and Network Analysis
The MD snapshots were clustered based on the DRMS using the leader algorithm implemented in WORDOM.51,52 The DRMS between two structures or snapshots (a and b) is defined as follows.
| 1 |
where dij is the distance between atoms i and j and N is the total number of pairs of atoms. The DRMS was chosen for the conformational clustering because it is sensitive to not only the conformations of individual loops but also the conformational coupling of the loops. The backbone atoms Cα, C, and N of the loops 1 and 2 (residues 197–206 in loop 1 and residues 230–240 in loop 2) were used for the calculations. The DRMS cutoff for the conformational clustering was 1.5 Å. For the MD trajectories, each cluster was treated as a node of a conformational network, with the node size proportional to the number of snapshots in the cluster and the edge thickness proportional to the number of direct transitions between two connected clusters. The visual representations of the conformational networks were created in Pajek.53
Principal Component Analysis
PCA was performed on the Cα atoms using the “gmx covar” command in GROMACS 5.1.4. The coordinates of each trajectory were superposed by means of a least-squares fit using the first snapshot as a reference. A covariance matrix of atomic fluctuations, C, was then calculated, with each element, cij, for a given pair of atoms defined as follows
| 2 |
where r1, r2, ..., r3N are the Cartesian coordinates of the Cα atoms and the angular brackets denote an ensemble average calculated from all snapshots of the MD trajectory.54−57 Diagonalization of the covariance matrix yielded the eigenvalues λi, that is, the diagonal elements of the diagonalized matrix, and the eigenvectors Li, that is, the columns of the orthonormal transformation matrix. These eigenvectors are the principal modes of motion, and the eigenvalues are the mean-square fluctuations along the eigenvector coordinates. PCA is not restricted to harmonic motions; it can also describe collective transitions between structures that differ greatly.
The percentage vi of the total variance contained in a given eigenvector Li is given by
| 3 |
where vi measures the contribution of a given PC to the overall protein fluctuations. The cumulative contribution from a set of PCs is
| 4 |
Typically, the first few PCs capture most of the intramolecular fluctuation of a protein.30,57−63
Acknowledgments
This work was supported by the National Natural Science Foundation of China under grant no. 11447013 as well as the self-determined research funds of CCNU from the college’s basic research and operation of MOE (grant nos. 23020205160030 and 20205170054).
Supporting Information Available
The Supporting Information is available free of charge on the ACS Publications website at DOI: 10.1021/acsomega.7b01414.
Time evolution of the Cα distances between Pro202 and Val68 and between Gly235 and Val68 in the MD trajectories; the magnitudes and cumulative percentages of the first 30 PC eigenvectors of the MD trajectories; the normalization and the orthogonality of our PCA calculation, especially the first 10 eigenvectors (PDF)
The authors declare no competing financial interest.
Supplementary Material
References
- Gerstein M.; Krebs W. A Database of Macromolecular Motions. Nucleic Acids Res. 1998, 26, 4280–4290. 10.1093/nar/26.18.4280. [DOI] [PMC free article] [PubMed] [Google Scholar]
- Goh C.-S.; Milburn D.; Gerstein M. Conformational Changes Associated with Protein–Protein Interactions. Curr. Opin. Struct. Biol. 2004, 14, 104–109. 10.1016/j.sbi.2004.01.005. [DOI] [PubMed] [Google Scholar]
- Gerstein M.; Lesk A. M.; Chothia C. Structural Mechanisms for Domain Movements in Proteins. Biochemistry 1994, 33, 6739–6749. 10.1021/bi00188a001. [DOI] [PubMed] [Google Scholar]
- Mccammon J. A. Protein Dynamics. Rep. Prog. Phys. 1984, 47, 1–46. 10.1088/0034-4885/47/1/001. [DOI] [Google Scholar]
- Jardetzky O.; Lefèvre J. F. Protein Dynamics. FEBS Lett. 1994, 338, 246–250. 10.1016/0014-5793(94)80277-7. [DOI] [PubMed] [Google Scholar]
- Ma L.; Cui Q. Activation Mechanism of a Signaling Protein at Atomic Resolution from Advanced Computations. J. Am. Chem. Soc. 2007, 129, 10261–10268. 10.1021/ja073059f. [DOI] [PMC free article] [PubMed] [Google Scholar]
- D’Abramo M.; Rabal O.; Oyarzabal J.; Gervasio F. L. Conformational Selection versus Induced Fit in Kinases: The Case of PI3K-I. Angew. Chem., Int. Ed. 2012, 51, 642–646. 10.1002/anie.201103264. [DOI] [PubMed] [Google Scholar]
- Silva D.-A.; Bowman G. R.; Sosa-Peinado A.; Huang X. A Role for Both Conformational Selection and Induced Fit in Ligand Binding by the Lao Protein. PLoS Comput. Biol. 2011, 7, e1002054 10.1371/journal.pcbi.1002054. [DOI] [PMC free article] [PubMed] [Google Scholar]
- Krishnamurthy V. M.; Kaufman G. K.; Urbach A. R.; Gitlin I.; Gudiksen K. L.; Weibel D. B.; Whitesides G. M. Carbonic Anhydrase as a Model for Biophysical and Physical-Organic Studies of Proteins and Protein–ligand Binding. Chem. Rev. 2008, 108, 946–1051. 10.1021/cr050262p. [DOI] [PMC free article] [PubMed] [Google Scholar]
- Gaspari R.; Rechlin C.; Heine A.; Bottegoni G.; Rocchia W.; Schwarz D.; Bomke J.; Gerber H.-D.; Klebe G.; Cavalli A. Kinetic and Structural Insights into the Mechanism of Binding of Sulfonamides to Human Carbonic Anhydrase by Computational and Experimental Studies. J. Med. Chem. 2016, 59, 4245–4256. 10.1021/acs.jmedchem.5b01643. [DOI] [PubMed] [Google Scholar]
- Wambo T. O.; Chen L. Y.; McHardy S. F.; Tsin A. T. Molecular Dynamics Study of Human Carbonic Anhydrase II in Complex with Zn2+ and Acetazolamide on the Basis of All-Atom Force Field Simulations. Biophys. Chem. 2016, 214–215, 54–60. 10.1016/j.bpc.2016.05.006. [DOI] [PMC free article] [PubMed] [Google Scholar]
- Tripp B. C.; Smith K.; Ferry J. G. Carbonic Anhydrase: New Insights for an Ancient Enzyme. J. Biol. Chem. 2001, 276, 48615–48618. 10.1074/jbc.r100045200. [DOI] [PubMed] [Google Scholar]
- Alterio V.; Di Fiore A.; D’Ambrosio K.; Supuran C. T.; De Simone G. Multiple Binding Modes of Inhibitors to Carbonic Anhydrases: How to Design Specific Drugs Targeting 15 Different Isoforms?. Chem. Rev. 2012, 112, 4421–4468. 10.1021/cr200176r. [DOI] [PubMed] [Google Scholar]
- Henkart P.; Guidotti G.; Edsall J. T. Catalysis of the Hydrolysis of 1-Fluoro-2,4-Dinitrobenzene by Carbonic Anhydrase. J. Biol. Chem. 1968, 243, 2447. [PubMed] [Google Scholar]
- Whitney P. L.; Nyman P. O.; Malmström B. G. Inhibition and Chemical Modifications of Human Erythrocyte Carbonic Anhydrase B. J. Biol. Chem. 1967, 242, 4212. [PubMed] [Google Scholar]
- Briganti F.; Mangani S.; Scozzafava A.; Vernaglione G.; Supuran C. T. Carbonic Anhydrase Catalyzes Cyanamide Hydration to Urea: Is It Mimicking the Physiological Reaction?. J. Biol. Inorg Chem. 1999, 4, 528–536. 10.1007/s007750050375. [DOI] [PubMed] [Google Scholar]
- Wistrand P. J.Carbonic Anhydrase Research: A Clinical Perspective, Past and Future. In The Carbonic Anhydrases: New Horizons; Chegwidden W. R., Carter N. D., Edwards Y. H., Eds.; Birkhauser Verlag: Basel, Switzerland, 2000; pp 597–609. [DOI] [PubMed] [Google Scholar]
- Hentunen T. A.; et al. Carbonic Anhydrases in Calcified Tissues. In The Carbonic Anhydrases: New Horizons; Chegwidden W. R., Carter N. D., Edwards Y., Eds.; Birkhauser Verlag: Basel, Switzerland, 2000; pp 491–497. [Google Scholar]
- Supuran C. T. Carbonic Anhydrases: Novel Therapeutic Applications for Inhibitors and Activators. Nat. Rev. Drug Discovery 2008, 7, 168–181. 10.1038/nrd2467. [DOI] [PubMed] [Google Scholar]
- Avvaru B. S.; Busby S. A.; Chalmers M. J.; Griffin P. R.; Venkatakrishnan B.; Agbandje-McKenna M.; Silverman D. N.; McKenna R. Apo-Human Carbonic Anhydrase II Revisited: Implications of the Loss of a Metal in Protein Structure, Stability, and Solvent Network. Biochemistry 2009, 48, 7365–7372. 10.1021/bi9007512. [DOI] [PMC free article] [PubMed] [Google Scholar]
- Lindskog S. Structure and Mechanism of Carbonic Anhydrase. Pharmacol. Ther. 1997, 74, 1–20. 10.1016/s0163-7258(96)00198-2. [DOI] [PubMed] [Google Scholar]
- Chakravarty S.; Kannan K. K. Drug-Protein Interactions: Refined Structures of Three Sulfonamide Drug Complexes of Human Carbonic Anhydrase I Enzyme. J. Mol. Biol. 1994, 243, 298–309. 10.1006/jmbi.1994.1655. [DOI] [PubMed] [Google Scholar]
- Avvaru B. S.; Kim C. U.; Sippel K. H.; Gruner S. M.; Agbandje-McKenna M.; Silverman D. N.; McKenna R. A Short, Strong Hydrogen Bond in the Active Site of Human Carbonic Anhydrase II. Biochemistry 2010, 49, 249–251. 10.1021/bi902007b. [DOI] [PMC free article] [PubMed] [Google Scholar]
- Fisher S. Z.; Maupin C. M.; Budayova-Spano M.; Govindasamy L.; Tu C.; Agbandje-McKenna M.; Silverman D. N.; Voth G. A.; McKenna R. Atomic Crystal and Molecular Dynamics Simulation Structures of Human Carbonic Anhydrase II: Insights into the Proton Transfer Mechanism. Biochemistry 2007, 46, 2930–2937. 10.1021/bi062066y. [DOI] [PubMed] [Google Scholar]
- Alterio V.; Vitale R. M.; Monti S. M.; Pedone C.; Scozzafava A.; Cecchi A.; De Simone G.; Supuran C. T. Carbonic Anhydrase Inhibitors: X-Ray and Molecular Modeling Study for the Interaction of a Fluorescent Antitumor Sulfonamide with Isozyme II and IX. J. Am. Chem. Soc. 2006, 128, 8329–8335. 10.1021/ja061574s. [DOI] [PubMed] [Google Scholar]
- Kiefer L. L.; Fierke C. A. Functional Characterization of Human Carbonic Anhydrase II Variants with Altered Zinc Binding Sites. Biochemistry 1994, 33, 15233–15240. 10.1021/bi00255a003. [DOI] [PubMed] [Google Scholar]
- Yang R.; Lee M. C.; Yan H.; Duan Y. Loop Conformation and Dynamics of the Escherichia Coli HPPK Apo-Enzyme and Its Binary Complex with MgATP. Biophys. J. 2005, 89, 95–106. 10.1529/biophysj.105.061556. [DOI] [PMC free article] [PubMed] [Google Scholar]
- Gao K.; He H.; Yang M.; Yan H. Molecular Dynamics Simulations of the Escherichia Coli HPPK Apo-Enzyme Reveal a Network of Conformational Transitions. Biochemistry 2015, 54, 6734–6742. 10.1021/acs.biochem.5b01012. [DOI] [PubMed] [Google Scholar]
- Gao K.; Jia Y.; Yang M. A Network of Conformational Transitions Revealed by Molecular Dynamics Simulations of the Binary Complex of Escherichia coli 6-Hydroxymethyl-7,8-dihydropterin Pyrophosphokinase with MgATP. Biochemistry 2016, 55, 6931–6939. 10.1021/acs.biochem.6b00720. [DOI] [PubMed] [Google Scholar]
- Lou H.; Cukier R. I. Molecular Dynamics of Apo-Adenylate Kinase: A Distance Replica Exchange Method for the Free Energy of Conformational Fluctuations. J. Phys. Chem. B 2006, 110, 24121–24137. 10.1021/jp064303c. [DOI] [PubMed] [Google Scholar]
- Weikl T. R.; von Deuster C. Selected-Fit versus Induced-Fit Protein Binding: Kinetic Differences and Mutational Analysis. Proteins: Struct., Funct., Bioinf. 2009, 75, 104–110. 10.1002/prot.22223. [DOI] [PubMed] [Google Scholar]
- Csermely P.; Palotai R.; Nussinov R. Induced Fit, Conformational Selection and Independent Dynamic Segments: An Extended View of Binding Events. Trends Biochem. Sci. 2010, 35, 539–546. 10.1016/j.tibs.2010.04.009. [DOI] [PMC free article] [PubMed] [Google Scholar]
- Bucher D.; Grant B. J.; McCammon J. A. Induced Fit or Conformational Selection? The Role of the Semi-Closed State in the Maltose Binding Protein. Biochemistry 2011, 50, 10530–10539. 10.1021/bi201481a. [DOI] [PMC free article] [PubMed] [Google Scholar]
- Koshland D. E. Application of a Theory of Enzyme Specificity to Protein Synthesis. Proc. Natl. Acad. Sci. U.S.A. 1958, 44, 98–104. 10.1073/pnas.44.2.98. [DOI] [PMC free article] [PubMed] [Google Scholar]
- Ma B.; Kumar S.; Tsai C.-J.; Nussinov R. Folding Funnels and Binding Mechanisms. Protein Eng. 1999, 12, 713–720. 10.1093/protein/12.9.713. [DOI] [PubMed] [Google Scholar]
- Tsai C.-J.; Buyong M.; Sham Y. Y.; Kumar S.; Nussinov R. Structured Disorder and Conformational Selection. Proteins: Struct., Funct., Genet. 2001, 44, 418–427. 10.1002/prot.1107. [DOI] [PubMed] [Google Scholar]
- Ma B.; Nussinov R. Enzyme Dynamics Point to Stepwise Conformational Selection in Catalysis. Curr. Opin. Chem. Biol. 2010, 14, 652–659. 10.1016/j.cbpa.2010.08.012. [DOI] [PMC free article] [PubMed] [Google Scholar]
- Boehr D. D.; Nussinov R.; Wright P. E. The Role of Dynamic Conformational Ensembles in Biomolecular Recognition. Nat. Chem. Biol. 2009, 5, 789–796. 10.1038/nchembio.232. [DOI] [PMC free article] [PubMed] [Google Scholar]
- Okazaki K.-I.; Takada S. Dynamic Energy Landscape View of Coupled Binding and Protein Conformational Change: Induced-Fit versus Population-Shift Mechanisms. Proc. Natl. Acad. Sci. U.S.A. 2008, 105, 11182–11187. 10.1073/pnas.0802524105. [DOI] [PMC free article] [PubMed] [Google Scholar]
- Gao K.; Zhao Y. A Network of Conformational Transitions in the Apo Form of NDM-1 Enzyme Revealed by MD Simulation and a Markov State Model. J. Phys. Chem. B 2017, 121, 2952–2960. 10.1021/acs.jpcb.7b00062. [DOI] [PubMed] [Google Scholar]
- Grant B. J.; Gorfe A. A.; McCammon J. A. Large Conformational Changes in Proteins: Signaling and Other Functions. Curr. Opin. Struct. Biol. 2010, 20, 142–147. 10.1016/j.sbi.2009.12.004. [DOI] [PMC free article] [PubMed] [Google Scholar]
- Van Der Spoel D.; Lindahl E.; Hess B.; Groenhof G.; Mark A. E.; Berendsen H. J. C. GROMACS: Fast, Flexible, and Free. J. Comput. Chem. 2005, 26, 1701–1718. 10.1002/jcc.20291. [DOI] [PubMed] [Google Scholar]
- Hess B.; Kutzner C.; van der Spoel D.; Lindahl E. GROMACS 4: Algorithms for Highly Efficient, Load-Balanced, and Scalable Molecular Simulation. J. Chem. Theory Comput. 2008, 4, 435–447. 10.1021/ct700301q. [DOI] [PubMed] [Google Scholar]
- Lindorff-Larsen K.; Piana S.; Palmo K.; Maragakis P.; Klepeis J. L.; Dror R. O.; Shaw D. E. Improved Side-Chain Torsion Potentials for the Amber ff99SB Protein Force Field. Proteins: Struct., Funct., Bioinf. 2010, 78, 1950–1958. 10.1002/prot.22711. [DOI] [PMC free article] [PubMed] [Google Scholar]
- Pomelli C. S.; Tomasi J.; Barone V. An Improved Iterative Solution to Solve the Electrostatic Problem in the Polarizable Continuum Model. Theor. Chem. Acc. 2001, 105, 446–451. 10.1007/s002140000239. [DOI] [Google Scholar]
- Bussi G.; Donadio D.; Parrinello M. Canonical Sampling through Velocity Rescaling. J. Chem. Phys. 2007, 126, 014101. 10.1063/1.2408420. [DOI] [PubMed] [Google Scholar]
- Parrinello M.; Rahman A. Polymorphic Transitions in Single Crystals: A New Molecular Dynamics Method. J. Appl. Phys. 1981, 52, 7182–7190. 10.1063/1.328693. [DOI] [Google Scholar]
- Essmann U.; Perera L.; Berkowitz M. L.; Darden T.; Lee H.; Pedersen L. G. A Smooth Particle Mesh Ewald Method. J. Chem. Phys. 1995, 103, 8577–8593. 10.1063/1.470117. [DOI] [Google Scholar]
- Hess B.; Bekker H.; Berendsen H. J. C.; Fraaije J. G. E. M. LINCS: A Linear Constraint Solver for Molecular Simulations. J. Comput. Chem. 1997, 18, 1463–1472. . [DOI] [Google Scholar]
- Negureanu L.; Salsbury F. R. Insights into Protein—DNA Interactions, Stability and Allosteric Communications: A Computational Study of Mutsα-DNA Recognition Complexes. J. Biomol. Struct. Dyn. 2012, 29, 757–776. 10.1080/07391102.2012.10507412. [DOI] [PMC free article] [PubMed] [Google Scholar]
- Seeber M.; Cecchini M.; Rao F.; Settanni G.; Caflisch A. Wordom: A Program for Efficient Analysis of Molecular Dynamics Simulations. Bioinformatics 2007, 23, 2625–2627. 10.1093/bioinformatics/btm378. [DOI] [PubMed] [Google Scholar]
- Seeber M.; Felline A.; Raimondi F.; Muff S.; Friedman R.; Rao F.; Caflisch A.; Fanelli F. Wordom: A User-Friendly Program for the Analysis of Molecular Structures, Trajectories, and Free Energy Surfaces. J. Comput. Chem. 2011, 32, 1183–1194. 10.1002/jcc.21688. [DOI] [PMC free article] [PubMed] [Google Scholar]
- Batagelj V.; Mrvar A. Pajek—Program for Large Network Analysis. Connections 1998, 21, 47–57. [Google Scholar]
- Mesentean S.; Koppole S.; Smith J. C.; Fischer S. The Principal Motions Involved in the Coupling Mechanism of the Recovery Stroke of the Myosin Motor. J. Mol. Biol. 2007, 367, 591–602. 10.1016/j.jmb.2006.12.058. [DOI] [PubMed] [Google Scholar]
- Moghaddam S.; Yang C.; Rekharsky M.; Ko Y. H.; Kim K.; Inoue Y.; Gilson M. K. New Ultrahigh Affinity Host–Guest Complexes of Cucurbit[7]uril with Bicyclo[2.2.2]Octane and Adamantane Guests: Thermodynamic Analysis and Evaluation of M2 Affinity Calculations. J. Am. Chem. Soc. 2011, 133, 3570–3581. 10.1021/ja109904u. [DOI] [PMC free article] [PubMed] [Google Scholar]
- Skjaerven L.; Martinez A.; Reuter N. Principal Component and Normal Mode Analysis of Proteins; a Quantitative Comparison Using the GroEL Subunit. Proteins 2011, 79, 232–243. 10.1002/prot.22875. [DOI] [PubMed] [Google Scholar]
- Amadei A.; Linssen A. B. M.; Berendsen H. J. C. Essential Dynamics of Proteins. Proteins: Struct., Funct., Genet. 1993, 17, 412–425. 10.1002/prot.340170408. [DOI] [PubMed] [Google Scholar]
- Kitao A.; Go̅ N. Conformational Dynamics of Polypeptides and Proteins in the Dihedral Angle Space and in the Cartesian Coordinate Space: Normal Mode Analysis of Deca-Alanine. J. Comput. Chem. 1991, 12, 359–368. 10.1002/jcc.540120309. [DOI] [Google Scholar]
- García A. Large-Amplitude Nonlinear Motions in Proteins. Phys. Rev. Lett. 1992, 68, 2696–2699. 10.1103/physrevlett.68.2696. [DOI] [PubMed] [Google Scholar]
- Horiuchi T.; Go̅ N. Projection of Monte Carlo and Molecular Dynamics Trajectories onto the Normal Mode Axes: Human Lysozyme. Proteins 1991, 10, 106–116. 10.1002/prot.340100204. [DOI] [PubMed] [Google Scholar]
- van Aalten D. M. F.; Amadei A.; Linssen A. B. M.; Eijsink V. G. H.; Vriend G.; Berendsen H. J. C. The Essential Dynamics of Thermolysin: Confirmation of the Hinge-Bending Motion and Comparison of Simulations in Vacuum and Water. Proteins: Struct., Funct., Genet. 1995, 22, 45–54. 10.1002/prot.340220107. [DOI] [PubMed] [Google Scholar]
- Mesentean S.; Fischer S.; Smith J. C. Analyzing Large-Scale Structural Change in Proteins: Comparison of Principal Component Projection and Sammon Mapping. Proteins: Struct., Funct., Genet. 2006, 64, 210–218. 10.1002/prot.20981. [DOI] [PubMed] [Google Scholar]
- Tournier A. L.; Smith J. C. Principal Components of the Protein Dynamical Transition. Phys. Rev. Lett. 2003, 91, 208106. 10.1103/physrevlett.91.208106. [DOI] [PubMed] [Google Scholar]
Associated Data
This section collects any data citations, data availability statements, or supplementary materials included in this article.


