Abstract
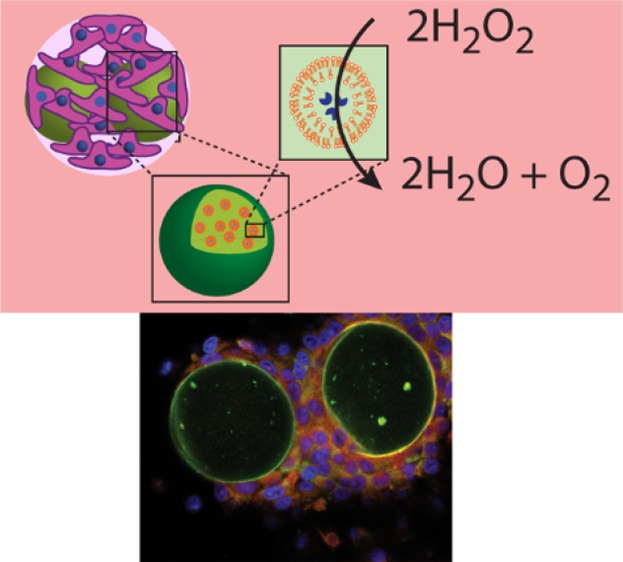
The assembly of microreactors has made considerable progress toward the fabrication of artificial cells. However, their characterization remains largely limited to buffer solution-based assays in the absence of their natural role model—the biological cells. Herein, the combination of microreactors with HepG2 cells either in planar cell cultures or in the form of cell aggregates is reported. Alginate (Alg)-based microreactors loaded with catalase are assembled by droplet microfluidics, and their activity is confirmed. The acceptance of polymer-coated ∼40 μm Alg particles by proliferating HepG2 cells is depending on the terminating polymer layer. When these functional microreactors are cocultured with HepG2 cells, they can be employed for detoxification, that is, hydrogen peroxide removal, and by doing so, they assist the cells to survive. This report is among the first successful combination of microreactors with biological cells, that is, HepG2 cells, contributing to the fundamental understanding of integrating synthetic and biological partners toward the maturation of this semisynthetic concept for biomedical applications.
Introduction
Cell mimicry has recently attracted considerable interest, aiming at assembling micro-/nanoreactors which can substitute for missing or lost cellular function.1 Nanoreactors are typically considered as artificial organelles aiming to be intracellularly active. Diverse assemblies have been reported with confirmed activity in buffer solution as recently reviewed,2,3 with only few reports showing intracellular activity.4−11 On the other hand, microreactors represent artificial cells. Microreactors have been assembled as single- or multicomponent systems as extensively reviewed.12−14 In this context, liposomes within liposomes, polymersomes within polymersomes, and capsosomes (liposomes within polymer capsules) are the most successful concepts to date in terms of both structural and functional complexities.15 For example, a gated multistep enzymatic reaction in a three-liposome system has been demonstrated.16 The incorporation of pH-sensitive transmembrane channels,17 control over encapsulation18 and release,19 and the performance of encapsulated cascade reactions20,21 are highlights of polymersomes in polymersome assemblies. Recently, capsosomes have been used not only for triggered cargo release22 and encapsulated cascade reactions23 but also for locally confined encapsulated catalysis.24 Moreover, we employed capsosomes loaded with the enzyme phenylalanine ammonia lyase as extracellular microreactors in the presence of cells as potential oral treatment for phenylketonuria.25 Recently, we employed sub-10 μm-sized catalase-loaded core–shell particles and capsosomes as microreactors to support HepG2 cells in planar cell culture.26 However, despite the demonstrated diverse functionality of capsosomes, they suffer from two main inherent shortcomings. First, the layer-by-layer-based assembly is labor-intensive, and second, the loading capacity with liposomes is inherently limited, even when multiple liposome deposition steps were considered, because they are deposited onto the surface of solid template particles.27
Herein, we report the use of enzyme-loaded alginate (Alg) particles as extracellular microreactors and assess their performance in the presence of HepG2 cells. Specifically, we (i) characterized ∼40 μm Alg particles in their ability to integrate into a proliferating HepG2 cell culture depending on their surface coating, (ii) assembled Alg-based microreactors loaded with catalase via droplet microfluidics (D-μF) and confirmed their biocatalytic activity, and (iii) demonstrated that these microreactors cocultured with HepG2 cells improved the viability of the HepG2 cells in planar cultures and in cell aggregates by degrading externally added hydrogen peroxide (H2O2) (Scheme 1).
Scheme 1. Schematic Illustration of the Combination of Microreactors and HepG2 Cells.
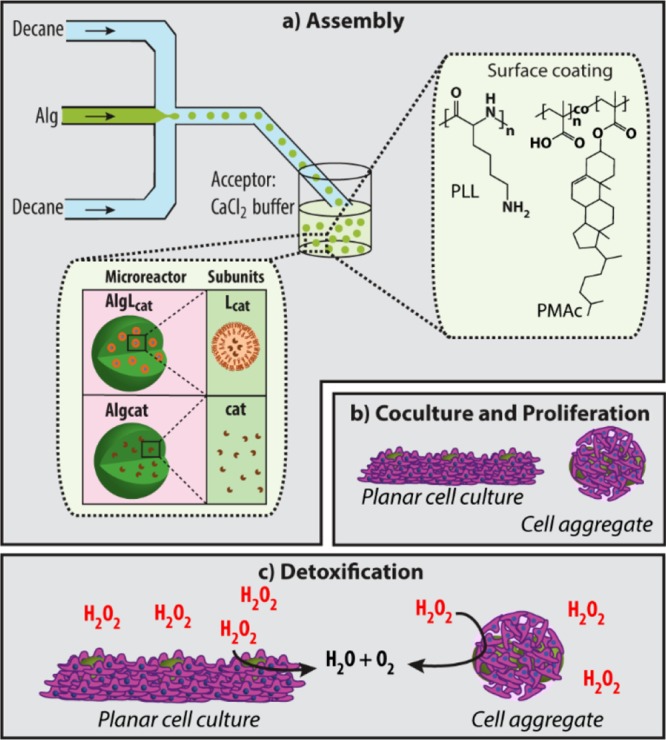
(a) Assembly: schematic illustration of the Alg particle fabrication using D-μF and their coating with poly(l-lysine) (PLL) or cholesterol-modified poly(methacrylic acid) (PMA) (PMAc) (right inset). Two types of microreactors are assembled: AlgLcat consisting of Alg carrier particles with entrapped catalase-loaded liposomal subunits (Lcat) and Algcat consisting of Alg carrier particles with entrapped catalase (cat) (left inset). (b) Microreactors and HepG2 cells are mixed in solution, followed by their co-culturing. The HepG2 cells are allowed to be in planar cell culture and in cell aggregates. (c) These combinations of synthetic microreactors and HepG2 cells are exposed to hydrogen peroxide (H2O2), and the ability of the artificial partner to support the viability of the HepG2 cells is assessed.
Results and Discussion
Alg Particle Assembly and Coating
Alg particles were produced by D-μF. Particles with a diameter of approximately 40 μm were chosen because it is ∼4× larger than an individual hepatocyte and will ensure that multiple cells could interact with one microreactor. Alg is a biopolymer which is widely used as a biomaterial as extensively reviewed by Lee and Mooney29 or Sun and Tan.30 D-μF was employed to assemble the Alg particles because this method allows for the fast fabrication of particles with narrow dispersity of different sizes, shapes, and softnesses including control over the type and amount of loaded cargo, as recently discussed by Beebe and co-workers31 and Armada-Moreira et al.32 There are multiple examples of Alg particles produced by D-μF.33−35 The cross-linking of the Alg droplets into stable particles is among the major challenges in this context. The penetration of Ca2+ ions from outside as illustrated by a recent work from Wang et al.34 and by internal cross-linking due to the Ca2+ ion release from the Alg droplet as reported by Liu et al.36 or Mazutis et al.37 are examples in this context. Other recent interesting reports include nonspherical Alg microgels.38−40
Inspired by these prior efforts, we fabricated Alg particles by D-μF. Further, with the aim to better control the particle/HepG2 cell interaction in cell culture, the Alg particles were coated with PLL (Alg+) and PLL/PMAc (Algc). Uncoated Alg particles were inherently negatively charged. PLL equipped the particles with a positive charge, while cholesterol was expected to facilitate cell adhesion to the particles due to the nonspecific incorporation of cholesterol into the lipid bilayer of the cell membrane, as we have previously observed on planar surfaces.28 First, the effect of the terminating layers on the morphology of the soft Alg particles was assessed by visualizing the particles using optical microscopy and scanning electron microscopy (SEM) (Figure 1). The bright-field images confirmed the presence of intact nonaggregated Alg particles of similar sizes in HEPES1 buffer solution (10 mM 4-(2-hydroxyethyl)piperazine-1-ethanesulfonic acid (HEPES), pH 7.4). PLL was not only immobilized on the surface of the particles but also diffused into the Alg particles (Figure 1ii, inset). Interestingly, when the PLL concentration was doubled in the coating step for the samples Alg+ (2×) and Algc (2×) (Figure 1iii,v), surface wrinkling and particle shrinkage of the structurally intact particles were observed. Although not further explored in this report, this is a relevant finding because wrinkled surfaces have proven to beneficially affect the biological response as, for instance, recently illustrated by Li et al.41 Further, the SEM images revealed that the uncoated Alg particles disintegrated upon drying, whereas particles coated with either PLL or PLL/PMAc improved their stability and could preserve their structural integrity also in the dried state.
Figure 1.
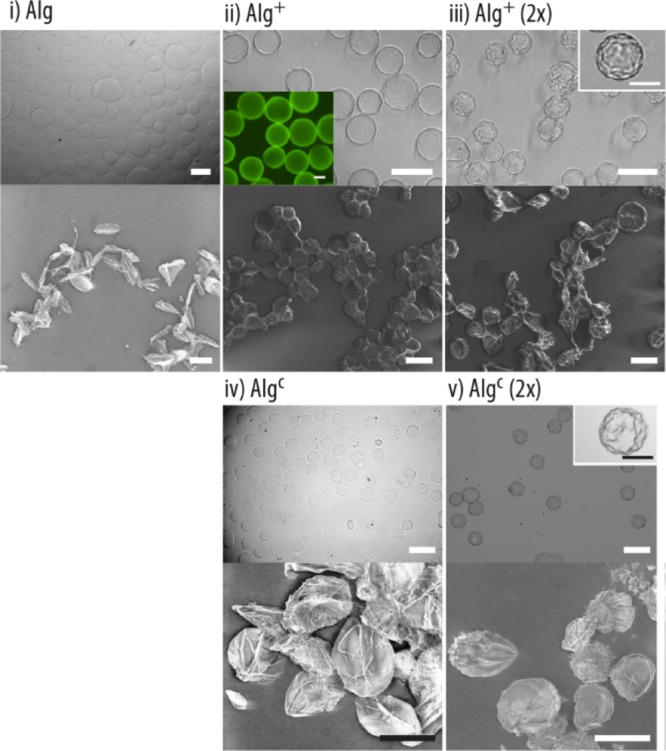
Bright-field (top) and SEM (bottom) images of (i) Alg, (ii) Alg+, (iii) Alg+ (2×), (iv) Algc, and (v) Algc (2×). (ii—inset) Fluorescent microscopy image of Alg particles after exposure to fluorescently labeled PLL (PLLF). The scale bars are 50 and 20 μm in the insets.
Coculturing of (Coated) Alg Particles with HepG2 Cells
Planar Cell Culture
The first step toward the combination of synthetic and biological entities requires the acceptance of the presence of the former by the proliferating HepG2 cell population. Although particles which support cell adhesion have before been coencapsulated with L929 cells in liquefied Alg capsules and a beneficial cellular response has been observed,42 to the best of our knowledge, the coculturing of Alg-based microreactors and biological cells has never been reported before. Herein, we assessed the growth of HepG2 cells cultured in the presence of ∼40 μm Alg particles with different surface chemistries.
First, the ability of HepG2 cells to integrate uncoated Alg particles into the proliferating cell population was assessed by mixing and coculturing HepG2 cells in cell-to-Alg particle ratios of 25/1 and 1/1. The cells proliferated with longer incubation times for both ratios; that is, increasing the number of Alg particles did not seem to have any effect on the cell growth (Supporting Information, Figure S1). After washing and fixing, only the integrated Alg particles remained (Supporting Information, Figure S2). Only very few Alg particles were preserved for the 25/1 ratio, whereas the ratio 1/1 showed a large number of residual Alg particles. To get further insights how the Alg particles interacted with the cells, a cell-to-Alg particle ratio of 25/1 was cocultured for 72 h and then visualized by confocal laser scanning microscopy (CLSM), by imaging different focal planes (Supporting Information, Figure S3). The very few particles were embedded in the cell population, with the cells growing along the particle surface, indicating the interaction between the HepG2 cells and the Alg particles.
In the next step, the coated particles Alg+ and Algc were cocultured with the HepG2 cells for 24, 48, and 72 h in a cell-to-particle ratio of 25/1 (Supporting Information, Figure S4). The bright-field images of fixed cells showed that, in general, much more coated particles were integrated in the proliferating HepG2 cells compared to their uncoated counterparts. Counting the particles per area revealed that ∼3× more Alg+ and Algc were present than (uncoated) Alg when the same cell-to-particle ratio was used for seeding (Supporting Information, Figure S5). This result was likely because of the fact that the coated particles allowed for cell attachment via electrostatic interactions and/or cholesterol anchoring. However, there was no obvious difference between Algc and Alg+. With the aim to get further insights into the cell–particle interactions, the different cocultures were fixed and stained after 72 h incubation time for visualization by CLSM. The images were taken on the top, in the middle, and on the bottom of the cocultures to determine how the particles were combining with the HepG2 cells. No surface-coating-dependent differences in the integration of the particles were observed (Figure 2a). The HepG2 cells interacted with the Alg+ and Algc particles on the bottom and middle level, whereas again barely any cells were observed on top of the particles.
Figure 2.
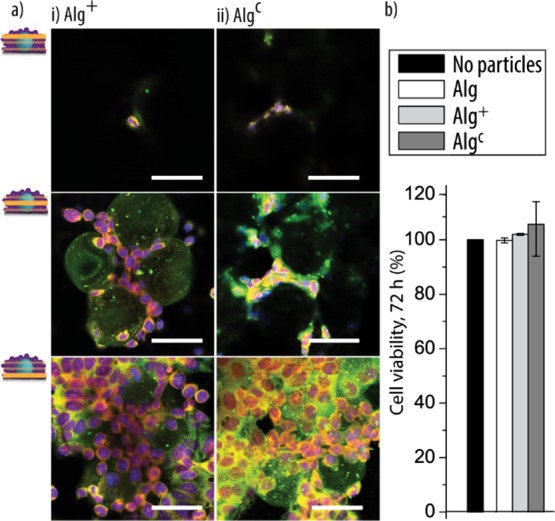
Surface coatings: (a) representative CLSM images, taken at different focal planes, of the coated Alg+ (i) and Algc (ii) particles cocultured with the HepG2 cells for 72 h (cell-to-particle ratio 25/1). The scale bars are 50 μm [blue: 6-diamidino-2-phenylindole (DAPI)-stained nuclei; green: fluorescently labeled Alg; and red: phalloidin-stained cytoskeleton]. (b) Cell viability: the viability of the HepG2 cells in the cocultures in comparison to that of a HepG2 monoculture is shown by assessing the activity of cellular dehydrogenase (culture time: 72 h, cell-to-Alg-based particle ratio: 25/1, and n = 3).
In an attempt to quantitatively compare the number of viable cells in the cell/particle cocultures to a HepG2 monoculture, the cellular metabolic activity, that is, the cellular dehydrogenase activity was assessed after 72 h (Figure 2b). Neither a significant increase nor decrease in dehydrogenase activity was observed for any of the cocultures in comparison to HepG2 cells only, indicating that the presence of the particles had no negative effect on the cells in this aspect.
Following on, we aimed to determine the performance of the cocultures over extended period of times, that is, up to 10 d. To this end, Algc particles were cocultured with the HepG2 cells, followed by fixing and staining after the desired incubation times for inspection by CLSM (Figure 3a). Overall, the cells proliferated in the cocultures and integrated the particles, with more HepG2 cells observed in the top area of the particles compared to the shorter incubation times.
Figure 3.
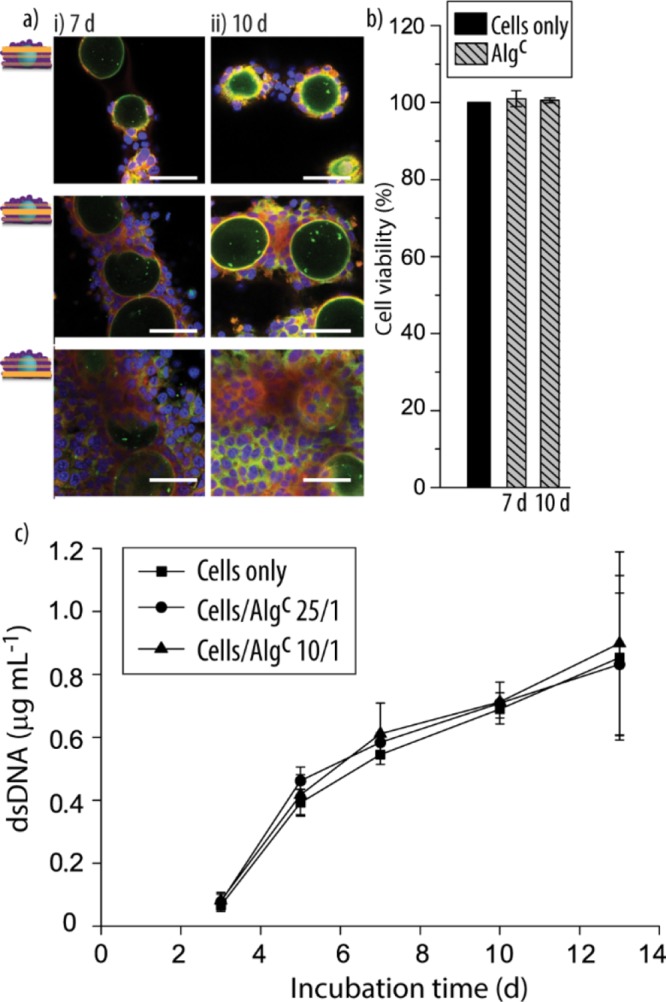
(a) Representative CLSM images, taken at different focal planes, of Algc cocultured with the HepG2 cells for 7 d (i) and 10 d (ii) (cell-to-Algc ratio 25/1). The scale bars are 50 μm (blue: DAPI-stained nuclei; green: fluorescently labeled Alg; and red: phalloidin-stained cytoskeleton). (b) Viability of the HepG2 cells in the cocultures in comparison to that of a HepG2 monoculture is shown by assessing the activity of cellular dehydrogenase (culture time: 7 and 10 d, cell-to-Algc ratio: 25/1, and n = 3). (c) dsDNA quantification of HepG2 cell/Algc cocultures (cell-to-Algc ratios: 25/1 and 10/1) in comparison to cells only after 3 d, 5 d, 7 d, 10 d, and 13 d (n = 3).
To compare the metabolic activity of the cells in coculture to that in the monoculture at this extended culturing times, the dehydrogenase activity was assessed after 7 and 10 d (Figure 3b). No significant differences were observed. To obtain additional information on the cell proliferation,43 the DNA in the cocultures was quantified and compared to that in the monocultures for up to 13 d (Figure 3c). Two different cell-to-Algc ratios were employed to understand the sensitivity of the proliferation of the HepG2 cells toward a higher amount of artificial entities. The results confirmed the increasing number of HepG2 cells with longer incubation times. There was no significant difference in the amount of measured double-stranded DNA (dsDNA) between the co- and monocultures or depending on the number of Algc particles.
HepG2 Cell Aggregates
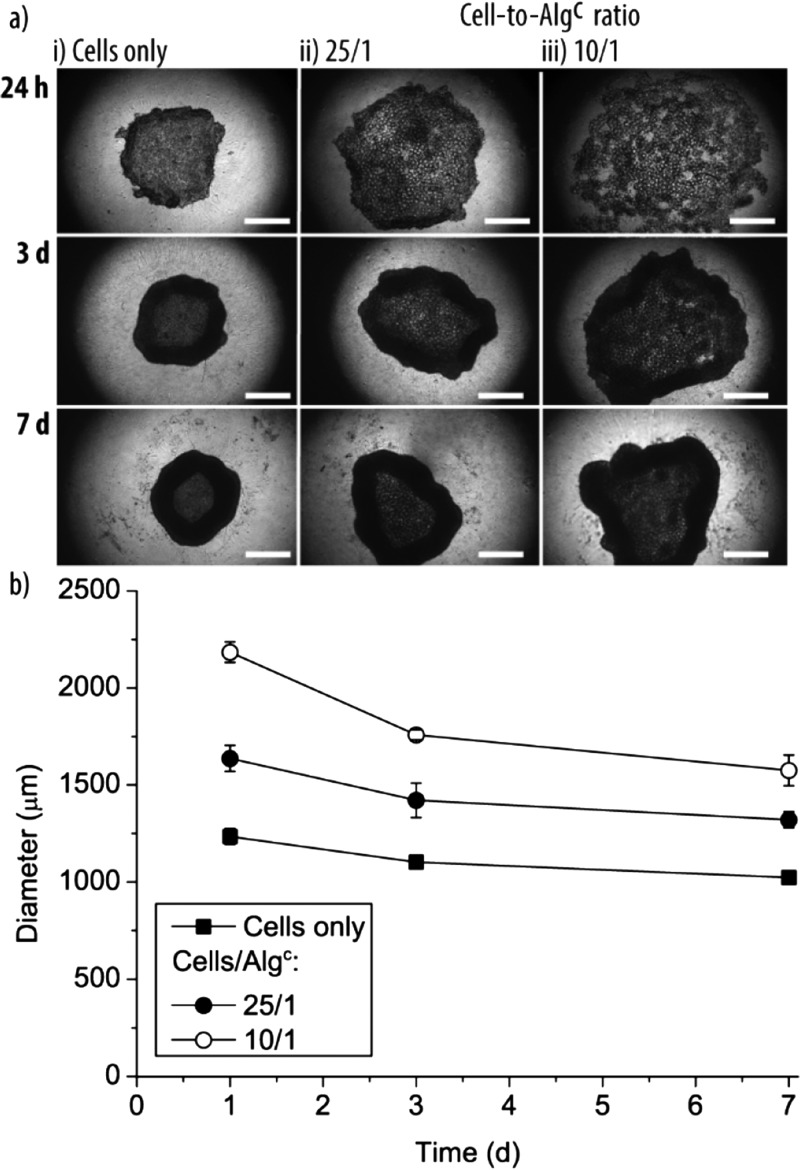
Because living tissue does not (predominantly) exist in 2D, we aimed to understand if artificial entities can also be integrated with their biological partner in cell aggregates, mimicking simple 3D tissue. The assembly of cell aggregates requires proper interaction between the HepG2 cells and the particles because gravity-driven codeposition cannot be considered a core-driving force as in the planar cell cultures. To this end, cells and Algc (cell-to-particle ratio 25/1 or 10/1) were seeded in well plates with ultralow adhesion surfaces, typically used for cell aggregate growth, and incubated for 24 h, 3 d, and 7 d. The bright-field images of these live cell aggregates revealed that the HepG2 cells did not yield in typical cell aggregates but more in toruslike structures, that is, a dense ring of cells with a loosely filled void (Figure 4ai). Importantly, the Algc particles were integrated in this type of cell aggregates (Figure 4aii). However, after 24 h of incubation, the cell aggregates only started to form, exhibiting a loose structure, especially when the cell-to-Algc ratio was 10/1 (Figure 4aiii, top). Increasing the coculture time to 3 and 7 d led to denser cell aggregates. Further, longer incubation decreased the cell aggregate size for cells only and cell/Algc mixtures (Figure 4b). Not surprisingly, the size of the cell aggregate was smallest for HepG2-cell-only samples and increased with increasing number of Algc particles present. This is an important aspect, illustrating that the artificial partners might contribute to the required mass of tissue needed for the envisioned applications, for example, transplantation. What is more, the Algc size also affected the cell aggregate size. Cell aggregates assembled using Algc with a size of ∼65 μm instead of ∼40 μm increased by ∼20% after 24 h incubation time (Supporting Information, Figure S6).
Figure 4.
Cell aggregates—size: (a) bright-field images of cell aggregates assembled from HepG2 cells only (i) and HepG2 cells and Algc in a cell-to-particle ratio of 25/1 (ii) and 10/1 (iii). Images were taken after 24 h, 3 d, and 7 d. The scale bars are 500 μm. (b) Diameter of the different cell aggregates depending on the entities used for the fabrication and the incubation time (n = 3).
Finally, cell aggregates assembled after 24 h, 3 d, and 7 d were fixed, stained, and visualized by CLSM, illustrating the integration and preserved integrity of Algc with the HepG2 cells (Figures 5 and S7).
Figure 5.
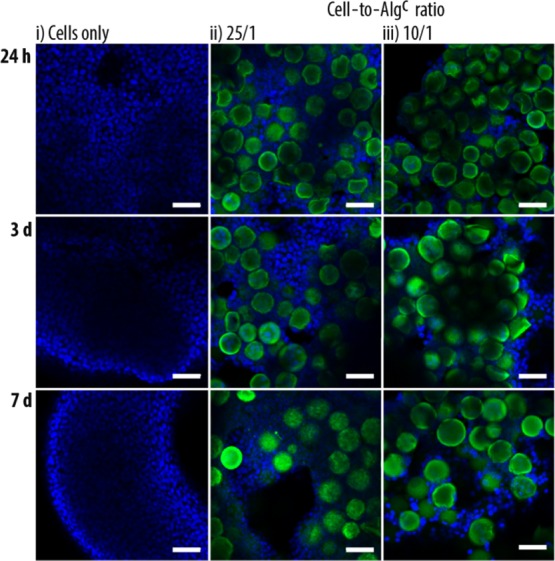
Representative CLSM images of cell aggregates assembled from HepG2 cells only (i) and HepG2 cells and Algc in a cell-to-particle ratio of 25/1 (ii) and 10/1 (iii). Images were taken after 24 h, 3 d, and 7 d. The scale bars are 50 μm (blue: DAPI-stained nuclei and green: PLLF of the coated Algc).
With the aim to investigate the viability of the HepG2 cells in the cell aggregates, a fluorescence-based live/dead staining assay was employed where viable cells and dead cells were stained by fluorescein diacetate (FDA) and propidium iodide (PI), respectively. There were similar low numbers of dead cells for cell aggregates without or with Algc after 24 h incubation time (Figure 6i–iii, top). However, when the cultivation times increased to 3 and 7 d, more dead cells were observed in the core of the cell aggregates in the absence of Algc. Because of the densification of the cell aggregates over time, the transportation of nutrition and oxygen to the tissue center likely became increasingly difficult, which is a general observation in cell aggregates. The presence of Algc might counteract these transport issues by slowing down the tissue densification and/or by providing “weak spots” which facilitated the diffusion of nutrients and oxygen. Therefore, the survival of the HepG2 cells in the denser areas improved, illustrated by the lower amount of dead cells observed after 7 d (Figure 6i vs 6ii/iii, bottom, and Supporting Information, Figure S8). The visual observations were confirmed by quantifying the live and dead cell areas (Figure 6b). Cell-only aggregates contained significantly more dead cells after 7 d compared to 3 d incubation time. Further, cell-only aggregates also had significantly more dead cells present compared to the cell aggregates containing Algc after 7 d. Taken together, Algc not only allowed the cell aggregates to form but also improved the tissue health in the tested time for the assessed parameter.
Figure 6.
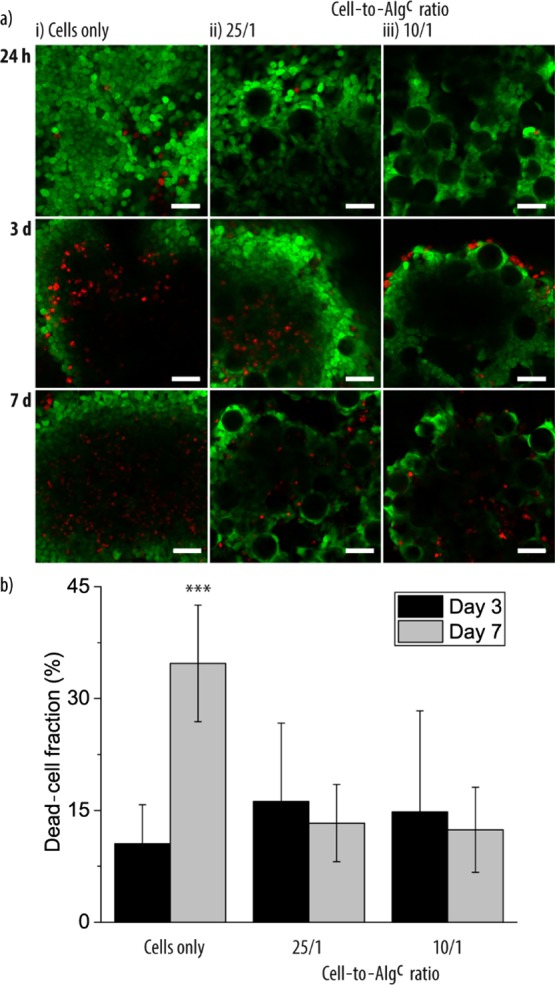
(a) Representative CLSM images of stained live (green)—dead (red) cell aggregates assembled from HepG2 cells only (i) and HepG2 cells and Algc in a cell-to-particle ratio of 25/1 (ii) and 10/1 (iii). Images were taken after 24 h, 3 d, and 7 d. The scale bars are 50 μm. (b) Dead-cell fraction of the cell aggregates assembled from HepG2 cells only and HepG2 cells and Algc in cell-to-particle ratios of 25/1 and 10/1 calculated after 3 and 7 d (n = 3, ***p < 0.001).
Assembly of Alg-Based Microreactors
With the aim to equip the artificial partner with functionality, the Alg-based particles were turned into microreactors by entrapping the enzyme catalase using D-μF. Microreactors based on Alg particles have previously been prepared by entrapping glucose oxidase,44 lipase,45 and urease46 using syringe injection for their preparation. Although the enzymatic activity was typically preserved, the retention of the enzymes tends to be low and/or uncontrollable because of their leakage into the surrounding solution during formation, storage, and use. In an attempt to overcome this issue, polymer multilayers were deposited on the Alg particles and improved retention was observed.47 Encapsulation of enzymes in particles or coatings always bears the risk of loss of function because the enzymatic activity strongly relies on the 3D structure of the protein. To this end, liposomes were trapped within the Alg particles with the aim to serve as cargo deposits. Empty liposomes [e.g., polydiacetylene liposomes48 or cholesterol/1,2-dipalmitoyl-sn-glycero-3-phosphocholine (DPPC) liposomes49], liposomes preloaded with a fluorescent dye combined with iron oxide nanoparticles, used for the heat-controlled dye release from liposomes,50 and liposomes preloaded with the hydrophobic coenzyme Q1051 were reported to be encapsulated in the Alg particles. Complementary to these prior efforts, we assembled liposome-loaded Alg particles by D-μF using ∼150 nm fluorescently labeled 1,2-dimyristoyl-sn-glycero-3-phosphocholine (DMPC)/DPPC liposomes (LF). These types of lipids were chosen because we previously showed that their temperature-responsive properties could be used to trigger the microreactors.25 Further, at room temperature (RT), the lipid bilayer is in the gel phase, assisting in the prevention of enzyme leakage. To reduce the liposome aggregation during the D-μF process, LF was exposed to a PLL solution, followed by carefully mixing with the Alg solution in different liposome-to-Alg solution volume ratios. The latter aspect aimed at controlling the amount of entrapped liposomal subunits per microreactor. The microreactors (AlgLF) fabricated by D-μF were stable and nonaggregated when suspended in buffer solution (Figure 7ai–ci). Further, increasing the amount of added LF to the Alg solution prior to the assembly led to a higher observed green fluorescence, suggesting a higher loading of LF in the AlgLF microreactors (Figure 7aii–cii). The distribution of LF within the entire Alg particles was confirmed by CLSM (Figure 7ciii). From now on, the microreactors will be assembled using 25 v % liposome stock solution and PLL/PMAc as terminating layers will be deposited onto the Alg particles to ensure their incorporation with the proliferating HepG2 cells.
Figure 7.
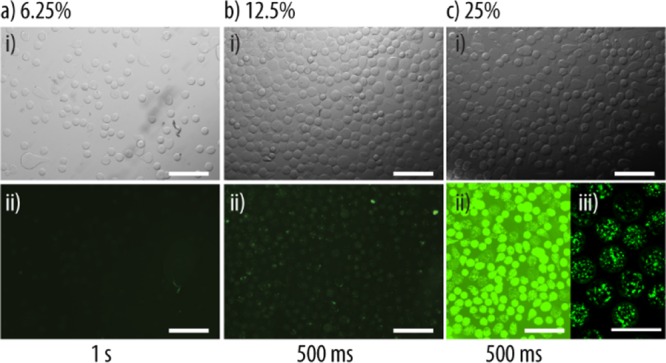
Microreactor assembly: (a) representative bright-field (i) and fluorescence (ii) images of AlgLF using 6.25 (a), 12.5 (b), and 25 (c) v % LF for their assembly by D-μF. The exposure times of the fluorescence images are noted on the bottom to facilitate image comparison. The scale bars are 200 μm. (ciii) CLSM image of AlgLF. The scale bars are 100 μm.
Catalase (cat) is an enzyme responsible for the degradation of H2O2. It is a protective enzyme present in nearly all animal cells. Therefore, cat was loaded into the liposomal subunits (Lcat) to obtain functional microreactors AlgLcat. By using DyLight 633-labeled catalase (catr) and NBD-labeled lipids, the microreactors (AlgLFcatr) were visualized using CLSM (Figure 8ai). Further, microreactors were assembled by mixing free cat into the Alg solution prior to the assembly by D-μF (Algcat). The successful cat loading into the microreactors was confirmed by CLSM using catr (Algcatr, Figure 8aii). Although AlgLFcatr exhibited homogenously distributed catr and LF across the entire particles, Algcat had the catr concentrated on the surface with large catr aggregates, illustrating that the liposomes were beneficial for the assembly of the microreactors. To confirm the enzymatic activities of AlgLcat and Algcat, an increasing number of these microreactors were exposed to a 40 μM H2O2 solution for 30 min. The remaining H2O2 was measured by testing the fluorescence intensity of the highly fluorescent oxidation product resorufin, using the commercial Amplex Red assay, and normalized to the initial H2O2 concentration in solution (Figure 8b). Both types of microreactors reduced the amount of detected H2O2 in a similar manner, confirming the presence of cat with preserved activity. As expected, increasing numbers of microreactors led to an increasing amount of removed H2O2. It was estimated that ∼2.6 nM H2O2 per minute could be converted by a single microreactor.
Figure 8.
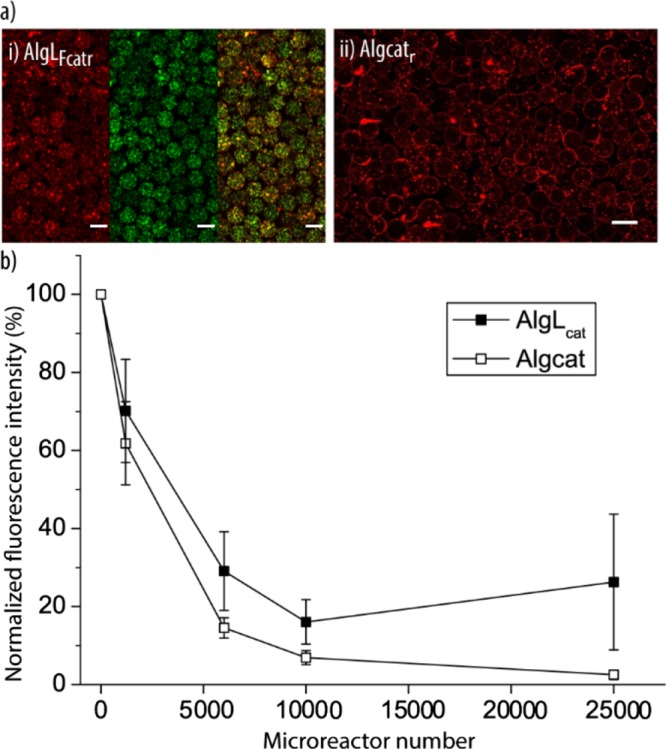
Microreactor activity: (a) representative CLSM images of fluorescently labeled microreactors AlgLFcatr (i) and Algcatr (ii) (red (catr): DyLight 633-labeled catalase and green (LF): NBD-PC-labeled lipids). The scale bars are 50 μm. (b) Activity of microreactors assessed via their ability to remove H2O2. The normalized fluorescence intensity of a H2O2-containing solution assessed by the Amplex Red assay after being exposed to AlgLcat and Algcat for 30 min is plotted (n = 3).
Following on, the stability of the microreactors was tested by incubating 25 000 AlgLcat or Algcat microreactors per mL HEPES1 buffer at 37 °C for 24 h prior to the assessment of the enzymatic activity (Supporting Information, Figure S9a). Whereas this 24 h buffer incubation step did not significantly affect the ability of AlgLcat to convert H2O2, the activity of Algcat was ∼12× reduced. This observation further illustrated that the liposomal subcompartments were beneficial for the microreactors. Additionally, with the goal to understand if the temperature-responsive liposome had an effect on the activity of the microreactors as we had previously observed for capsosomes,22,25,52 AlgLcat and Algcat were exposed to a 40 μM H2O2 solution either at RT or at 37 °C for 30 min, followed by using the Amplex Red assay at RT (Supporting Information, Figure S9b). The results confirmed that AlgLcat exhibited a higher activity at 37 °C compared to RT because of the better access of the enzymes to H2O2 when the lipid bilayer was in its liquid phase, whereas no difference was observed for Algcat. This latter finding also points toward a temperature-independent enzymatic activity in the microreactors.
Active Microreactors in HepG2 Cell Cultures
With the aim to confirm that the artificial entities can not only serve as a structural support for the cells but also impose a beneficial effect on the HepG2 cells, we assessed their ability to support the biological cells in detoxification, one of the major functions of the liver. Specifically, the goal was to alleviate the pressure from the growing HepG2 cells when stressed with H2O2 using Algcat or AlgLcat. We anticipated that the encapsulated enzyme cat could remove/reduce the toxic H2O2 and, by doing so, AlgLcat and Algcat would impose a beneficial effect on the entire cell culture. First, the cocultures of the microreactors AlgLFcatr or Algcatr and the HepG2 cells were visualized using CLSM after 6 h incubation time (Figure 9a). The microreactors were surrounded by the HepG2 cells; although the fluorescent lipids could not be detected, catr aggregates were present in both microreactors.
Figure 9.
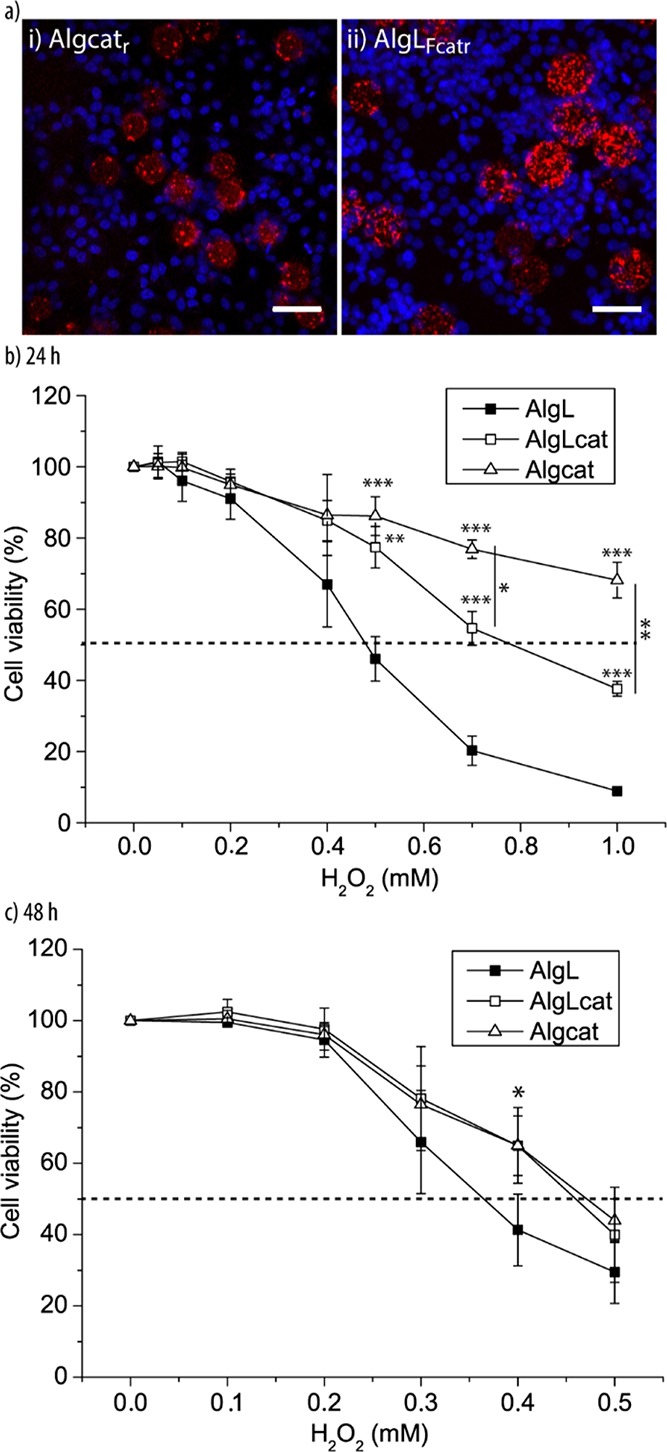
Microreactors in planar cell cultures: (a) representative CLSM images of bionic tissue of HepG2 cells and Algcatr (i) and AlgLFcatr (ii) after 6 h incubation time. The scale bars are 50 μm. Dose–response curves of bionic tissue consisting of HepG2 cells and Algcat, AlgLcat, or AlgL when exposed to different concentrations of H2O2 for 24 h (b) and 48 h (c) (n = 3, ***p < 0.001, **p < 0.01, and *p < 0.05).
Following on, the detoxification ability of the microreactors was assessed in cell culture. To this end, we cocultured the HepG2 cells with AlgLcat, Algcat, and AlgL (10/1 cell-to-microreactor ratio) for 10 h, followed by stressing the assembled tissue with different concentrations of H2O2 for 24 h (Figure 9b). The first two microreactors were aimed at removing H2O2, whereas AlgL was used as a control to monitor the reduction in cell viability due to the presence of H2O2. The viability of the HepG2 cells in the presence of the microreactors depending on the H2O2 concentration was measured and compared to that of the HepG2 monocultures by assessing the cellular dehydrogenase activity. The obtained dose–response curves confirmed that cell cultures containing AlgLcat and Algcat exhibited a higher cell viability compared to cocultures with AlgL and cells only (Supporting Information, Figure S10). Further, as expected, the dose–response curves for cells only and cocultures with empty microreactors were similar. The viability of the HepG2 cells in the presence of the cat-loaded microreactors was significantly higher when exposed to H2O2 in a concentration between 0.5 and 1 mM, demonstrating the positive effect of the artificial entities on the entire tissue. Further, Algcat was significantly more efficient compared to AlgLcat. More specifically, the median lethal dose (LD50) for H2O2 could be shifted from ∼0.5 to >1 mM for cocultures with Algcat. On the other hand, LD50 of cocultures with AlgLcat changed to ∼0.8 mM H2O2.
With the goal to estimate the time these microreactors remained active in cell culture, the viability was also assessed after 48 h exposure to H2O2 (Figure 9c). Specifically, after the first 24 h incubation with H2O2 as described above, the same volume of fresh cell medium containing H2O2 was added, followed by another 24 h incubation before assessing the cell viability. Both cat-loaded microreactors still supported the HepG2 cells against H2O2 in a concentration range of 0.2–0.5 mM, although not as impressively as in the first 24 h. A significant difference was observed only for 0.4 mM H2O2, and the shift in LD50 was only minor yet still detectable.
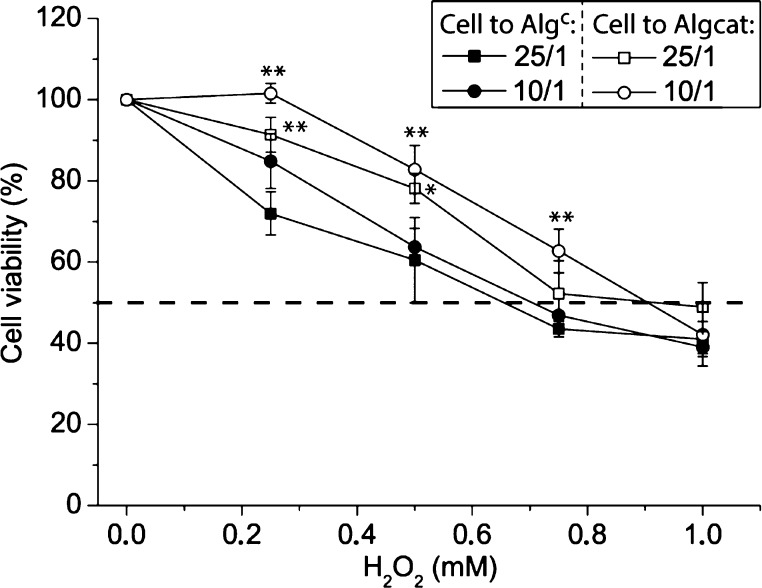
Finally, cell aggregates assembled from the HepG2 cells and Algc or Algcat microreactors in cell-to-microreactor ratios of 25/1 and 10/1 were let to incubate for 24 h. These cell aggregates were exposed to cell media supplemented with different H2O2 concentrations (0–1 mM) for another 24 h prior to the assessment of the cell viability (Figure 10). The dose–response curves indicated that the Algcat microreactors significantly improved the viability of the HepG2 cells compared to the aggregates equipped with Algc when exposed to 0.25–0.5 mM H2O2 using a cell-to-microreactor ratio of 25/1. On the other hand, when a higher number of microreactors were present (cell-to-microreactor ratio 10/1), the survival of the HepG2 cells was significantly improved for up to 0.75 mM H2O2, illustrating that these microreactors could act as beneficial functional partners in HepG2 cell aggregates.
Figure 10.
Microreactors in cell aggregates: dose–response curves of cell aggregates consisting of HepG2 cells and either Algcat or Algc in cell-to-microreactor ratios of 25/1 or 10/1 when exposed to different concentrations of H2O2 for 24 h (n = 3, **p < 0.01, and *p < 0.05).
Conclusions
We report the assembly of HepG2 cells and ∼40 μm Alg particles as artificial counterparts in planar cell cultures and in cell aggregates. It was found that coating the particles was beneficial for their successful combination with proliferating HepG2 cells. Further, the particles did not negatively affect the proliferation of the HepG2 cells. PMAc-coated Alg-based particles were converted into functional microreactors by encapsulating catalase either as the free enzyme or entrapped into liposomes. Finally, when coculturing the microreactors with the HepG2 cells, the artificial entities were able to preserve the viability of the HepG2 cells when exposed to H2O2. Although no long-term activity of the microreactors in cell culture was observed, these are the first-generation microreactors of their kind; with due improvements, for example, higher enzyme loading, more protective layers, the use of nanoparticles or organic molecules as enzyme mimics, alternative enzymes including cytochromes, etc., long-term activity will be feasible; and the benefit of the artificial entities will further mature. Although cell mimicry concepts remain in their infancies with a large number of challenges to be overcome and fundamental insights to be obtained, artificial cells might offer an alternative in future biomedical technologies such as the development of active 3D printed tissue engineering scaffolds or next-generation extracorporeal temporary (liver) support devices.
Experimental Section
Materials
Sodium Alg, PLL (molecular weight of 40–60 kDa), sodium chloride (NaCl), calcium chloride (CaCl2), tris(hydroxymethyl)aminomethane (TRIS), HEPES, sodium bicarbonate (NaHCO3), Triton X-100, Span 80, TWEEN 80, 1H,1H,2H,2H-perfluorooctyltriethoxysilane (PFOTES), acetic acid, ethanol, chloroform (purity of ≥99.5%), phalloidin tetramethylrhodamine B isothiocyanate (phalloidin), DAPI, primary antibody monoclonal antivinculin, FDA and propidium iodide (PI), catalase from bovine liver (10 000 units mg–1 solid, 240 kDa), from horseradish peroxidase (HRP, 250–330 units mg–1 solid), cell counting kit-8 (CCK-8), and hydrogen peroxide (H2O2, 30 w/w %) were purchased from Sigma-Aldrich. 5-(4,6-Dichlorotriazinyl) aminofluorescein (5-DTAF), the secondary antibody Alexa Fluor 488 F(ab′)2 fragment of goat antimouse IgG, DyLight 633 maleimide, Quant-iT PicoGreen cell proliferation assay, and the Amplex Red catalase assay kit were purchased from Thermo Fisher Scientific. DMPC, DPPC, and fluorescent lipid 1-oleoyl-2-[6-[(7-nitro-2-1,3-benzoxadiazol-4-yl) amino] hexanoyl]-sn-glycero-3 phosphocholine (NBD-PC) were purchased from Avanti Polar Lipids, USA.
Three types of buffers were used: TRIS buffer consisting of 10 mM TRIS at pH 8.5, HEPES1 buffer consisting of 10 mM HEPES at pH 7.4, and HEPES2 buffer consisting of 10 mM HEPES and 150 mM NaCl at pH 7.4. The buffer solutions were made with ultrapure water (monodistillation unit, GFL Corporation, Germany).
Poly(methacrylic acid-co-cholesteryl methacrylate) (PMAc)28 and fluorescein isothiocyanate-labeled PLL (PLLF)24 were synthesized following the procedures published previously. Labeled Alg was prepared by dropwise addition of a 10 mg mL–1 5-DTAF solution to a 10 mg mL–1 Alg solution in 0.1 M NaHCO3 buffer (pH 9), followed by incubation for 1 h and purification by dialysis overnight. Labeled catalase (catr) was prepared by adding 5 μL of DyLight 633 maleimide (5 mM in dimethyl sulfoxide) to a 5 mg mL–1 catalase solution in HEPES1 buffer, followed by incubation for 6 h. The labeled enzyme was purified by dialysis overnight and lyophilized.
Unilamellar liposome (L) stock solutions were prepared by drying 5 mg of lipids in chloroform (4.2 mg of DMPC and 0.8 mg of DPPC) under vacuum for 1 h, followed by rehydration into 1 mL of HEPES1 buffer. For catalase-loaded liposomes (Lcat and Lcatr), 2 mg mL–1 catalase and catr in HEPES1 buffer were used for rehydration, respectively. The solution was extruded first through 400 nm filters and then through 100 nm filters (11×) at 40 °C. Lcat and Lcatr were dialyzed for 36 h with four times changing the HEPES1 buffer solution. For fluorescent liposomes LF, 1 wt % NBD-PC was added to the lipid solution.
Alg Particle Assembly and Coating
Alg particles were prepared by D-μF. A microfluidic device with wide channel cross-section dimensions of 100 μm × 300 μm (depth × width) was used (Dolomite). The channels were rendered hydrophobic by coating with PFOTES (30 min). Three solutions (organic fluid, inorganic fluid, and receptor solution) were prepared to generate calcium cross-linked Alg particles. A mixture of 5 wt % of Span 80/TWEEN 80 (9/1 in weight ratio) in decane was used as the organic fluid. The inorganic fluid was prepared by dissolving 1.5 wt % Alg (containing 5 wt % labeled Alg for visualization) in HEPES1 buffer solution. Syringe pumps (Harvard Apparatus) were used to control the flow rates of these two solutions. The flow rates for organic fluid and inorganic fluid were 1.5 and 0.08 mL h–1, respectively. The receptor solution consisted of a 120 mM CaCl2 solution. The droplet production was visualized in a 1 × 81 motorized inverted Olympus microscope. Alg particles were separated from the receptor solution by three washing cycles in ultrapure water (4500 g, 2 min). To coat these Alg particles, they were suspended in a PLL solution (1 and 2 mg mL–1 in HEPES1 buffer, 15 min), followed by washing three times in HEPES1 buffer, yielding Alg+ and Alg+ (2×). If needed, the particles were suspended in a PMAc solution (1 mg mL–1 in HEPES1 buffer, 15 min) and washed three times in HEPES1 buffer, yielding Algc. The particle number of the stock solutions was counted using the microscope by averaging the particle number in 3 × 1 μL of solution. The Alg and Algc particles were imaged using the inverted Olympus microscope, and SEM images were taken using a field emission scanning electron microscope from FEI (Nova-600).
Microreactor Assembly
Microreactors were prepared by D-μF by adding either Lcat or cat to the Alg solution. With the aim to prevent the liposomes from aggregating during mixing with the Alg solution, they were coated with PLL by adding 100 μL of 0.1 mg mL–1 PLL solution dropwise to 100 μL of liposome stock solution, followed by 15 min incubation. Then, 200 μL of 3 wt % Alg solution (in HEPES1 buffer) was added dropwise to this mixture and used for the microreactor preparation by D-μF. Microreactors with different amounts of entrapped liposomes were prepared by controlling the liposome volume. Using L, LF, Lcat, and Lcatr yielded AlgL, AlgLF, AlgLcat, and AlgLcatr microreactors, respectively. Furthermore, 3 wt % Alg solution (in HEPES1 buffer) was mixed with 0.7 mg mL–1 or 2 mg mL–1 cat or catr in HEPES1 buffer solution in a volume ratio 1:1, and the mixture was used for the Algcat or Algcatr microreactor preparation, respectively. All microreactors were further coated with PLL and PMAc as mentioned above. The microreactors were visualized by using the inverted Olympus microscope or a confocal laser scanning microscope (Zeiss Axiovert microscope coupled to a LSM 700 confocal scanning module).
Microreactor Activity
AlgLcat and Algcat microreactor activities were measured using the Amplex Red assay kit. 25 000, 10 000, 6000, and 1200 microreactors in 25 μL of HEPES1 buffer reacted with 25 μL of 40 μM H2O2 for 30 min at RT, and then, 50 μL of 100 μM Amplex Red reagent solution and 0.4 U mL–1 HRP were added for 30 min at 37 °C. The fluorescence of the solution was measured in a multiplate reader. Also, 25 000 AlgLcat and Algcat microreactors were incubated in 2 mL of HEPES1 buffer at 37 °C for 24 h, and the microreactor activities before and after incubation were measured as described above. Furthermore, 10 000 AlgLcat and Algcat microreactors were exposed to 40 μM H2O2 for 30 min at RT or 37 °C, and the Amplex Red assay was used at RT. The statistical significance used to compare the distribution was determined using a one-way ANOVA with a confidence level of 95% (α = 0.05), followed by a Tukey’s post hoc test if the one-way ANOVA result was significant.
Cell Culture
The HepG2 human hepatocellular carcinoma cell line (European Collection of Cell Cultures) was used for all experiments. The HepG2 cells (1 500 000 cells per flask in 20 mL of cell medium) were cultured in 75 cm2 culture flasks in minimum Eagle’s essential medium supplemented with 10% fetal bovine serum, 50 U mL–1 penicillin, 50 μg mL–1 streptomycin, 1% nonessential amino acids, and 2 mM l-glutamine (all from Sigma) at 37 °C and 5% CO2.
Coculturing (Planar)
Glass slides (9 mm diameter) were cleaned via sonication in ethanol for 10 min, rinsed with ultrapure water, dried under nitrogen flow, and exposed to UV/ozone for 15 min. The Alg, Alg+, and Algc particles were cocultured with HepG2 cells in different cell/particle ratios. First, the particles were mixed with the cells, and then, the mixtures were seeded at a density of 180 000 cells per well in 1.5 mL of cell medium in 24-well plates and allowed to attach and proliferate for 24 h, 48 h, 72 h, 7 d, and 10 d at 37 °C and 5% CO2. The cell medium was exchanged every 2 d. Further, for the visualization of the integration of the microreactors into the HepG2 cell culture by CLSM, the Algcatr and AlgLcatr microreactors were cocultured with the HepG2 cells in a cell/microreactor number ratio of 10/1 using 180 000 cells per well in 1.5 mL of cell medium in 24-well plates for 6 h. The cultures were fixed in a cooled solution of glacial acetic acid (5% in EtOH, 10 min) and washed three times with phosphate-buffered saline (PBS). For cell staining, the cells were washed three times with PBS and then soaked in T-PBS (0.1 vol % Triton X-100 in PBS, 15 min), followed by blocking using 2% bovine serum albumin in T-PBS for 2 h at RT. Staining of focal adhesions was carried out by incubation with the primary antibody monoclonal antivinculin (10 mg mL–1, 1.5 h) and subsequent incubation with the secondary antibody Alexa Fluor 488 F(ab′)2 fragment of goat antimouse IgG (5 mg mL–1, 1 h). The nuclei and actin filaments were stained with DAPI (1 μg mL–1) and phalloidin (0.1 μg mL–1), respectively, during the second incubation step. The samples were washed carefully three times in T-PBS in between all abovementioned steps and stored in PBS at 4 °C in the dark until mounted on a glass cover slide using mounting medium (Eukitt, Sigma) for visualization. The live cells and fixed cells were imaged using the inverted Olympus microscope or CLSM. All cell experiments were performed in at least three independent repeats. The number of particles present after fixing was counted on two to three images of three independent repeats.
Cell Proliferation (Planar)
Alg, Alg+, and Algc were mixed with the HepG2 cells in a cell-to-particle ratio of 25/1, seeded at a density of 80 000 cells per well in 0.6 mL of cell medium in 48-well plates, and let to proliferate for 3 d at 37 °C and 5% CO2. Further, the Algc-containing cocultures were also allowed to proliferate for 7 and 10 d. The cell media was exchanged every 2 d. The metabolic activity of the cells in the cocultures was assessed by measuring the cellular dehydrogenase after 3, 7, and 10 d using the CCK-8 (Dojindo). The cell media was replaced with 200 μL of media containing 10 vol % assay solution in each well and incubated for 2 h at 37 °C and 5% CO2 prior to the absorption measurements using the multiplate reader. The results were normalized to untreated HepG2 monocultures. All cell experiments were performed in at least three independent repeats.
The PicoGreen cell proliferation assay was used to quantify the cell proliferation by measuring the amount of dsDNA following the protocol of the supplier. Briefly, Algc particles were cocultured with the HepG2 cells (a cell-to-particle ratio of 25/1 or 10/1 in 200 μL of cell medium) with 10 000 cells mL–1 in each well of a 48-well plate, and the cell medium was changed every 2 d. The cells were harvested and immediately frozen down after 72 h, 7 d, 10 d, and 13 d. Then, all cell samples were thawed, 1 mL of digestion solution in Dulbecco’s PBS buffer [125 μg mL–1 papain, 0.242 mg mL–1l-cysteine, and 0.333 M ethylenediaminetetraacetic acid (EDTA)] was added, and the mixtures were incubated overnight at 65 °C. Following on, the mixtures were diluted 32× using TE buffer (TE buffer, 1×, pH 7.5, is composed of 10 mM Tris-HCl and 1 mM EDTA.). Diluted samples (100 μL) were transferred to a 96-well plate, and 100 μL of 200× diluted PicoGreen reagent was added to each well, followed by incubation at RT for 2–5 min. A multiplate reader was used to measure the fluorescence of each well by setting the excitation wavelength to 480 nm and the emission wavelength to 520 nm. The amount of dsDNA of each sample was calculated according to the standard curve (Supporting Information, Figure S1).
Detoxification (Planar)
Fifty thousand cells and 5000 microreactors (Algcat, AlgLcat, or AlgL) in 100 μL of cell medium were seeded in each well of a 48-well plate. After 10 h, 100 μL of fresh cell medium containing different amounts of H2O2 (0–2 mM) was added to each well. After 24 h, the cell viability was assessed, or 200 μL of fresh cell medium containing different amounts of H2O2 was added to each well to double the cell medium volume while keeping the H2O2 concentration (0–0.5 mM) constant, followed by cell viability measurements. The cell viability was assessed using the CCK-8 by replacing the cell medium with 200 μL of cell medium containing 10 vol % assay solution in each well and incubating for 2 h at 37 °C and 5% CO2 prior to the absorption measurements using the multiplate reader. Three independent repeats in triplicates were performed. The statistical significance used to compare the distribution was determined using a one-way ANOVA with a confidence level of 95%, followed by a Tukey’s post hoc test if the one-way ANOVA result was significant.
Cell Aggregates
Algc particles (with PLL or PLLF coating) were cocultured with the HepG2 cells at cell-to-particle ratios of 25/1 and 10/1 in 96-well plates with an ultralow attachment surface (Dow Corning, Inc) with 22 500 cells per well in 300 μL of cell medium for 24 h, 3 d, and 7 d. Cell-only samples were prepared as a control. The cell medium was exchanged every 2 d. Further, the cocultures were imaged using the inverted Olympus microscope, and the sizes of the 3D tissue were measured. To visualize the integration of the microreactors into the HepG2 cell aggregates, cocultures after fixing and staining with DAPI and phalloidin were imaged using CLSM. All cell experiments were performed in at least three independent repeats.
Cell Viability (Cell Aggregates)
Three-dimensional tissue formed after 24 h, 3 d, and 7 d from cell-to-particle ratios 25/1 and 10/1, and only cells were stained by incubation at RT for 5 min with FDA (8 μg mL–1) and PI (20 μg mL–1), followed by visualization using CLSM. The dead-cell fraction was calculated based on the confocal images of two different images within the three independent repeats of days 3 and 7. Because the number of live and dead cells could not be counted on single slices of the CLSM images, the area of the live (green channel) and dead cells (red channel) was calculated using the ImageJ software. To account for the area difference between live and dead cells, as the stained nucleus of a dead cell is smaller than the stained area of a living cell, the area of the live cell fraction was divided by a factor of 3 (rough approximation). The dead-cell fraction was then calculated based on these areas. The statistical significance used to compare the distribution was determined using a one-way ANOVA with a confidence level of 99.9%.
Detoxification (Cell Aggregates)
Cell medium (100 μL) containing 22 500 cells and microreactors (Algc or Algcat) in a ratio of 25/1 or 10/1 was added per well in a 96-well plate with an ultralow attachment surface and let to incubate for 24 h. Then, 100 μL of fresh cell medium containing different amounts of H2O2 (0–2 mM) was added to each well. After 24 h incubation, the cell viability was assessed by replacing the cell medium with 120 μL of cell medium supplemented with 10 v % CCK-8. After incubation for 2 h at 37 °C and 5% CO2, the absorption was measured in a multiplate reader. Three independent repeats in triplicates were performed. The statistical significance used to compare the distribution was determined using a one-way ANOVA with a confidence level of 95%, followed by a Tukey’s post hoc test if the one-way ANOVA result was significant.
Acknowledgments
This work was supported by a grant from the Lundbeck Foundation, Denmark.
Supporting Information Available
The Supporting Information is available free of charge on the ACS Publications website at DOI: 10.1021/acsomega.7b01234.
Bright-field images of live cells in cocultures, assessment of cocultures with uncoated particles, details of microreactor activity, and quantification curves (PDF)
The authors declare no competing financial interest.
Supplementary Material
References
- Hosta-Rigau L.; Stadler B.. Subcompartmentalized Systems Toward Therapeutic Cell Mimics. In Selected Topics in Nanomedicine, 3rd ed.; Chang T. M. S., Ed.; World Science Publisher/Imperial College Press: Singapore, 2013; pp 281–299. [Google Scholar]
- Peters R. J. R. W.; Louzao I.; van Hest J. C. M. From polymeric nanoreactors to artificial organelles. Chem. Sci. 2012, 3, 335–342. 10.1039/c2sc00803c. [DOI] [Google Scholar]
- Tanner P.; Baumann P.; Enea R.; Onaca O.; Palivan C.; Meier W. Polymeric Vesicles: From Drug Carriers to Nanoreactors and Artificial Organelles. Acc. Chem. Res. 2011, 44, 1039–1049. 10.1021/ar200036k. [DOI] [PubMed] [Google Scholar]
- Ben-Haim N.; Broz P.; Marsch S.; Meier W.; Hunziker P. Cell-Specific Integration of Artificial Organelles Based on Functionalized Polymer Vesicles. Nano Lett. 2008, 8, 1368–1373. 10.1021/nl080105g. [DOI] [PubMed] [Google Scholar]
- Tanner P.; Onaca O.; Balasubramanian V.; Meier W.; Palivan C. G. Enzymatic Cascade Reactions inside Polymeric Nanocontainers: A Means to Combat Oxidative Stress. Chem.—Eur. J. 2011, 17, 4552–4560. 10.1002/chem.201002782. [DOI] [PubMed] [Google Scholar]
- van Dongen S. F. M.; Verdurmen W. P. R.; Peters R. J. R. W.; Nolte R. J. M.; Brock R.; van Hest J. C. M. Cellular Integration of an Enzyme-Loaded Polymersome Nanoreactor. Angew. Chem., Int. Ed. 2010, 49, 7213–7216. 10.1002/anie.201002655. [DOI] [PubMed] [Google Scholar]
- Tanner P.; Balasubramanian V.; Palivan C. G. Aiding Nature’s Organelles: Artificial Peroxisomes Play Their Role. Nano Lett. 2013, 13, 2875–2883. 10.1021/nl401215n. [DOI] [PubMed] [Google Scholar]
- Thingholm B.; Schattling P.; Zhang Y.; Städler B. Subcompartmentalized Nanoreactors as Artificial Organelle with Intracellular Activity. Small 2016, 12, 1806–1814. 10.1002/smll.201502109. [DOI] [PubMed] [Google Scholar]
- Chang F.-P.; Chen Y.-P.; Mou C.-Y. Intracellular Implantation of Enzymes in Hollow Silica Nanospheres for Protein Therapy: Cascade System of Superoxide Dismutase and Catalase. Small 2014, 10, 4785–4795. 10.1002/smll.201401559. [DOI] [PubMed] [Google Scholar]
- Chang F.-P.; Hung Y.; Chang J.-H.; Lin C.-H.; Mou C.-Y. Enzyme Encapsulated Hollow Silica Nanospheres for Intracellular Biocatalysis. ACS Appl. Mater. Interfaces 2014, 6, 6883–6890. 10.1021/am500701c. [DOI] [PubMed] [Google Scholar]
- Godoy-Gallardo M.; Labay C.; Jansman M. M. T.; Ek P. K.; Hosta-Rigau L. Intracellular Microreactors as Artificial Organelles to Conduct Multiple Enzymatic Reactions Simultaneously. Adv. Healthcare Mater. 2017, 6, 1601190. 10.1002/adhm.201601190. [DOI] [PubMed] [Google Scholar]
- Marguet M.; Bonduelle C.; Lecommandoux S. Multicompartmentalized Polymeric Systems: towards Biomimetic Cellular Structure and Function. Chem. Soc. Rev. 2013, 42, 512–529. 10.1039/c2cs35312a. [DOI] [PubMed] [Google Scholar]
- Chandrawati R.; Caruso F. Biomimetic Liposome- and Polymersome-Based Multicompartmentalized Assemblies. Langmuir 2012, 28, 13798–13807. 10.1021/la301958v. [DOI] [PubMed] [Google Scholar]
- Trantidou T.; Friddin M.; Elani Y.; Brooks N. J.; Law R. V.; Seddon J. M.; Ces O. Engineering Compartmentalized Biomimetic Micro- and Nanocontainers. ACS Nano 2017, 11, 6549–6565. 10.1021/acsnano.7b03245. [DOI] [PubMed] [Google Scholar]
- Teo B. M.; Hosta-Rigau L.; Lynge M. E.; Städler B. Liposome-Containing Polymer Films and Colloidal Assemblies towards Biomedical Applications. Nanoscale 2014, 6, 6426–6433. 10.1039/c4nr00459k. [DOI] [PubMed] [Google Scholar]
- Elani Y.; Law R. V.; Ces O. Vesicle-based artificial cells as chemical microreactors with spatially segregated reaction pathways. Nat. Commun. 2014, 5, 5305. 10.1038/ncomms6305. [DOI] [PubMed] [Google Scholar]
- Chiu H.-C.; Lin Y.-W.; Huang Y.-F.; Chuang C.-K.; Chern C.-S. Polymer Vesicles Containing Small Vesicles within Interior Aqueous Compartments and pH-Responsive Transmembrane Channels. Angew. Chem., Int. Ed. 2008, 47, 1875–1878. 10.1002/anie.200704078. [DOI] [PubMed] [Google Scholar]
- Fu Z.; Ochsner M. A.; de Hoog H.-P. M.; Tomczak N.; Nallani M. Multicompartmentalized Polymersomes for Selective Encapsulation of Biomacromolecules. Chem. Commun. 2011, 47, 2862–2864. 10.1039/c0cc03971c. [DOI] [PubMed] [Google Scholar]
- Kim S.-H.; Shum H. C.; Kim J. W.; Cho J.-C.; Weitz D. A. Multiple Polymersomes for Programmed Release of Multiple Components. J. Am. Chem. Soc. 2011, 133, 15165–15171. 10.1021/ja205687k. [DOI] [PubMed] [Google Scholar]
- Peters R. J. R. W.; Marguet M.; Marais S.; Fraaije M. W.; van Hest J. C. M.; Lecommandoux S. Cascade Reactions in Multicompartmentalized Polymersomes. Angew. Chem., Int. Ed. 2014, 53, 146–150. 10.1002/anie.201308141. [DOI] [PubMed] [Google Scholar]
- Siti W.; de Hoog H.-P. M.; Fischer O.; Shan W. Y.; Tomczak N.; Nallani M.; Liedberg B. An intercompartmental enzymatic cascade reaction in channel-equipped polymersome-in-polymersome architectures. J. Mater. Chem. B 2014, 2, 2733–2737. 10.1039/c3tb21849j. [DOI] [PubMed] [Google Scholar]
- Chandrawati R.; Odermatt P. D.; Chong S.-F.; Price A. D.; Städler B.; Caruso F. Triggered Cargo Release by Encapsulated Enzymatic Catalysis in Capsosomes. Nano Lett. 2011, 11, 4958–4963. 10.1021/nl202906j. [DOI] [PubMed] [Google Scholar]
- Hosta-Rigau L.; York-Duran M. J.; Zhang Y.; Goldie K. N.; Städler B. Confined Multiple Enzymatic (Cascade) Reactions within Poly(dopamine)-based Capsosomes. ACS Appl. Mater. Interfaces 2014, 6, 12771–12779. 10.1021/am502743z. [DOI] [PubMed] [Google Scholar]
- Schattling P.; Dreier C.; Städler B. Janus subcompartmentalized microreactors. Soft Matter 2015, 11, 5327–5335. 10.1039/c5sm01161b. [DOI] [PubMed] [Google Scholar]
- Hosta-Rigau L.; York-Duran M. J.; Kang T. S.; Städler B. Extracellular Microreactor for the Depletion of Phenylalanine Toward Phenylketonuria Treatment. Adv. Funct. Mater. 2015, 25, 3860–3869. 10.1002/adfm.201404180. [DOI] [Google Scholar]
- Zhang Y.; Baekgaard-Laursen M.; Städler B. Small Subcompartmentalized Microreactors as Support for Hepatocytes. Adv. Healthcare Mater. 2017, 6, 1601141. 10.1002/adhm.201601141. [DOI] [PubMed] [Google Scholar]
- Chandrawati R.; Hosta-Rigau L.; Vanderstraaten D.; Lokuliyana S. A.; Städler B.; Albericio F.; Caruso F. Engineering Advanced Capsosomes: Maximizing the Number of Subcompartments, Cargo Retention, and Temperature-Triggered Reaction. ACS Nano 2010, 4, 1351–1361. 10.1021/nn901843j. [DOI] [PubMed] [Google Scholar]
- Lynge M. E.; Laursen M. B.; Hosta-Rigau L.; Jensen B. E. B.; Ogaki R.; Smith A. A. A.; Zelikin A. N.; Städler B. Liposomes as Drug Deposits in Multilayered Polymer Films. ACS Appl. Mater. Interfaces 2013, 5, 2967–2975. 10.1021/am4006868. [DOI] [PubMed] [Google Scholar]
- Lee K. Y.; Mooney D. J. Alginate: Properties and biomedical applications. Prog. Polym. Sci. 2012, 37, 106–126. 10.1016/j.progpolymsci.2011.06.003. [DOI] [PMC free article] [PubMed] [Google Scholar]
- Sun J.; Tan H. Alginate-Based Biomaterials for Regenerative Medicine Applications. Materials 2013, 6, 1285. 10.3390/ma6041285. [DOI] [PMC free article] [PubMed] [Google Scholar]
- Sackmann E. K.; Fulton A. L.; Beebe D. J. The present and future role of microfluidics in biomedical research. Nature 2014, 507, 181–189. 10.1038/nature13118. [DOI] [PubMed] [Google Scholar]
- Armada-Moreira A.; Taipaleenmäki E.; Itel F.; Zhang Y.; Städler B. Droplet-microfluidics towards the assembly of advanced building blocks in cell mimicry. Nanoscale 2016, 8, 19510–19522. 10.1039/c6nr07807a. [DOI] [PubMed] [Google Scholar]
- Leong J.-Y.; Lam W.-H.; Ho K.-W.; Voo W.-P.; Lee M. F.-X.; Lim H.-P.; Lim S.-L.; Tey B.-T.; Poncelet D.; Chan E.-S. Advances in fabricating spherical alginate hydrogels with controlled particle designs by ionotropic gelation as encapsulation systems. Particuology 2016, 24, 44–60. 10.1016/j.partic.2015.09.004. [DOI] [Google Scholar]
- Wang Q.; Liu S.; Wang H.; Zhu J.; Yang Y. Alginate droplets pre-crosslinked in microchannels to prepare monodispersed spherical microgels. Colloids Surf., A 2015, 482, 371–377. 10.1016/j.colsurfa.2015.06.041. [DOI] [Google Scholar]
- Lan J.; Chen J.; Li N.; Ji X.; Yu M.; He Z. Microfluidic generation of magnetic-fluorescent Janus microparticles for biomolecular detection. Talanta 2016, 151, 126–131. 10.1016/j.talanta.2016.01.024. [DOI] [PubMed] [Google Scholar]
- Liu H.; Li G.; Sun X.; He Y.; Sun S.; Ma H. Microfluidic generation of uniform quantum dot-encoded microbeads by gelation of alginate. RSC Adv. 2015, 5, 62706–62712. 10.1039/c5ra10688e. [DOI] [Google Scholar]
- Mazutis L.; Vasiliauskas R.; Weitz D. A. Microfluidic Production of Alginate Hydrogel Particles for Antibody Encapsulation and Release. Macromol. Biosci. 2015, 15, 1641–1646. 10.1002/mabi.201500226. [DOI] [PubMed] [Google Scholar]
- Hu Y.; Azadi G.; Ardekani A. M. Microfluidic fabrication of shape-tunable alginate microgels: Effect of size and impact velocity. Carbohydr. Polym. 2015, 120, 38–45. 10.1016/j.carbpol.2014.11.053. [DOI] [PubMed] [Google Scholar]
- Dang T. D.; Joo S. W. Preparation of tadpole-shaped calcium alginate microparticles with sphericity control. Colloids Surf., B 2013, 102, 766–771. 10.1016/j.colsurfb.2012.09.016. [DOI] [PubMed] [Google Scholar]
- Lin Y.-S.; Yang C.-H.; Hsu Y.-Y.; Hsieh C.-L. Microfluidic synthesis of tail-shaped alginate microparticles using slow sedimentation. Electrophoresis 2013, 34, 425–431. 10.1002/elps.201200282. [DOI] [PubMed] [Google Scholar]
- Li M.; Joung D.; Hughes B.; Waldman S. D.; Kozinski J. A.; Hwang D. K. Wrinkling Non-Spherical Particles and Its Application in Cell Attachment Promotion. Sci. Rep. 2016, 6, 30463. 10.1038/srep30463. [DOI] [PMC free article] [PubMed] [Google Scholar]
- Correia C. R.; Reis R. L.; Mano J. F. Multilayered Hierarchical Capsules Providing Cell Adhesion Sites. Biomacromolecules 2013, 14, 743–751. 10.1021/bm301833z. [DOI] [PubMed] [Google Scholar]
- Quent V. M. C.; Loessner D.; Friis T.; Reichert J. C.; Hutmacher D. W. Discrepancies between metabolic activity and DNA content as tool to assess cell proliferation in cancer research. J. Cell. Mol. Med. 2010, 14, 1003–1013. 10.1111/j.1582-4934.2010.01013.x. [DOI] [PMC free article] [PubMed] [Google Scholar]
- Khani Z.; Jolivalt C.; Cretin M.; Tingry S.; Innocent C. Alginate/carbon composite beads for laccase and glucose oxidase encapsulation: application in biofuel cell technology. Biotechnol. Lett. 2006, 28, 1779–1786. 10.1007/s10529-006-9160-1. [DOI] [PubMed] [Google Scholar]
- Bhushan I.; Parshad R.; Qazi G. N.; Gupta V. K. Immobilization of Lipase by Entrapment in Ca-alginate Beads. J. Bioact. Compat. Polym. 2008, 23, 552–562. 10.1177/0883911508097866. [DOI] [Google Scholar]
- Baysal S. H. Alginate Beads Encapsulation Matrix for Urease and Polyethyleneglycol-Urease. Artif. Cells, Blood Substitutes, Biotechnol. 2007, 35, 457–465. 10.1080/10731190701460374. [DOI] [PubMed] [Google Scholar]
- Srivastava R.; Brown J. Q.; Zhu H.; McShane M. J. Stable Encapsulation of Active Enzyme by Application of Multilayer Nanofilm Coatings to Alginate Microspheres. Macromol. Biosci. 2005, 5, 717–727. 10.1002/mabi.200500061. [DOI] [PubMed] [Google Scholar]
- Lee J.; Kim J. Multiphasic Sensory Alginate Particle Having Polydiacetylene Liposome for Selective and More Sensitive Multitargeting Detection. Chem. Mater. 2012, 24, 2817–2822. 10.1021/cm3015012. [DOI] [Google Scholar]
- Ullrich M.; Hanuš J.; Dohnal J.; Štěpánek F. Encapsulation stability and temperature-dependent release kinetics from hydrogel-immobilised liposomes. J. Colloid Interface Sci. 2013, 394, 380–385. 10.1016/j.jcis.2012.11.016. [DOI] [PubMed] [Google Scholar]
- Hanuš J.; Ullrich M.; Dohnal J.; Singh M.; Štěpánek F. Remotely Controlled Diffusion from Magnetic Liposome Microgels. Langmuir 2013, 29, 4381–4387. 10.1021/la4000318. [DOI] [PubMed] [Google Scholar]
- Sakchareonkeat P.; Huang T.-C.; Suwannaporn P.; Chiang Y. H.; Hsu J. L.; Hong Y. H. Encapsulation efficiency of coenzyme Q10-liposomes in alginate. J. Nutr. Food Sci. 2013, 43, 150–160. 10.1108/00346651311313463. [DOI] [Google Scholar]
- Städler B.; Chandrawati R.; Price A. D.; Chong S.-F.; Breheney K.; Postma A.; Connal L. A.; Zelikin A. N.; Caruso F. A Microreactor with Thousands of Subcompartments: Enzyme-Loaded Liposomes within Polymer Capsules. Angew. Chem., Int. Ed. 2009, 48, 4359–4362. 10.1002/anie.200900386. [DOI] [PubMed] [Google Scholar]
Associated Data
This section collects any data citations, data availability statements, or supplementary materials included in this article.


