Abstract
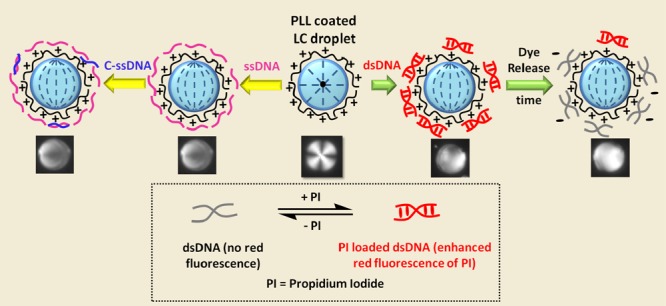
Interactions between DNA and adsorbed poly(l-lysine) (PLL) on liquid crystal (LC) droplets were investigated using polarizing optical microcopy and epi-fluorescence microscopy. Earlier, we demonstrated that adsorption of PLL to the LC/aqueous interface resulted in homeotropic orientation of the LC and thus exhibited a radial configuration of the LC confined within the droplets. Subsequent adsorption of DNA (single-stranded DNA/double-stranded DNA) at PLL-coated LC droplets was found to trigger an LC reorientation within the droplets, leading to preradial/bipolar configuration of those droplets. To our surprise, subsequent exposure of complementary ssDNA to ssDNA/adsorbed PLL-modified LC droplets did not cause the LC reorientation. This is likely due to the formation of polyplexes (DNA–PLL complex) as confirmed by fluorescence microscopy and atomic force microscopy. In addition, dsDNA-adsorbed PLL droplets have been found to be effectively useful to displace (controlled release) propidium iodide (a model drug) encapsulated within dsDNA over time. These observations suggest the potential for a label-free droplet-based LC detection system that can respond to DNA and may provide a simple method to develop DNA-based drug nanocarriers.
Introduction
Recently, micrometer-sized liquid crystal (LC) droplets dispersed in aqueous media have been exploited to the development of functional materials for the realization of a new class of sensitive communicators of targeted species.1−17 Because of having a large surface area with high spatial resolution and a very high sensitivity, they offer routes toward advancement of new passive biosensors. The detection principle is based on the change in the configurational transition of the LC within the droplets that can be easily visualized with the naked eye under an optical microscope. For example, droplet-based LCs have been reported as a sensing platform for developing immunoassays4 and detecting glucose,5 bacterial endotoxin at the pg mL–1 concentration,6 bacteria and viruses,7 KB cancer cells,9 cholic acid,10 and many more.11−14 Recently, we have shown that layer-by-layer (LbL) coating of poly(l-lysine) (PLL) on LC droplets can provide a simple design for cell-based sensors.17−19 In addition, these PLL-coated droplets were shown to be useful for the detection of healthy and apoptosis cells that are difficult to achieve via other analytical techniques. In this paper, we have exploited the behavior of PLL-coated LC droplets which could be particularly useful for sensitive detection of DNA and can find applications in controlled release of drug molecules from DNA-functionalized LC droplets. DNA has been widely offering numerous applications in sensing, diagnostics, and gene therapy,20−22 and more recently, self-assembled DNA nanostructures have emerged as promising candidates to serve as nanocarriers for drug delivery, primarily because of their biocompatibility and the natural ability of DNA to associate with several anticancer agents, for example, doxorubicin.23 Efforts are being made on developing relevant designs to predict and study the drug release behavior as well as release mechanisms applicable to a wide range of nanosized dosage forms.24,25 As DNA-based drug delivery systems start to advance toward clinical use, we wanted to further explore LC/aqueous interface of PLL–LC droplets to develop new principles for understanding and studying the real-time controlled release profile of anti-cancer drugs encapsulated in DNA molecules.
A literature survey reveals a wide range of approaches to detect DNA using LCs.26−32 For example, Schwartz and co-workers showed that interactions between ssDNA and a cationic surfactant led to changes of surfactant coverage at the LC/aqueous interface and triggered an orientational ordering transition of the LC from the homeotropic to a planar state.26,27 Subsequent hybridization with complementary ssDNA (c-ssDNA) governed a reorientation of the LC at those interfaces. The same group also demonstrated that the conformational change of the adenosine aptamer upon binding with adenosine led to LC reorientation at the LC/aqueous interface.28 Yang and co-workers developed a new strategy of detecting DNA targets using self-assembled cholesterol-labeled DNA probes at the LC/aqueous interface in a planar geometry.29 Tan et al. demonstrated that the conformational changes of the DNA probe mediated by various metal ions cause the reorientation of the LCs.30 Wu and co-workers described the detection of a target gene in high sensitivity through changes in the optical response of the LC caused by formation of self-assembly of DNA dendrimers from hairpin DNA probes by the hybridization chain reaction at the surfactant-doped LC/aqueous interface.31 Munir and Park demonstrated use of an LC-based DNA biosensor for the detection of traces of myricetin that propitiate the cleavage of DNA and thus results in an ordering transition of the LC.32 Recently, Yang and co-workers reported that the assembly of DNA–lipid amphiphiles could not trigger the orientational ordering of LCs at the LC/aqueous interface. However, in the presence of lipids, the DNA–lipids preferred to form net-like structures which disappeared after hybridization with the complementary DNA.33 However, no efforts have been made till today that can exploit the speed and sensitivity of LC droplets to detect DNA. In this paper, we first demonstrated that PLL-coated LC droplets can be used to detect DNA that are mediated by topological defects leading to configurational transitions of those droplets. In addition, responsive DNA-functionalized PLL droplets have been found useful to displace propidium iodide (PI), a model drug, encapsulated in DNA over time, thereby providing a template for controlled drug release.
The study reported in this paper was motivated by two goals. First, we sought to develop a simple design for the detection of DNA using a droplet-based LC sensor that can be observed as changes in the optical appearance of the LC using optical microscopy. The design builds from our prior reports17−19 that demonstrated a simple LbL method to prepare PLL-coated droplets in which PLL strongly interacts with the LC and triggers a configurational transition of the LC from bipolar to radial. We hypothesized that negatively charged DNA can strongly adsorb on positively charged PLL-coated LC droplets, leading to LC reorientation of those droplets. Second, we sought to demonstrate a simple template that can displace a model drug encapsulated in DNA over time from these LbL nano-films and can be a promising approach to develop new and alternative way for drug delivery. We have been successful to show that under physiological conditions, these DNA-adsorbed PLL droplets exhibit release of PI encapsulated in DNA molecules over time.
Results and Discussion
In our previous work, multilayer LbL coating of alternate poly(styrene sulphonate) and PLL, with PLL being the outermost layer on the LC droplets, revealed the stabilization of the radial configuration of the LC droplets.17 These PLL-coated LC droplets have been found to respond to the cellular environment by triggering the configurational transitions of the LCs from radial to bipolar. Motivated by our prior studies,17−19 first, we aimed to fabricate single PLL layer-coated LC [4-cyano-4-pentylbiphenyl (5CB)/E7] droplets and sought to determine the ordering of the LC within those droplets. In the presence of PLL, LC emulsion droplets (at pH 7.0) undergo an ordering transition from bipolar to radial, confirming adsorption of PLL at LC/aqueous interfaces. The stabilization of radial droplets is primarily due to the intermolecular hydrogen bonding between 5CB LC and PLL, as reported earlier.17 Under cross polarizers, they exhibited radial configuration having a cross-like appearance (Figure 1a). This was further supported by a bright field micrograph that shows a single-point defect at the center of the droplets (indicated by the blue arrow in Figure 1c). These PLL-coated LC droplets were found to be stable in the radial configuration for several months (as shown in Figure S1), and the zeta potential has been measured as +25.0 mV, suggesting the coating of cationic PLL residues. It should be noted that PLL-modified 5CB droplets showed coexistence of radial and bipolar LC droplets below pH 7.0, which is consistent with the previous report.17 Therefore, we carried out the experiments at pH 7 and above to observe the interactions of PLL with DNA (see below).
Figure 1.
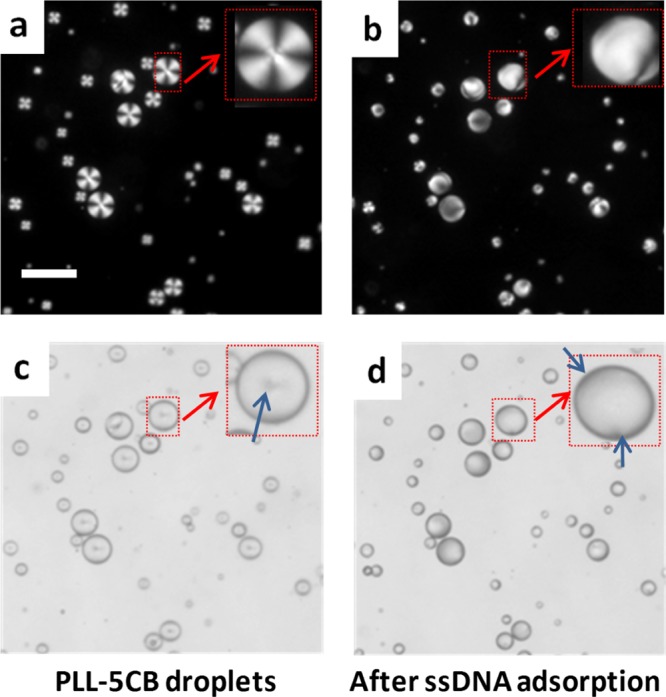
Polarized optical and corresponding bright-field micrograph images of PLL-coated LC droplets in contact with: (a,c) 0 μM ssDNA and (b,d) 30 μM ssDNA. The LC droplets were in radial states (a,c) before but transitioned to a bipolar/preradial state (b,d) 10 s after the addition of ssDNA. The insets within (a–d) indicate the higher magnification version of the red arrow-marked LC droplet. Blue arrows in (c,d) indicate the point defect in the center of a radial droplet and two defects at the poles of a bipolar droplet, respectively. Scale bar = 50 μm.
Our next experiment was sought to determine whether these PLL-coated LC micro-droplets would respond to the presence of anionic DNA. Interestingly, the addition of 30 μM ssDNA on 5 μL (∼104 droplets) of PLL–5CB droplet emulsion resulted in a rapid change (<10 s) in the director configuration of the LC molecules from radial to bipolar/preradial when observed under crossed polars (as shown in Figure 1b). Bright-field microscopy confirms the bipolar/preradial configuration exhibiting twopoint defects at the poles of the droplets (indicated by the blue arrows in Figure 1d). This experiment suggests that DNA is likely adsorbed on PLL-coated LC droplets and the rapid ordering transition is likely due to the strong electrostatic interaction between negatively charged DNA and positively charged PLL (vide infra).
Adsorption of ssDNA on the PLL-modified 5CB droplets was investigated by the fluorescence and bright-field microscopy of PLL–5CB droplets. The strong fluorescence on the surface of the 5CB droplet (Figure 2a) confirmed the presence and adsorption of FAM–ssDNA at PLL–5CB droplets, and the bright-field microscopy image of the same droplet (Figure 2b) reveals bipolar configuration of the PLL-modified 5CB droplets which further supports the adsorption of negatively charged ssDNA on positively charged PLL–5CB droplets. These observations established that the configuration transition mediated by topological defects of the PLL–5CB droplets can be monitored to provide a fast and real-time optical detection of ssDNA. This is primarily driven owing to strong electrostatic interactions between negatively charged oligonucleotides and positively charged PLL moieties at the interface.
Figure 2.
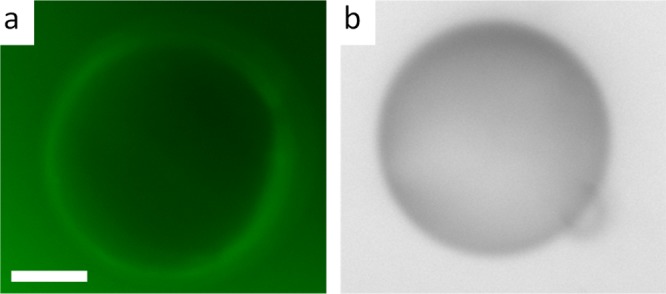
Epi-fluorescence microscopic image (a) and the corresponding bright-field image (b) of a PLL-coated 5CB droplet following 60 min incubation with 30 μM FAM-tagged fluorescent ssDNA. Green fluorescence on the surface of the droplet supports the adsorption of ssDNA on PLL-coated droplets. The bright-field image confirms the bipolar configuration of the 5CB droplet. Scale bar = 10 μm.
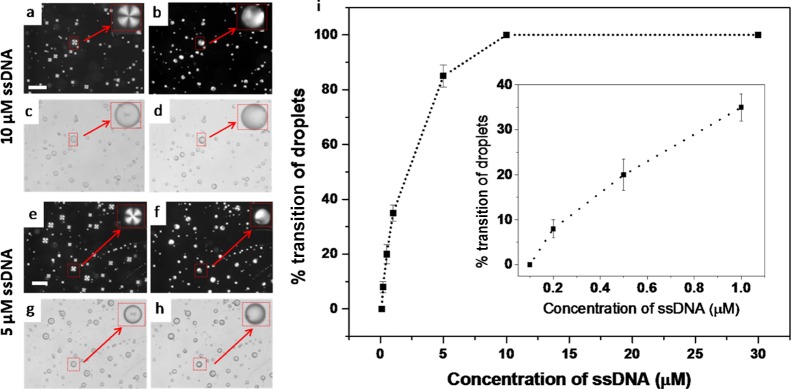
In the next experiment, we sought to determine the effect of varying the concentration of ssDNA on the orientational ordering of the LC within PLL–5CB droplets. Figure 3a,e and 3b,f correspond to the polarizing optical microcopy (POM) images of the PLL–LC droplets before and after 10 s of the addition of 10 and 5 μM ssDNA, respectively. The corresponding bright-field micrographs are shown in Figure 3c,g and 3d,h. A change in the configuration of the droplets from radial to bipolar/preradial was observed in both cases. After careful investigation of these images, it was found that when the concentration of ssDNA is 10 μM (CssDNA = 10 μM), most of the PLL–5CB droplets are able to induce the configurational transition of the LC within those droplets. By contrast, introduction of 5 μM ssDNA (CssDNA = 5 μM) revealed co-existence of both bipolar and radial LC droplets. Therefore, in the next set of experiments, we sought to draw an analogy between the number of droplets demonstrating radial-to-bipolar/preradial transition upon adsorption of varying concentration of ssDNA. From the transition plot in Figure 3i, we observed that the number of PLL–5CB droplets demonstrating radial-to-bipolar/preradial transition decreases with the decrease in the concentration of ssDNA added. More precisely, we note three key findings. First, for CssDNA ≥ 10 μM, all droplets (100%) change their configuration from radial to preradial/bipolar. Second, for 0.2 μM ≤ CssDNA < 10 μM, only a fraction of the droplets (10–90%) show the radial-to-preradial/bipolar transition which decreases with the decrease in the concentration of ssDNA (upto 0.2 μM). Third, there is no configuration transition of the PLL–5CB droplets observed when the concentration of CssDNA < 0.2 μM.
Figure 3.
Polarized optical (a,b,e,f) and bright-field (c,d,g,h) images of the PLL–LC droplets before (a,c,e,g) and after 10 s of addition of 10 μM (b,d) and 5 μM (f,h) ssDNA, respectively. The insets within (a–h) illustrate the higher magnification version of the arrow-marked LC droplet. Graph (i) shows % conversion of PLL–LC droplet configuration from radial to bipolar/preradial on the addition of varying concentration of ssDNA with a fixed amount of PLL–5CB droplets (5 μL). Inset shows the enlarged view of the plot representing the concentration of ssDNA less than 1 μM. Scale bar = 70 μm.
In Figure 4, zeta potential (ζ-) measurements reveal that PLL–5CB droplets have cationic charge density with a ζ-value of +49.6 mV, particularly because of the cationic amino groups of the PLL chains adsorbed at the LC/aqueous interface. This value decreases in magnitude with the increasing concentration of ssDNA attaining a saturation value of approximately −15.6 mV at CssDNA = 10 μM. The negative ζ-values can be attributed to the anionic phosphate groups of the ssDNA backbone adsorbed at the surface of PLL–5CB droplets. From the percent transition plot and the ζ-measurements, we found that 10 μM ssDNA is the minimum concentration of ssDNA required to show the configurational transition of all radial 5CB droplets to bipolar/preradial. Below this concentration, some PLL–5CB droplets show the bipolar/preradial configuration while others remain in the radial configuration, likely because of not enough adsorption of ssDNA on PLL–5CB droplets.
Figure 4.
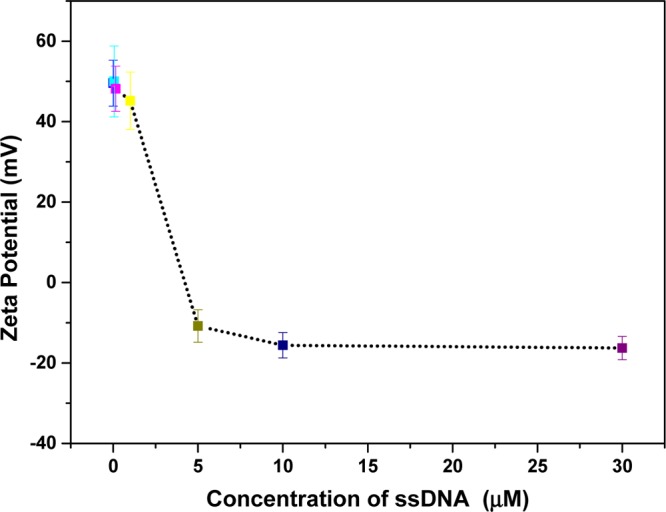
Zeta potential of PLL-coated LC droplets with varying concentrations of ssDNA. With increasing concentrations of ssDNA on PLL–LC droplets, zeta potential values drop from positive to negative, suggesting the adsorption of anionic ssDNA at the LC/aqueous interface.
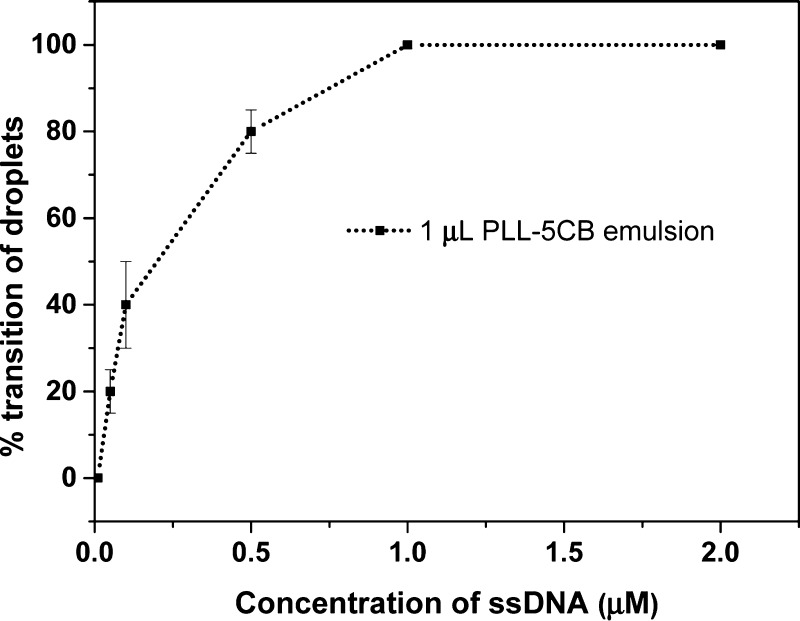
It may be hypothesized that the sensitivity of the PLL–5CB droplets toward ssDNA can be increased by modulating the volume of PLL–5CB emulsion. To verify this, the volume of PLL–5CB droplet emulsion is reduced from 5 to 1 μL following the addition of the constant volume (5 μL) of different concentrations of ssDNA. Interestingly, as shown in Figure 5, the concentration of ssDNA required to trigger the configurational transition (radial to bipolar/preradial for all droplets) of the LC within the droplets is reduced to 1 μM. We found that when the concentration of ssDNA is between 1 and 0.05 μM (1 μM < CssDNA ≥ 0.05 μM), co-existence of the radial, preradial, and bipolar droplets was observed. The number of bipolar droplets decreases with the decreasing concentration of ssDNA. However, below 0.05 μM of ssDNA (CssDNA < 0.05 μM), no change in the director configuration was observed in the PLL–5CB droplets. Therefore, we infer that the sensitivity of the PLL–5CB droplets toward ssDNA can be increased to 50 nM by decreasing the volume of emulsion of PLL–5CB droplets to 1 μL. The huge decrease in the detection limit of ssDNA from 200 to 50 nM by decreasing the volume of emulsion from 5 to 1 μL can be attributed to the following two factors: first, the reduced number of droplets in the sample which reduces the requirement of the amount of the anionic ssDNA needed to trigger a transition in PLL–5CB droplets. Second, the reduced volume of the emulsion results in the less dilution of the ssDNA sample, thus ultimately raising the amount of ssDNA available for adsorption at PLL–5CB droplets.
Figure 5.
Graph showing % transition of PLL–LC droplet configuration from radial to bipolar/preradial on the addition of varying concentrations of ssDNA with the fixed volume of PLL–5CB droplets (1 μL) (with the limit of detection = 50 nM ssDNA with 20% change in droplets).
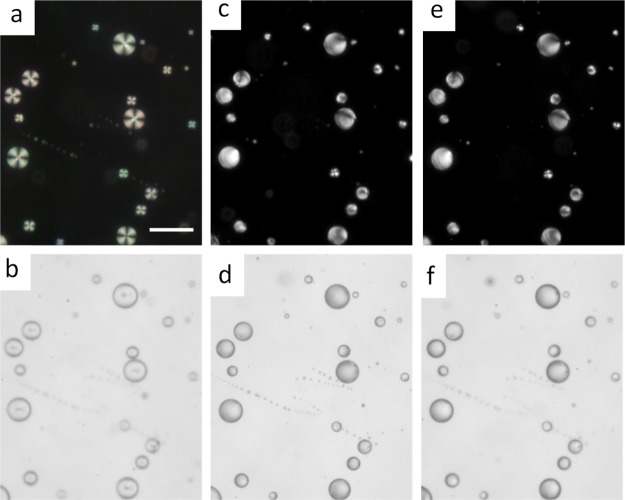
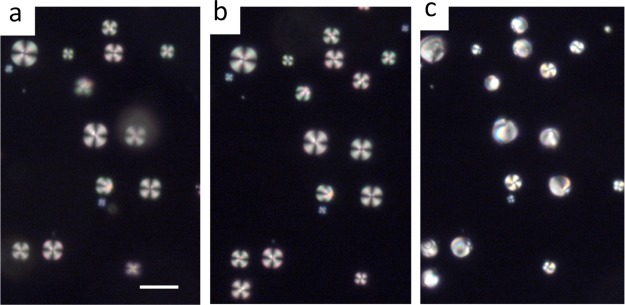
Next, we sought to monitor the hybridization of ssDNA at PLL–5CB droplets with its c-ssDNA sequence on those droplets. To our surprise, the addition of c-ssDNA onto ssDNA-coated PLL–5CB droplets does not trigger the reordering in the orientational transition of LC molecules; these droplets remain bipolar or preradial as before (Figure 6a–f). This observation is contrary to the earlier findings by Schwartz and co-workers which demonstrated that ssDNA and dsDNA impose different orientational ordering of the LC molecular axis at the surfactant-laden LC/aqueous interface.26,27 They proposed that the ionic interaction between the anionic phosphate backbone of ssDNA and the cationic surfactant along with the hydrophobic interaction between nucleobases and LC are likely responsible for homeotropic to planar orientational ordering of the LCs, while upon hybridization, the nucleobases no longer remain exposed to interact with the LC, thereby allowing more surfactant molecules to self-assemble at the LC/aqueous interface, leading to the reorientation of the LCs to the homeotropic alignment. In our case, the reordering of the LC does not take place in presence of c-ssDNA. We propose a plausible event taking place in the ssDNA–PLL–5CB system. First, ssDNA forms a very strong ionic complex with PLL (i.e., polyplex) at the LC/aqueous interface, thereby causing an orientational transition of PLL–LC droplets from radial to bipolar/preradial. Being a high-molecular-weight cationic polymer, PLL can be expected to effectively neutralize the repulsion between ssDNA and c-ssDNA and allow the hybridization to occur between nucleobases of the two strands without disturbing the PLL–ssDNA interaction at the droplet interface. Second, the hybridized dsDNA remains adsorbed at the surface of PLL–LC droplets and maintains the anionic charge density on the PLL–LC droplets required to retain the bipolar/preradial configuration of those droplets. Therefore, we add that perhaps hydrophobic interactions between nucleobases and LCs do not play any significant role in determining the internal configuration of the director of LCs inside the PLL–LC droplets. In addition, hybridization could also be restricted because of formation of polyplexes between ssDNA and PLL at the LC/aqueous interface.
Figure 6.
LC response to ssDNA adsorption and hybridization with c-ssDNA: polarized microscopy images (a,c,e) and bright-field images (b,d,f) of the PLL-coated 5CB droplets before (a,b), after subsequent adsorption of 10 μM ssDNA (c,d) and after the addition of the 10 μM c-ssDNA target (e,f). Scale bar = 50 μm.
To prove the above hypothesis, we carried out a series of experiments. First, we intend to visually locate c-ssDNA upon addition into ssDNA–PLL–5CB droplets. When FAM–c-ssDNA–(ssDNA–PLL–5CB) droplets were imaged under fluorescence and bright-field microscopy, green fluorescence was spotted around the surface of the bipolar 5CB droplets, confirming the presence of c-ssDNA on the ssDNA–PLL–5CB droplets (Figure 7a,b). Here, we would like to state that the fluorescence observed on FAM–c-ssDNA–(ssDNA–PLL–5CB) droplets was less intense than that of the FAM–ssDNA–PLL–5CB droplets (keeping the exposure time constant). This can be explained by the restricted adsorption of FAM–c-ssDNA molecules on the ssDNA–PLL–5CB droplets, primarily because of the less exposed nucleobases of the ssDNA for H-bonding with c-ssDNA (after ssDNA forms polyplexes with PLL), (vide infra) at the LC/aqueous interface.
Figure 7.
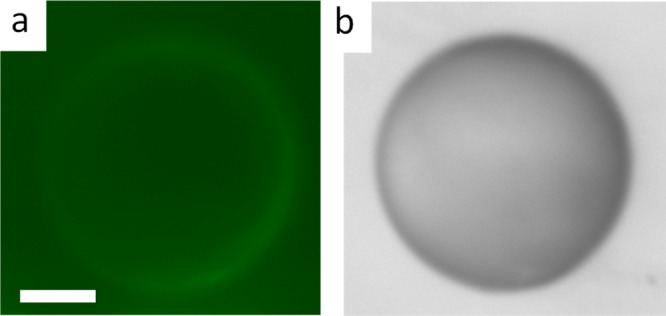
Epi-fluorescence microscopic image (a) and corresponding bright-field image (b) of an ssDNA-adsorbed PLL–5CB droplet after incubation with 30 μM FAM-tagged fluorescent c-ssDNA. Little fluorescence at the surface of droplets shows the presence of c-ssDNA while the bright-field image confirms the bipolar configuration of PLL–LC droplet. Scale bar = 10 μm.
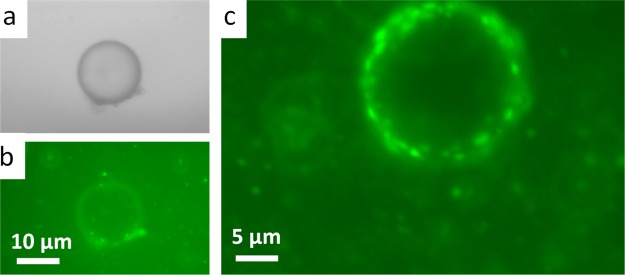
Our next goal was to determine the formation of polyplexes between ssDNA and PLL at the LC/aqueous interface. For that, 30 μM FAM–ssDNA was incubated with PLL–5CB droplets in the presence of excess PLL. Fluorescence microscopic and bright-field investigations in Figure 8a–c reveal the intense fluorescent structures present at the bipolar droplets’ surface and in the surrounding solution. The observed fluorescent structures in Figure 8b,c are proposed as a result of complex formation between ssDNA and PLL, that is, polyplexes resulting probably due to the attractive electrostatic interaction between the negatively charged phosphate backbone of ssDNA and positively charged PLL.
Figure 8.
Bright-field (a) and corresponding epi-fluorescence microscopic image (b) of a PLL–5CB droplet after adsorption of 30 μM FAM-tagged fluorescent ssDNA in the presence of excess PLL. Epi-fluorescence microscopic image (c) corresponds to another PLL–5CB droplet after adsorption of 30 μM FAM fluorescent ssDNA clearly showing the presence of fluorescent polyplexes at the surface of the droplet.
Our next goal was to characterize the morphology of polyplexes formed by atomic force microscopy (AFM). In Figure S2a, the AFM image of polyplexes shows the spherical-shaped structures with their sizes ranging from ∼60 to ∼400 nm in diameter, which is consistent with the previous reports.34,35 When ssDNA or PLL alone was observed by AFM (Figure S2b,c), no such structures were observed, which confirms the formation of compact nanocomplexes between PLL and ssDNA as shown in Figure S2a. Further, to understand the strength of the polyplex along with its ability to release ssDNA from the polyplex, the effect of the polyplex on the orientational configuration of PLL–5CB droplets was monitored. A preincubated mixture (5 μL) of 0.5 mg/mL PLL and 50 μM ssDNA was added to 5 μL PLL–5CB droplets already placed on a glass slide. It was observed that the radial configuration of the PLL–5CB droplets remains unchanged upon introduction of polyplexes, suggesting the unavailability of ssDNA to cause the configurational transition of the PLL–5CB droplets (Figure 9a,b). Moreover, when 30 μM of free ssDNA was added on the same PLL–5CB droplets, the LC droplets changed their configuration from radial to bipolar/preradial in less than 10 s (Figure 9c). These observations strengthen our proposition that ssDNA forms a very stable and strong polyplex with PLL. As a result, ssDNA is not freely released from the polyplex. Thus, it is unable to interact with PLL at the surface of PLL–5CB droplets, ultimately failing to trigger the configurational transition of the LC droplets.
Figure 9.
Polarized microscopy images of PLL–5CB droplets (a) before, (b) after the addition of a preincubated mixture of 0.5 mg/mL PLL and 50 μM ssDNA and (c) after 30 s of subsequent addition of free ssDNA. The polyplex fails to trigger the radial-to-bipolar configuration of LC droplets, suggesting unavailability of free ssDNA; however, subsequent addition of free DNA rapidly induces the director configuration transition from radial to bipolar/preradial. Scale bar = 50 μm.
To further visually locate the ssDNA in the polyplex on PLL-coated 5CB droplets, a fluorescent polyplex was prepared by adding 50 μM FAM-ssDNA with 0.5 mg/mL PLL and then subsequently incubated with PLL–5CB droplets for 30 min in the dark. As expected, PLL–LC droplets were seen to retain the radial configuration with a single defect at the center of the droplets as observed under bright-field microscopy. In fluorescence microscopy, little fluorescence around the droplet was observed, and intensely fluorescent polyplex structures (highlighted in Figure S3a) were observed near the 5CB droplet, suggesting that a very small amount of ssDNA from the polyplex is adsorbed at the surface of the PLL–5CB droplet. Besides, this amount of anionic charge density of ssDNA cannot induce the bipolar/preradial configuration in PLL-coated 5CB droplets (Figure S3). In addition, a literature survey reveals how the PLL’s high affinity for DNA has been the limiting factor in successful transfection during gene delivery. High-molecular-weight PLL-based polyplexes have shown a reduced capacity for dissociation than their low-molecular-weight counterparts which dissociate readily and are more efficient in transfection.36 Our experiments add further insight in understanding how the orientational ordering of the LC inside the PLL-coated 5CB droplets are triggered by anionic charge density of DNA at the LC/aqueous interface provided by either polyplex formation after adsorption of ssDNA or c-ssDNA after hybridization at the LC/aqueous interface.
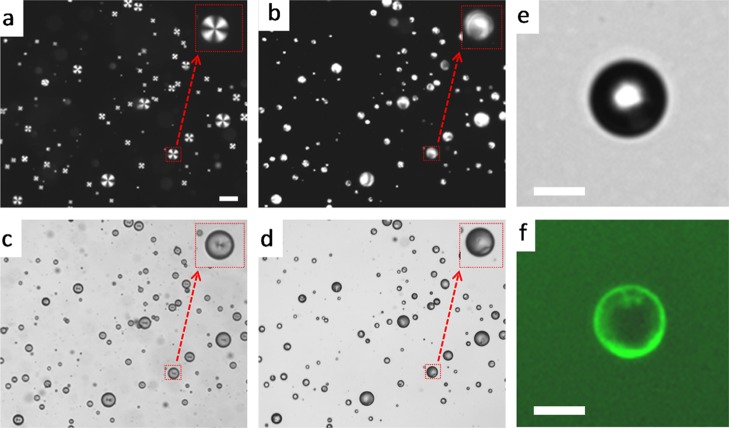
Next, we sought to verify the role of interactions of nucleobases with the 5CB LC or PLL in decoding the orientational transitions of PLL–5CB droplets. As a proof of concept, we chose dsDNA which offers an anionic phosphate backbone and unexposed nucleobases and further hypothesized that dsDNA would provide the similar orientational response of PLL–5CB droplets as was seen with ssDNA. When 5 μL of 30 μM dsDNA was introduced on 5 μL PLL–5CB emulsion droplets, initial radial droplets started changing their configuration to bipolar/preradial within seconds of addition, and 100% droplets changed to bipolar/preradial within 10 min as observed under POM and bright-field microscopy (Figure 10a–d). When fluorescently labeled dsDNA was used, dsDNA was preferentially located at the surface of the droplets, confirming the adsorption of dsDNA at the surface of PLL–5CB droplets (Figure 10e,f). The configuration transition of PLL–LC droplets upon adsorption of dsDNA reveals the importance of electrostatic forces between DNA (ssDNA/dsDNA) and PLL over hydrophobic interactions between nucleobases and 5CB molecules. This proves that hydrophobic interactions between ssDNA and the LC are unlikely responsible for configuration transition from radial to bipolar/preradial in PLL–LC droplets.
Figure 10.
Polarized optical and corresponding bright-field micrograph images of PLL–5CB droplets (a,c) before and (b,d) after in contact with 30 μM dsDNA. The LC droplets were in radial states (a,c) before but transitioned to a bipolar/preradial state (b,d) after the addition of dsDNA. The insets within (a–d) indicate the higher magnification version of the red arrow-marked LC droplet. Scale bar = 50 μm. Bright-field microscopic (e) and corresponding epi-fluorescence image (f) of a PLL-coated 5CB droplet following 60 min incubation with 30 μM FAM-tagged fluorescent dsDNA. Green fluorescence present on the surface of the droplets supports the adsorption of FAM-tagged dsDNA. Scale bar = 10 μm.
After establishing the principles that trigger DNA-induced configurational transition in PLL-coated LC droplets, we planned to exploit the stronger affinity of those PLL–LC droplets for DNA and sought to demonstrate if our novel PLL-coated LC droplets could provide a platform to understand and study the controlled drug release profile from dsDNA-based drug delivery systems. For this, we propose that anticancer drug molecules intercalated in dsDNA be released over time when the dsDNA–drug complex comes in contact with PLL–LC droplets as a result of competitive interaction between dsDNA and PLL–5CB droplets. As a proof of concept, PI displacement assay was employed as PI and ethidium bromide displacement fluorescence assay are the most commonly used methods to investigate the binding of polyammonium cations to DNA.37−40 This assay was employed because of the two important functions that PI fulfills. First, PI binds to dsDNA only (not ssDNA) enhancing fluorescence emission of PI (20–30 times more than that of the isolated PI), providing a straightforward quantification of the PI encapsulated in dsDNA (as confirmed in Figure S4). This fluorescence assay rules out the contribution of fluorescence intensity from the released PI present in the solution. Second, it (PI) intercalates in between the dsDNA strands via noncovalent interactions such as H-bonding and pi–pi stacking interactions with its nucleobases, similar to the mechanism by which various antitumor drugs such as doxorubicin bind to the DNA bases.41 Therefore, PI presents itself as a best drug substitute in our study.
Motivated by this, next, we designed experiments to observe the effect of the dsDNA–PI complex on the configuration of the PLL–LC droplets. Herein, PI-encapsulated FAM-labeled dsDNA was incubated with PLL–LC droplets for 30 min prior to the observation. In Figure 11a, bright-field microscopy reveals the bipolar droplets, confirming the configurational transition of the PLL–LC droplets. Fluorescence microscopy images (Figure 11b,c) reveals the direct correspondence between the location of PI (red) and dsDNA (green) fluorescence at the surface of the droplets, confirming the adsorption of the dsDNA–PI complex at PLL–LC droplets. In particular, the fluorescent PI was favorably confined at the LC/aqueous interface of the droplet where the green fluorescent dsDNA was present.
Figure 11.
Bright-field image (a) showing bipolar configuration and epi-fluorescence microscopic images (b) under 460 nm excitation filter and a 534 nm emission filter showing green fluorescence of FAM–dsDNA and (c) red fluorescence of PI on a PLL–5CB droplet following 30 min incubation with PI-intercalated FAM-tagged dsDNA. Scale bar = 10 μm.
Next, we sought to study the behavior of the PI release profile from DNA at room temperature upon interaction of the dsDNA–PI complex with PLL–5CB droplets with time using steady-state fluorescence. Herein, we used nonfluorescent dsDNA and incubated it with PI so as to avoid the complexity in the system. The detected fluorescence intensity of PI was plotted against the droplet incubation time (Figure 12a). In the presence of the PLL solution, it can be seen that fluorescence intensity of PI upon the addition of PLL decreased to almost half within 30 min and to minimum in 2 h, reflecting that PLL effectively and swiftly displaces the PI from the dsDNA–PI complex, whereas in the absence of PLL, the fluorescence intensity of PI remains approximately the same over a period of 6 days, suggesting the stable intercalation of PI in dsDNA strands over this period of time. This observation is in agreement with the previous studies where binding of the various PLLs to plasmid DNA has been studied using a fluorescence quenching assay involving ethidium bromide.42,43 However, when the dsDNA–PI complex was incubated with PLL–5CB droplets, red fluorescence intensity of PI started decreasing gradually, dipping to approximately its one-third value in 144 h (demonstrated by the black plot in Figure 12a). These data show that PI-binding sites in DNA become gradually unavailable with increasing PLL–DNA binding at the LC/aqueous interface. The gradual decrease in the fluorescence intensity can be explained by the limited effectiveness of the PLL bound on 5CB droplets than the free PLL which rapidly displaces PI from DNA. Even after 6 days, (DNA–PI)–PLL–5CB droplets were found to retain their bipolar configuration, confirming the sustained and stable adsorption of FAM-tagged dsDNA at PLL–LC droplets (Figure S5). Hence, the PLL–5CB droplets have been shown as a novel prototype where the LC (5CB) droplet interface slowly induces drug release from DNA while maintaining the adsorption of DNA at the interface which can be monitored by the internal configuration of the LC droplets. Figure 12b shows the cartoon representation of the orientational configurations of the PLL–LC droplets upon adsorption of the DNA–PI complex and after the release of PI from the complex induced by PLL–5CB droplets over time.
Figure 12.
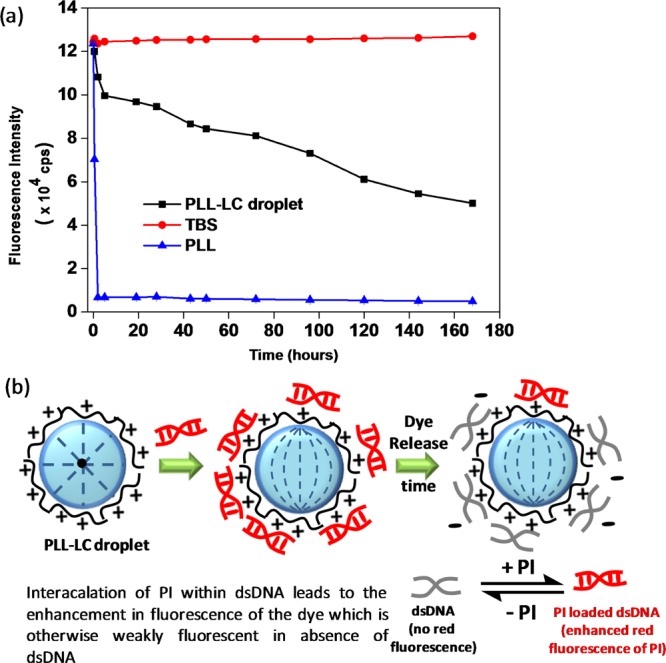
(a) Fluorescence intensity vs time plot showing fluorescence intensity of PI in the presence of tris-buffered saline (TBS) buffer (red curve), aqueous solution of PLL (blue curve), and PLL–LC droplets (black curve) at pH 7.4. Decay in the fluorescence of PI in the presence of PLL–LC droplets and PLL indicates the controlled and fast release of PI from the DNA–PI complex, respectively. (b) Schematic illustration demonstrating the preservation of the orientational configuration of the LC droplets during PI release from its complex with DNA induced by PLL–5CB droplets over time.
Conclusions
In summary, our study describes that PLL-coated 5CB droplets provide a simple method to detect ssDNA/dsDNA at aqueous/LC interfaces. Our approach is able to detect oligonucleotides through changes in the configurational transition of the droplets from radial to bipolar or preradial. The method is highly sensitive, and we believe that electrostatic interactions between PLL and DNA (and not hydrophobic interaction of nucleobases) play a major role for the ordering transition. We also show that DNA-functionalized PLL-coated droplets can be used as a simple measure to study the controlled drug (model) release from the DNA–drug complex, utilizing the stronger competitive interaction of DNA with PLL that weakens the interaction between DNA and drugs. These findings demonstrated the use of PLL-coated LC droplets to study other biological interactions and also open a new venture in further development to study the controlled drug release from DNA-based drug delivery systems.
Experimental Section
Materials
Oligonucleotide sequences TGG TGA AGT AGA TGT GTA (ssDNA), TAC ACA TCT ACT TCA CCA (C-ssDNA), TTT CGC AAT GAC TGT ACT (NC-ssDNA), and FAM-TGG TGA AGT AGA TGT GTA (FAM-ssDNA) were purchased from IDT Technologies. PI, 5CB, TBS, and poly-l-lysine (PLL) solution 0.1% (w/v) in H2O (mol. wt. 225 kDa) were obtained from Sigma-Aldrich (St. Louis, MO). The E7 LC was obtained from Merck (Mumbai, India). Deionization of a distilled water (DI water) source was performed using a Milli-Q system (Millipore, Bedford, MA). Fisher’s Finest Premium grade glass microscopic slides were obtained from Fischer Scientific (Pittsburgh, PA).
Preparation of PLL-Modified LC Droplets
PLL-modified LC (5CB or E7) droplets were formed as follows. First, 5CB droplets were prepared by vortexing 10 μL of the LC in 1 mL of DI water, followed by sonication for 5 min. The resultant emulsion was centrifuged at 5000 rpm for 5 min, and the supernatant was replaced by 1 mg/mL PLL solution. The PLL–LC droplets were kept for 30 min at room temperature for the adsorption of PLL on the LC droplets. Adsorption of PLL on the surface of the LC droplets leads to the radial configuration of the director of LC molecules inside the droplet. The PLL-modified LC droplets were then washed with DI water through centrifugation to remove the excess PLL and were re-suspended in DI water or TBS at different pH for further experiments. To estimate the number of droplets in the emulsion, 1 μL of the PLL–5CB droplet emulsion was placed on a clean glass slide, and multiple POM images were captured to illustrate the whole sample area. From the POM images, the total number of droplets was counted to be ∼2 × 10³ droplets per μL. The size of the polydispersed PLL-coated LC droplets ranges from 5 to 40 μm as conceived from the POM images.
Optical Characterization of PLL-Modified LC Droplets
The orientational ordering of the LC was determined using a Zeiss polarizing microscope (Scope.A1 with cross polars with magnifications ×200 and ×1000). All images were captured using a AxioCam Camera.
Adsorption of ssDNA
In experiments associated with the adsorption of ssDNA on PLL-coated 5CB droplets, 5 μL of the aqueous solution of ssDNA of different concentrations was added on 5 μL of 5CB emulsion (if not stated otherwise) already placed on a clean glass slide. The droplets were real-time imaged under polarized optical and bright-field microscopes. For the transition curve of adsorption of ssDNA, a fixed volume of PLL–LC emulsion droplets (5 or 1 μL) was exposed to different concentrations of ssDNA with a constant adsorption time (20 min), and the percent transition of the droplets from radial to preradial/bipolar upon the addition of ssDNA (calculated from three sets of experiments) was plotted against the concentration of ssDNA (Figure 3i). Excess PLL-containing PLL–5CB droplets were prepared by sonicating 10 μL 5CB in 1 mL aqueous solution of PLL and used as such without removing the unbound PLL by centrifugation. These experiments were also reproduced using PLL-modified E7 droplets (data not shown).
Zeta Potential Measurements
Zeta potential measurements of the PLL-coated 5CB droplets were carried out using the Zetasizer Nano ZS90 instrument (Malvern Instruments Inc.) at room temperature under a cell-driven voltage of 30 V. In a typical experiment, 40 μL of PLL–5CB droplets was diluted with DI water to a total volume of 800 μL before transferring into the zeta potential cuvette, and the average of 5 scans was taken for each measurement. For experiments with ssDNA, 10 μL of stock solution of ssDNA was added to the 40 μL of PLL–5CB droplet emulsion to make the final required concentration of ssDNA and incubated for 15 min before diluting to 800 μL aqueous solutions.
Epi-fluorescence Imaging of the Aqueous/LC Interface of the PLL–LC Droplets
PLL-coated 5CB droplets (50 μL) were incubated with 30 μL of 30 μM FAM–ssDNA (final concentration of ssDNA becomes 11.25 μM) for 60 min and washed thrice with a buffer prior to fluorescence imaging performed with a Zeiss (Scope.A1) fluorescence microscope. For experiments with c-ssDNA on ssDNA–PLL-modified 5CB droplets, 30 μL of 30 μM FAM-tagged c-ssDNA was introduced in 11.25 μM ssDNA-coated PLL–5CB emulsion (80 μL) and incubated for 60 min prior to fluorescence investigation. The samples were viewed using a fluorescence filter cube with a 460 nm excitation filter and a 534 nm emission filter. Images were obtained with an AxioCam camera attached to the microscope.
Steady-State Fluorescence of PI Encapsulated inside DNA on PLL–5CB Droplets
All steady-state fluorescence measurements were carried out on a FluoroMax-4 spectrofluorometer from Horiba Jobin Yvon at ∼25 °C. dsDNA was prepared by mixing equal volumes of ssDNA and c-ssDNA of the same molar concentration for 12 h at room temperature. Hybridization of the ssDNA and c-ssDNA has been confirmed by the gel electrophoresis (see Figure S6). Encapsulation of PI with dsDNA was carried out by mixing together 150 μM dsDNA and 375 μM PI and incubated for 48 h in the dark with occasional mild stirring. The stock mixture (6 μL) containing 150 μM dsDNA and 375 μM PI was added in 200 μL TBS (pH 7.4) or 200 μL 0.5 mg/mL PLL or 200 μL PLL-coated 5CB droplets emulsion suspended in TBS (pH 7.4) and kept for incubation for 10 min in the dark at room temperature. Aliquots from the samples were withdrawn at different time intervals, and the fluorescence intensity of PI (three measurements) was collected at the following parameters: λex = 540 nm, λem = 617 nm, excitation slit width = 1 nm, emission slit width = 4 nm, and integration time = 2 s. All fluorescence data were acquired using the FluorEssence software (provided with the instrument) which were later re-plotted using Origin Pro version 9 software.
Atomic Force Microscopy
Samples of PLL or ssDNA were prepared by diluting 10 times the aqueous solution of 0.5 mg/mL PLL or 50 μM ssDNA. The diluted sample (5 μL) was loaded on a freshly cleaved, water-washed muscovite mica (Grade V-4 mica from SPI, PA) and allowed to air dry for 15–20 min. Polyplexes were prepared by mixing together the aqueous solutions of ssDNA and PLL, yielding final concentrations of 50 μM ssDNA and 0.5 mg/mL PLL, respectively, which was further diluted 10 times before proceeding for AFM as described above.
Acknowledgments
This work was carried out with the financial support from IISER Mohali. S.K.P. is grateful for INSA Medal for Young Scientist 2015 and the financial support from INSA bearing Sanction no. SP/YSP/124/2015/433. We thank Hema M Swasthi and Dr. Samrat Mukhopadhyay for AFM measurements. We sincerely thank Dr. Zhongqiang Yang, Tsinghua University, China, for providing some DNA samples and many helpful discussions. I.V. acknowledges the receipt of a graduate fellowship from IISER Mohali.
Supporting Information Available
The Supporting Information is available free of charge on the ACS Publications website at DOI: 10.1021/acsomega.7b01175.
Gel electrophoresis data of DNA hybridization, AFM study and epi-fluorescence microscopy of polyplexes, epi-fluorescence microscopy images of PI with ssDNA and dsDNA, epi-fluorescence images of the PI–dsDNA complex on PLL–5CB droplets after 6 days (PDF)
Author Contributions
The manuscript was written through contributions of all authors. All authors have given approval to the final version of the manuscript.
The authors declare no competing financial interest.
Supplementary Material
References
- Gupta J. K.; Sivakumar S.; Caruso F.; Abbott N. L. Size-Dependent Ordering of Liquid Crystals Observed in Polymeric Capsules with Micrometer and Smaller Diameters. Angew. Chem., Int. Ed. 2009, 121, 1680–1683. 10.1002/ange.200804500. [DOI] [PubMed] [Google Scholar]
- Sivakumar S.; Gupta J. K.; Abbott N. L.; Caruso F. Monodisperse Emulsions through Templating Polyelectrolyte Multilayer Capsules. Chem. Mater. 2008, 20, 2063–2065. 10.1021/cm703237a. [DOI] [Google Scholar]
- Tjipto E.; Cadwell K. D.; Quinn J. F.; Johnston A. P. R.; Abbott N. L.; Caruso F. Tailoring the Interfaces between Nematic Liquid Crystal Emulsions and Aqueous Phases via Layer-by-Layer Assembly. Nano Lett. 2006, 6, 2243–2248. 10.1021/nl061604p. [DOI] [PubMed] [Google Scholar]
- Aliño V. J.; Pang J.; Yang K.-L. Liquid Crystal Droplets as a Hosting and Sensing Platform for Developing Immunoassays. Langmuir 2011, 27, 11784–11789. 10.1021/la2022215. [DOI] [PubMed] [Google Scholar]
- Kim J.; Khan M.; Park S.-Y. Glucose Sensor using Liquid-Crystal Droplets Made by Microfluidics. ACS Appl. Mater. Interfaces 2013, 5, 13135–13139. 10.1021/am404174n. [DOI] [PubMed] [Google Scholar]
- Lin I.-H.; Miller D. S.; Bertics P. J.; Murphy C. J.; de Pablo J. J.; Abbott N. L. Endotoxin-Induced Structural Transformations in Liquid Crystalline Droplets. Science 2011, 332, 1297–1300. 10.1126/science.1195639. [DOI] [PMC free article] [PubMed] [Google Scholar]
- Sivakumar S.; Wark K. L.; Gupta J. K.; Abbott N. L.; Caruso F. Liquid Crystal Emulsions as the Basis of Biological Sensors for the Optical Detection of Bacteria and Viruses. Adv. Funct. Mater. 2009, 19, 2260–2265. 10.1002/adfm.200900399. [DOI] [Google Scholar]
- Aliño V. J.; Tay K. X.; Khan S. A.; Yang K.-L. Inkjet Printing and Release of Monodisperse Liquid Crystal Droplets from Solid Surfaces. Langmuir 2012, 28, 14540–14546. 10.1021/la3028463. [DOI] [PubMed] [Google Scholar]
- Yoon S. H.; Gupta K. C.; Borah J. S.; Park S.-Y.; Kim Y.-K.; Lee J.-H.; Kang I.-K. Folate Ligand Anchored Liquid Crystal Microdroplets Emulsion for in Vitro Detection of KB Cancer Cells. Langmuir 2014, 30, 10668–10677. 10.1021/la502032k. [DOI] [PubMed] [Google Scholar]
- Bera T.; Fang J. Optical Detection of Lithocholic Acid with Liquid Crystal Emulsions. Langmuir 2013, 29, 387–392. 10.1021/la303771t. [DOI] [PubMed] [Google Scholar]
- Khan M.; Park S.-Y. Specific Detection of Avidin–Biotin Binding Using Liquid Crystal Droplets. Colloids Surf., B 2015, 127, 241–246. 10.1016/j.colsurfb.2015.01.047. [DOI] [PubMed] [Google Scholar]
- Bera T.; Deng J.; Fang J. Protein-Induced Configuration Transitions of Polyelectrolyte-Modified Liquid Crystal Droplets. J. Phys. Chem. B 2014, 118, 4970–4975. 10.1021/jp501587h. [DOI] [PubMed] [Google Scholar]
- Bera T.; Fang J. Polyelectrolyte-Coated Liquid Crystal Droplets for Detecting Charged Macromolecules. J. Mater. Chem. 2012, 22, 6807–6812. 10.1039/c2jm00038e. [DOI] [Google Scholar]
- Gupta J. K.; Zimmerman J. S.; de Pablo J. J.; Caruso F.; Abbott N. L. Characterization of Adsorbate-Induced Ordering Transitions of Liquid Crystals within Monodisperse Droplets. Langmuir 2009, 25, 9016–9024. 10.1021/la900786b. [DOI] [PubMed] [Google Scholar]
- Khan W.; Choi J. H.; Kim G. M.; Park S.-Y. Microfluidic Formation of pH Responsive 5CB Droplets Decorated with PAA-b-LCP. Lab Chip 2011, 11, 3493–3498. 10.1039/c1lc20402e. [DOI] [PubMed] [Google Scholar]
- Kinsinger M. I.; Buck M. E.; Abbott N. L.; Lynn D. M. Immobilization of Polymer-Decorated Liquid Crystal Droplets on Chemically Tailored Surfaces. Langmuir 2010, 26, 10234–10242. 10.1021/la100376u. [DOI] [PMC free article] [PubMed] [Google Scholar]
- Sidiq S.; Prasad G. V. R. K.; Mukhopadhaya A.; Pal S. K. Poly(l-lysine)-Coated Liquid Crystal Droplets for Cell-Based Sensing Applications. J. Phys. Chem. B 2017, 121, 4247–4256. 10.1021/acs.jpcb.7b00551. [DOI] [PubMed] [Google Scholar]
- Sidiq S.; Pal S. K. Liquid Crystal Biosensors: New Approaches. Proc. Indian Natl. Sci. Acad. 2016, 82, 75–98. 10.16943/ptinsa/2016/v82i1/48445. [DOI] [Google Scholar]
- Setia S.; Sidiq S.; De J.; Pani I.; Pal S. K. Applications of Liquid Crystals in Biosensing and Organic Light-Emitting Devices: Future Aspects. Liq. Cryst. 2016, 43, 2009–2050. 10.1080/02678292.2016.1213002. [DOI] [Google Scholar]
- Niemz A.; Ferguson T. M.; Boyle D. S. Point-of-care Nucleic Acid Testing for Infectious Diseases. Trends Biotechnol. 2011, 29, 240–250. 10.1016/j.tibtech.2011.01.007. [DOI] [PMC free article] [PubMed] [Google Scholar]
- Kirby J.; Heath P. R.; Shaw P. J.; Hamdy F. C.. Gene Expression Assays. Advances in Clinical Chemistry; Elsevier Science Publishing Co. Inc., 2007; Vol. 44, pp 247–292. [DOI] [PubMed] [Google Scholar]
- Stone D. Novel Viral Vector Systems for Gene Therapy. Viruses 2010, 2, 1002–1007. 10.3390/v2041002. [DOI] [PMC free article] [PubMed] [Google Scholar]
- Mohan P.; Rapoport N. Doxorubicin as a Molecular Nanotheranostic Agent: Effect of Doxorubicin Encapsulation in Micelles or Nanoemulsions on the Ultrasound-Mediated Intracellular Delivery and Nuclear Trafficking. Mol. Pharmaceutics 2010, 7, 1959–1973. 10.1021/mp100269f. [DOI] [PMC free article] [PubMed] [Google Scholar]
- D’Souza S. Review of In Vitro Drug Release Test Methods for Nano-Sized Dosage Forms. Adv. Pharmacol. 2014, 2014, 1–12. 10.1155/2014/304757. [DOI] [Google Scholar]
- Schwarzl R.; Du F.; Haag R.; Netz R. R. General Method for the Quantification of Drug Loading and Release Kinetics of Nanocarriers. Eur. J. Pharm. Biopharm. 2017, 116, 131–137. 10.1016/j.ejpb.2016.12.015. [DOI] [PubMed] [Google Scholar]
- Price A. D.; Schwartz D. K. DNA Hybridization-Induced Reorientation of Liquid Crystal Anchoring at the Nematic Liquid Crystal/Aqueous Interface. J. Am. Chem. Soc. 2008, 130, 8188–8194. 10.1021/ja0774055. [DOI] [PubMed] [Google Scholar]
- McUmber A. C.; Noonan P. S.; Schwartz D. K. Surfactant–DNA Interactions at the Liquid Crystal–Aqueous Interface. Soft Matter 2012, 8, 4335–4342. 10.1039/c2sm07483d. [DOI] [Google Scholar]
- Noonan P. S.; Roberts R. H.; Schwartz D. K. Liquid Crystal Reorientation Induced by Aptamer Conformational Changes. J. Am. Chem. Soc. 2013, 135, 5183–5189. 10.1021/ja400619k. [DOI] [PubMed] [Google Scholar]
- Lai S. L.; Hartono D.; Yang K.-L. Self-Assembly of Cholesterol DNA at Liquid Crystal/Aqueous Interface and its Application for DNA Detection. Appl. Phys. Lett. 2009, 95, 153702–153704. 10.1063/1.3247895. [DOI] [Google Scholar]
- Xiao F.; Tan H.; Wu Y.; Liao S.; Wu Z.; Shen G.; Yu R. A Novel Logic Gate Based on Liquid-Crystals Responding to DNA Conformational Transition. Analyst 2016, 141, 2870–2873. 10.1039/c6an00504g. [DOI] [PubMed] [Google Scholar]
- Tan H.; Li X.; Liao S.; Yu R.; Wu Z. Highly-Sensitive Liquid Crystal Biosensor based on DNA Dendrimers-Mediated Optical Reorientation. Biosens. Bioelectron. 2014, 62, 84–89. 10.1016/j.bios.2014.06.029. [DOI] [PubMed] [Google Scholar]
- Munir S.; Park S.-Y. Liquid Crystal-Based DNA Biosensor for Myricetin Detection. Sens. Actuators, B 2016, 233, 559–565. 10.1016/j.snb.2016.04.107. [DOI] [Google Scholar]
- Zhou J.; Dong Y.; Zhang Y.; Liu D.; Yang Z. The Assembly of DNA Amphiphiles at Liquid Crystal-Aqueous Interface. Nanomaterials 2016, 6, 229–238. 10.3390/nano6120229. [DOI] [PMC free article] [PubMed] [Google Scholar]
- Wolfert M. A.; Schacht E. H.; Toncheva V.; Ulbrich K.; Nazarova O.; Seymour L. W. Characterization of Vectors for Gene Therapy formed by Self-Assembly of DNA with Synthetic Block Co-Polymers. Gene Ther. 1996, 7, 2123–2133. 10.1089/hum.1996.7.17-2123. [DOI] [PubMed] [Google Scholar]
- Mann A.; Richa R.; Ganguli M. DNA Condensation by Poly-L-Lysine at the Single Molecule Level: Role of DNA Concentration and Polymer Length. J. Controlled Release 2008, 125, 252–262. 10.1016/j.jconrel.2007.10.019. [DOI] [PubMed] [Google Scholar]
- de Ilarduya C. T.; Sun Y.; Düzgüneş N. Gene Delivery by Lipoplexes and Polyplexes. Eur. J. Pharm. Sci. 2010, 40, 159–170. 10.1016/j.ejps.2010.03.019. [DOI] [PubMed] [Google Scholar]
- Cain B. F.; Baguley B. C.; Denny W. A. Potential Antitumor Agents. 28. Deoxyribonucleic Acid Polyintercalating Agents. J. Med. Chem. 1978, 21, 658–668. 10.1021/jm00205a013. [DOI] [PubMed] [Google Scholar]
- Gershon H.; Ghirlando R.; Guttman S. B.; Minsky A. Mode of Formation and Structural Features of DNA-cationic Liposome Complexes used for Transfection. Biochemistry 1993, 32, 7143–7151. 10.1021/bi00079a011. [DOI] [PubMed] [Google Scholar]
- Zadmard R.; Schrader T.. DNA Recognition with Large Calixarene Dimers. Angew. Chem. 2006, 118, 2769–2772. 10.1002/ange.200502946; Angew. Chem., Int. Ed. 2006, 45, 2703–2706. [DOI] [PubMed] [Google Scholar]
- Izumrudov V. A.; Zhiryakova M. V.; Goulko A. A. Ethidium Bromide as a Promising Probe for Studying DNA Interaction with Cationic Amphiphiles and Stability of the Resulting Complexes. Langmuir 2002, 18, 10348–10356. 10.1021/la020592u. [DOI] [Google Scholar]
- Vogel K.; Wang S.; Lee R. J.; Chmielewski J.; Low P. S. Peptide Mediated Release of Folate-Targeted Liposome Contents from Endosomal Compartments. J. Am. Chem. Soc. 1996, 118, 1581–1586. 10.1021/ja952725m. [DOI] [Google Scholar]
- Xu Y.; Szoka F. C. Mechanism of DNA Release from Cationic Liposome/DNA Complexes used in Cell Transfection. Biochemistry 1996, 35, 5616–5623. 10.1021/bi9602019. [DOI] [PubMed] [Google Scholar]
- Wolfert M. A.; Dash P. R.; Nazarova O.; Oupicky D.; Seymour L. W.; Smart S.; Strohalm J.; Ulbrich K. Polyelectrolyte Vectors for Gene Delivery: Influence of Cationic Polymer on Biophysical Properties of Complexes formed with DNA. Bioconjugate Chem. 1999, 10, 993–1004. 10.1021/bc990025r. [DOI] [PubMed] [Google Scholar]
Associated Data
This section collects any data citations, data availability statements, or supplementary materials included in this article.


