Abstract
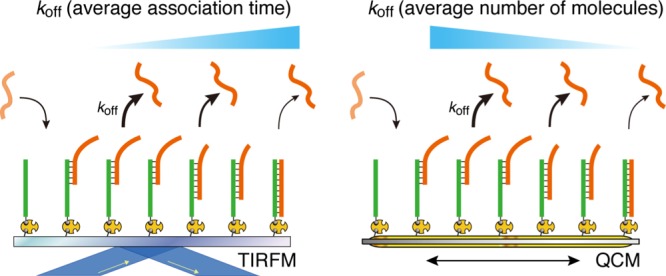
Interactions between biomolecules are generally analyzed by ensemble measurements, assuming that the interactions occur in a single binding manner. However, such interactions may occur via multiple binding modes. We investigated the kinetics of DNA hybridization as a multiple dynamic model of biomolecular interactions. Two kinetic analyses were performed with a single-molecule observation using total internal reflection fluorescence microscopy (TIRFM) and with ensemble measurements using a quartz-crystal microbalance (QCM) biosensor. We observed the DNA hybridization of 8 and 12 bp DNAs with random sequences and dA12–dT12 and calculated the kinetic parameters, including the dissociation rate constant (koff). Hybridization of 8 bp DNA proceeded mainly via a single binding mode. However, hybridization of 12 bp DNA indicated at least two different binding modes and dA12–dT12 hybridization showed multiple binding modes. For the multiple binding interactions, the kinetic parameters obtained from TIRFM and QCM were different because kinetic parameters obtained from QCM indicate average number of molecules, whereas those from TIRFM indicate average association time. The present study revealed the details of multiple interactions, which can be utilized for better understanding of not only DNA hybridization but also biomolecular interaction mechanisms.
Introduction
Biomolecular interactions influence biological functions and are more complex than chemical reactions owing to molecular conformational changes and fluctuations among biological macromolecules.1,2 Therefore, investigating kinetic biomolecular interactions is required to understand biological systems in detail. Biosensors, such as a surface plasmon resonance (SPR) biosensor, have been used for quantitative analysis of reaction kinetics as well as binding association.3 A quartz crystal microbalance (QCM) biosensor can also be used for quantitative kinetic analysis. A host molecule-immobilized QCM enables the detection of interactions with guest molecules as a function of time because the resonance frequency decreases linearly with the increase in mass on the sensor surface at the nanogram level.4,5 Kinetic analysis yields the association and dissociation rate constants and dissociation constants (kon, koff, and Kd, respectively). We have previously used a 27 MHz QCM device to study the kinetics of DNA–DNA,6 DNA–protein,7 DNA–intercalator,8 and other biomolecules.9−11 However, biosensors including SPR and QCM detect the total amount of substance on the sensing area, resulting in an ensemble measurement of the binding/dissociation behaviors. Hence, it is difficult to assess the behavior of each biomolecule during interactions via multiple binding modes, resulting from conformational fluctuations, using an ensemble measurement.
Experimental methods designed for single-molecule detection can be utilized to identify the binding mode of each molecule. Atomic force microscopy and optical tweezers are emerging as powerful tools to detect a single-molecule event.12 Furthermore, single-molecule detection targeting DNA molecules, whose physical properties are well defined among biomolecules, has been reported as follows. Protein nanopores such as α-hemolysin13,14 and porin A15 have gained attention as a single-molecule analytical tool for DNA detection and sequencing. Previously, an array of femtoliter-sized reaction vessels was utilized to detect the single-molecule DNA hybridization by enzymatic signal amplification.16 In addition, localized SPR17 and micromechanical technique18 were used for in situ sensing of single binding events of nanoparticle-labeled DNA strands. Carbon nanotube field-effect transistor provided information about the single-molecule binding and dissociation of DNA hybridization in terms of activation energy.19
Total internal reflection fluorescence microscopy (TIRFM) was developed to observe a single-molecule behavior using a fluorescence labeling technique.20 In TIRFM, the guest molecules labeled with a fluorescent dye can be detected in the range of an evanescent field on a glass plate immobilized with the host molecules. A bright spot derived from the single-molecule interaction is detected by using a high-sensitivity charge-coupled device (CCD) camera, with a time resolution of several tens of frames per second. Single-molecule DNA hybridization was detected by TIRFM using molecular beacon DNA probe,21 a dual-color system,22 liposome-mediated delivery of DNA-modifying fluorescent molecules,23,24 and a competitive assay with fluorescence-labeled and label-free DNA.25 Although such single-molecule detections of biomolecular interactions provide a deeper understanding of the behavior of biomolecules, the difference in kinetics of the biomolecular interactions via a multiple dynamic binding mode at a single-molecule level remains unclear.
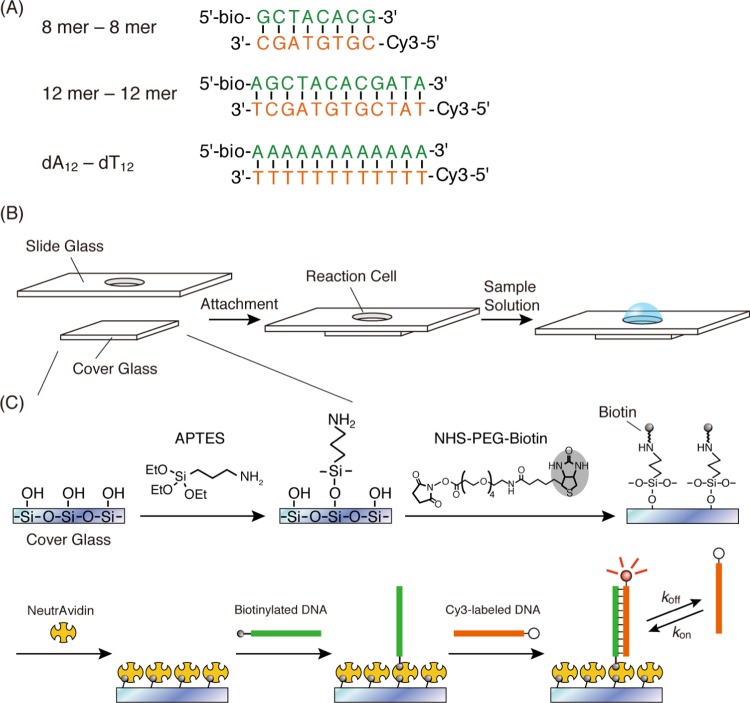
In this study, we focused on the kinetic analysis of biomolecular interactions with multiple binding modes at a single-molecule level. In previous studies, kinetics of biomolecular interactions with ensemble measurements have been generally analyzed with the assumption that the biomolecular interactions occur in a single binding manner, which results in the average rate constants of the multiple binding behaviors. Therefore, we obtained a single-molecule observation, using TIRFM; thereafter, we compared the resulting kinetic parameters with those obtained with an ensemble measurement, using QCM to consider the meaning of averaging. We demonstrate the kinetic analysis of multiple dynamic binding modes of DNA hybridization, as a multiple binding model of biomolecular interactions. DNAs with multiple binding behavior in DNA hybridization can be designed because that depends on the length and sequence of DNA.26 We used the DNA modified with the small fluorescent probe Cy3, which causes comparatively less steric hindrance, at 5′-end of the DNA strands (Figure 1A). We monitored the DNA hybridization and dissociation as appearance/disappearance time of bright spots in real-time by TIRFM and conducted the statistical analysis to obtain the kinetic parameters (Figures 1B,C, and 2). The resultant kinetic parameters were compared with those obtained from the QCM measurement. The details of multiple interactions could be utilized for better understanding of different biological functions in the living cell.
Figure 1.
Schematic illustration of (A) DNA sequences and modifications (bio-: biotinylated and -Cy3: Cy3-labeled) used in this study, (B) a reaction cell made by attaching a cover glass on a slide glass with a hole, which can contain a sample solution (70 μL), and (C) immobilization of a biotinylated probe DNA on a cover glass and kinetic parameters (kon and koff) of the hybridization with Cy3-labeled target DNAs.
Figure 2.
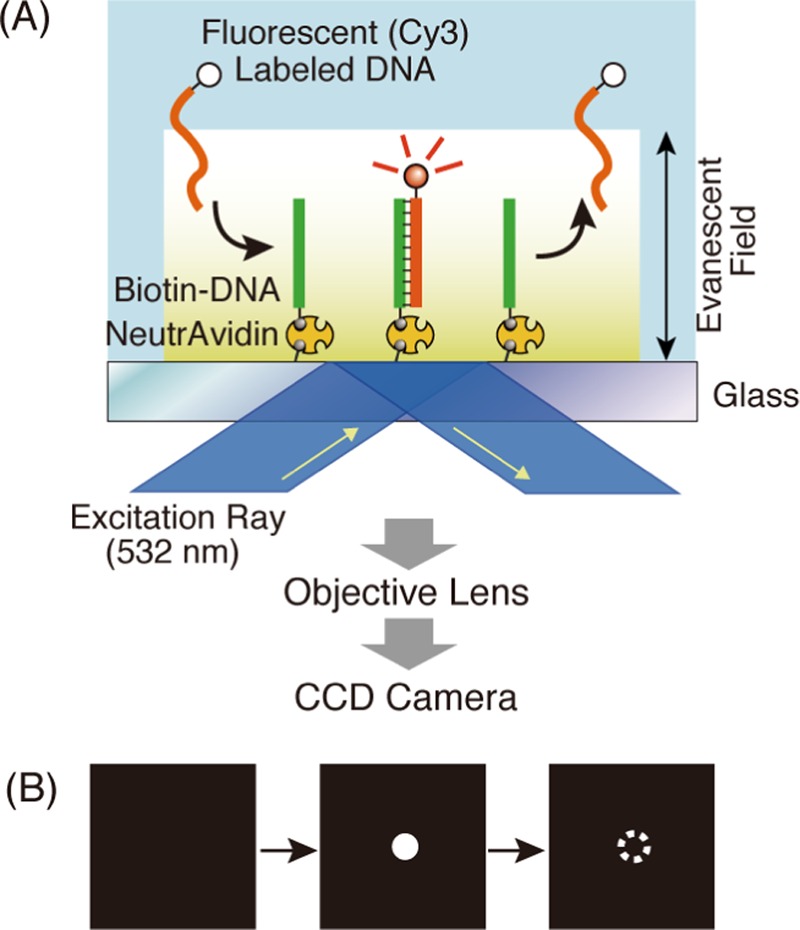
Schematic illustration of the procedure for single-molecule detection of DNA hybridization. (A) Evanescent field generated on the glass surface by the excitation ray (532 nm) contributes to a single-molecule detection during hybridization between Cy3-labeled DNA and biotinylated DNA immobilized on the glass plate. Fluorescence is transmitted through the objective lens, which is detected by the CCD camera. (B) A hybridization event is indicated by a bright spot on the CCD camera images.
Results and Discussion
Experimental System for Monitoring DNA Hybridization by TIRFM
We first examined DNA immobilization on a glass plate in TIRFM experiments. DNA sequences used in this study are represented in Figure 1A. A reaction cell for DNA hybridization was made by attaching a cover glass on a slide glass with a hole, which can contain a sample solution (70 μL) as shown in Figure 1B. The amount of probe DNA immobilized on the glass plate of TIRFM needs to be controlled at low density for the detection of DNA hybridization at a single-molecule level. To obtain one bright spot corresponding to one fluorescent-labeled DNA molecule by the CCD camera (resolution: 160 nm × 160 nm/pixel), 70 μL of the 10 pM probe-DNA solution containing 4.2 × 10⁸ DNA molecules was used to construct the DNA-displayed glass plate (area: 1.13 cm2). In case of maximum immobilization, the distance between the probe DNAs was calculated to be 554 nm (occupied area: 2.7 × 10⁵ nm2/probe-DNA molecule). The immobilization amount is low enough for one probe DNA to be located per ∼10 pixels of the CCD camera to obtain one fluorescent-labeled DNA per pixel.
Single-Molecule Observation of DNA Hybridization
We observed the DNA hybridization of Cy3-labeled DNAs with probe DNA on the glass plate of the reaction cell by TIRFM (Figure 1C). When the reaction cell with the probe DNA (8 mer) was filled with 70 μL of 1 nM Cy3-labeled target-DNAs (8 mer) solution, we found many countable bright spots in the CCD-camera image (Figure S1A). However, in the case of no probe-DNA immobilization, very few bright spots were observed from the Cy3-labeled target DNAs displaying nonspecific binding with the plate in the same condition (Figure S1B). These results indicate that (1) the Cy3-labeled DNAs bound to probe DNAs, (2) the Cy3 fluorescent dye emitted fluorescence by evanescent light, and (3) its emission was detected with the CCD camera (Figure 2).
Next, we obtained the CCD-camera images continuously at 30 s intervals, resulting in the movies showing many blinking spots. The intensity of a blinking spot in one area of the images was plotted against time in the case of a single-molecule hybridization of 8 mer–8 mer, 12 mer–12 mer, and dA12–dT12 (Figure 3). They showed short or long pulses. The similar intensity of the short or long pulses in each graph reflected fluorescent emission from one molecule of Cy3-labeled target DNA. Thus, a high-intensity step in contrast to the baseline would indicate DNA hybridization, and the duration of the step shows the association time for binding between the target DNA and the probe DNA. We found that the association time of the hybridization in 8 mer–8 mer was shorter than that in 12 mer–12 mer (Figure 3A,B). In addition, the association time in dA12–dT12 seemed to be a mixture of short and long pulses (Figure 3C). These results suggest that the association time depends on the DNA length and that hybridization in dA12–dT12 could occur between DNA strands with various lengths.
Figure 3.
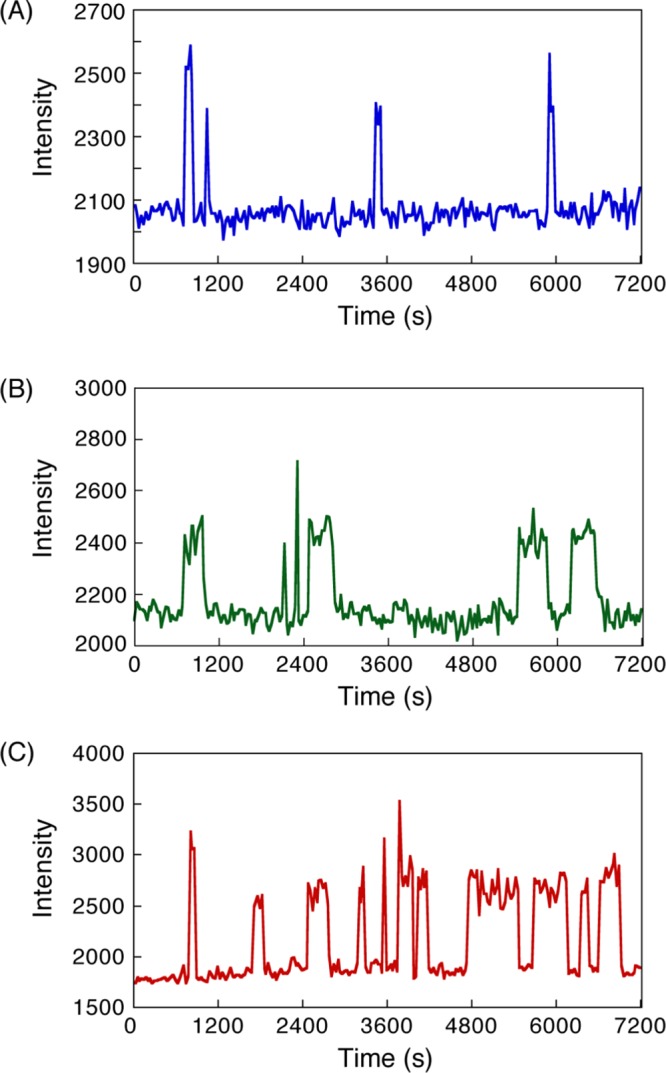
Time courses of fluorescent intensity of bright spots corresponding to the binding and dissociation of single-molecule hybridization in (A) 8 mer–8 mer, (B) 12 mer–12 mer, and (C) dA12–dT12 DNAs. Time-lapse images were obtained at an interval of 30 s. Experimental conditions: 200 mM NaCl Tris-EDTA (TE) buffer (10 mM Tris–HCl, pH 8.0, 1 mM ethylenediaminetetraacetic acid (EDTA), 200 mM NaCl) [Cy3-DNA] = 1 nM at 20 °C.
Histogram Analysis of Time-Lapse Images of TIRFM
We analyzed the movies obtained from the time-lapse images of each single-molecule hybridization to obtain the association time. According to eq 6, we plotted ln(counts/n) against association time (ta) for 8 mer–8 mer, 12 mer–12 mer, and dA12–dT12 (Figure 4A–C). For comparison, each vertical axis was normalized with the maximum value of (counts/n) of 1. We drew a straight line on the plots for 8 mer–8 mer hybridization according to the theoretical formula (eq 6) (Figure 4A). The slope corresponding to an apparent dissociation rate constant (koff′) was 0.013 s–1. In contrast, we could not draw single straight line in the plots for 12 mer–12 mer hybridization because a bimodal distribution was found in the graph (Figure 4B). Therefore, we fitted the plots by two straight lines. The values of the two slopes were 0.014 s–1, which was similar to that of the 8 mer–8 mer hybridization, and a smaller value of 0.0016 s–1; this suggests the existence of different binding modes (fast and slow dissociation modes) in the 12 mer–12 mer hybridization. Moreover, in the case of dA12–dT12, the plots showed a hyperbolic curve, suggesting the existence of multiple binding modes (Figure 4C). To analyze the curve simply, we divided the plots into three areas expediently and fitted with three straight lines with slopes 0.020, 0.0059, and 0.0028 s–1. The same tendency was found when hybridization was observed using different time-lapse intervals in case of 8 mer–8 mer, 12 mer–12 mer, and dA12–dT12 DNA hybridization (Figures S2–S4, respectively).
Figure 4.
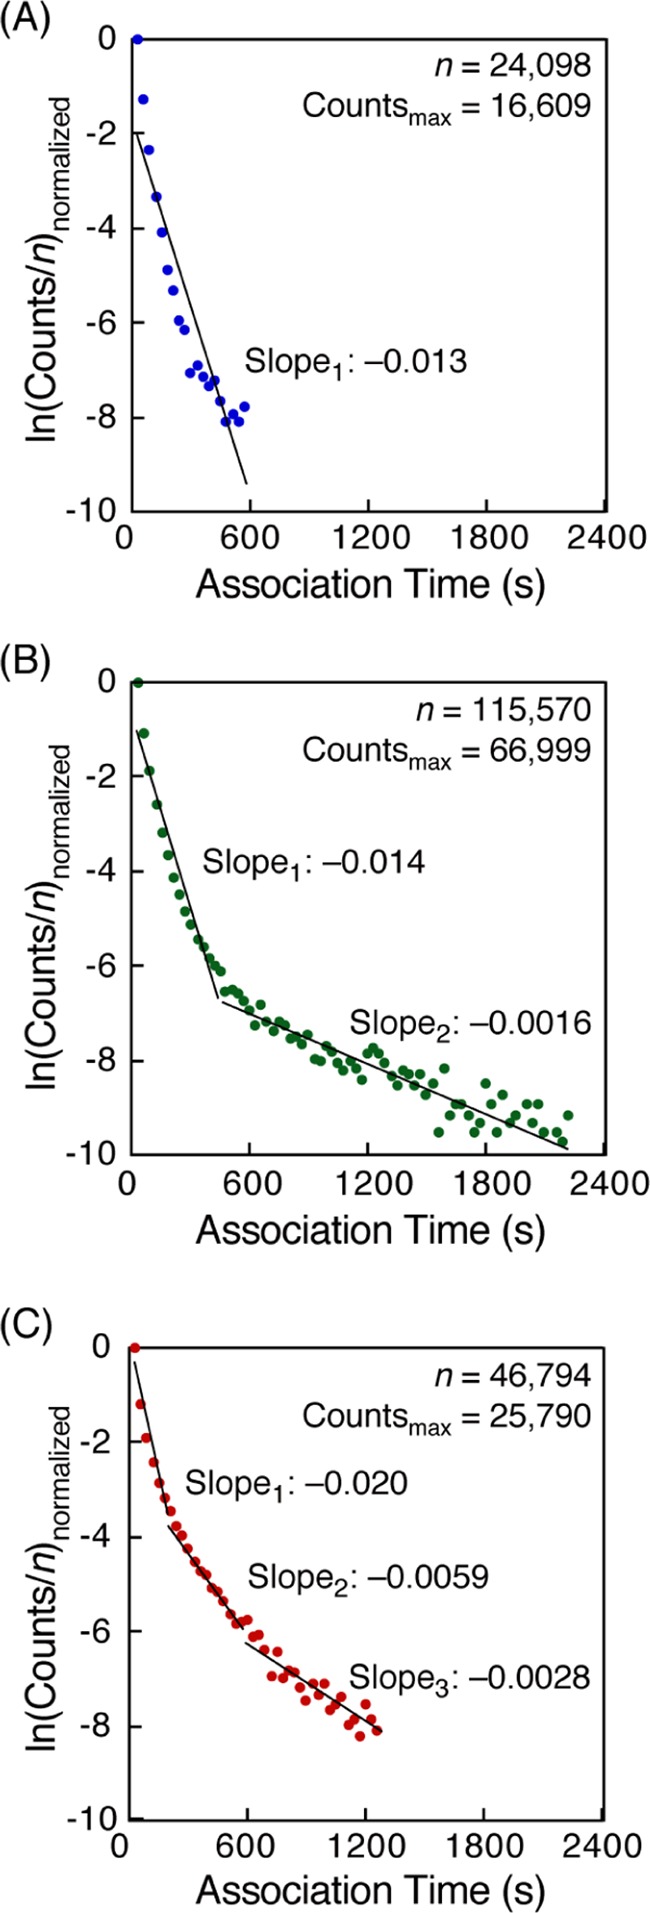
Histogram analyses of association time for single-molecule hybridization of (A) 8 mer–8 mer, (B) 12 mer–12 mer, and (C) dA12–dT12 DNAs. Each vertical axis was normalized with the maximum value of (counts/n) of 1. Slope values were obtained according to eq 6 in Experimental Section. Time-lapse images were obtained at an interval of 30 s. Experimental conditions: 200 mM NaCl TE buffer (10 mM Tris–HCl, pH 8.0, 1 mM EDTA, 200 mM NaCl) [Cy3-DNA] = 1 nM at 20 °C.
Kinetic Analysis for Dissociation Rate Constants of DNA Hybridization
Irradiation with a strong laser for single-molecule detection in TIRFM results in the quenching of the fluorescent probe at a certain frequency.27 Therefore, the disappearance of bright spots in the TIRFM images could be attributed to both dissociation of fluorescence-labeled molecules from probe molecules on the plate and the photobleaching of a fluorescent probe. To obtain the actual dissociation rate constant (koff) from the time-lapse TIRFM movies, we performed the histogram analysis with various time-lapse intervals (τtl) under constant exposure time (τex) for each hybridization (Figures 4, and S2–S4) and plotted the koff′·τtl values against the τtl values, according to eq 7 (Figure 5). Each apparent koff′ for the single binding mode in the 8 mer–8 mer hybridization, two binding modes in the 12 mer–12 mer hybridization, and three binding modes in the dA12–dT12 hybridization was obtained from each histogram and was plotted with each time-lapse interval (Figure 5).
Figure 5.

Time-lapse interval plots to obtain actual koff values for (A) 8 mer–8 mer, (B) 12 mer–12 mer, and (C) dA12–dT12 DNA hybridization according to eq 7 in Experimental Section.
The actual koff values of each case were calculated from the linear plots as a slope of a fitted line (koff for 8 mer–8 mer, kofffast and koffslow for 12 mer–12 mer, kofffast, koffmiddle, and koffslow for dA12–dT12). We also calculated the average of koff values (koffavg) obtained by linear fitting of the entire plots without dividing them into two or three (Table 1). Based on the results of DNA hybridization using 8 and 12 bp DNAs, the koff values decreased with increasing length. This is reasonable because higher number of base pairs contributes to the stability of the hybridization, resulting in a smaller dissociation rate constant. In the case of 12 mer–12 mer hybridization, the two koff values (kofffast and koffslow) should correspond to two binding modes with different base-pair length: partial hybridization (kofffast) and perfect hybridization (koffslow). The kofffast and koffslow values for dA12–dT12 were similar to those for 12 mer–12 mer. The hybridized dA12–dT12 DNAs with the koffmiddle value could exist in 41% of the relative abundance in the total dA12–dT12 hybridization. Thus, these results suggest that the interaction mode in the hybridization of dA12–dT12 may not only be partial and perfect hybridization (kofffast and koffslow, respectively) but may also include other types of bindings such as a zipperlike-mismatch hybridization (koffmiddle) (Figure 6).
Table 1. Dissociation Rate Constants for DNA Hybridization, as Obtained by TIRFMa.
| DNA | kofffast (×10–3 s–1) | koffmiddle (×10–3 s–1) | koffslow (×10–3 s–1) | koffavg (×10–3 s–1) |
|---|---|---|---|---|
| 8 mer–8 mer | 11.1 ± 1.7 (100%) | 11.1 ± 1.7 | ||
| 12 mer–12 mer | 3.7 ± 0.7 (90%) | 1.0 ± 0.3 (10%) | 1.8 ± 0.2 | |
| dA12–dT12 | 4.3 ± 0.5 (52%) | 1.8 ± 0.2 (41%) | 1.1 ± 0.2 (7%) | 2.7 ± 0.7 |
| d(ATG)4–d(CAT)4 | 8.4 ± 1.5 (86%) | 0.8 ± 0.1 (14%) | 1.2 ± 0.1 |
Figure 6.
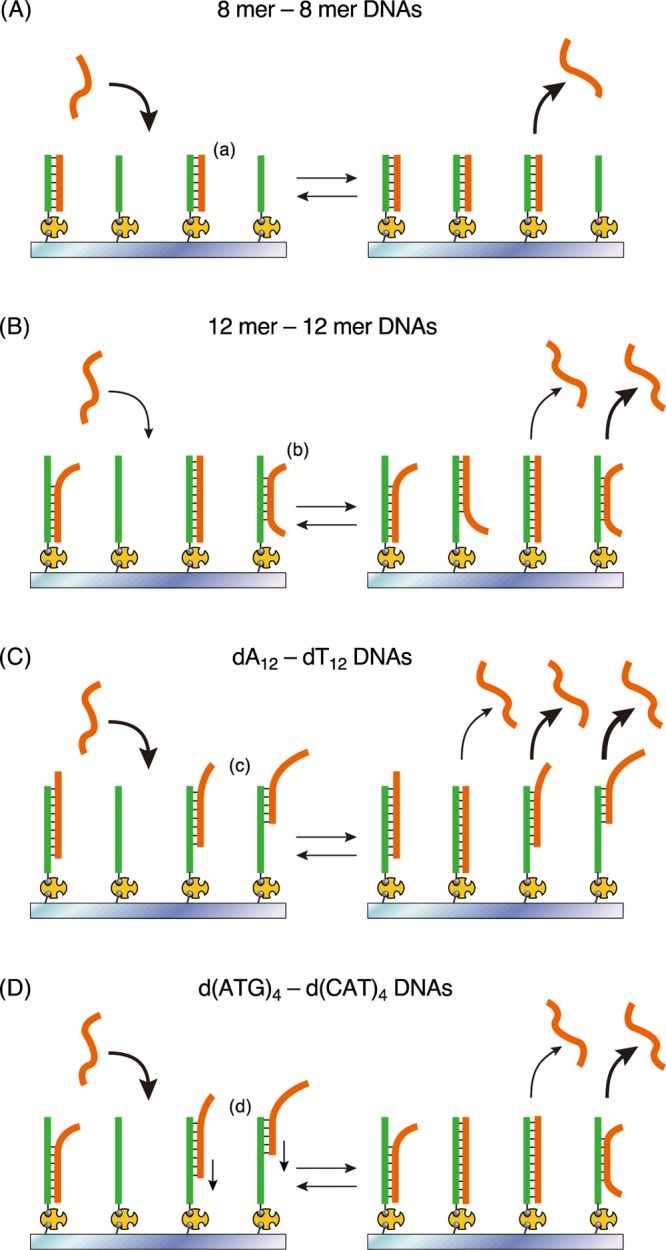
Schematic illustrations of multiple binding behaviors of DNA hybridization of (A) 8 mer–8 mer, (B) 12 mer–12 mer, (C) dA12–dT12, and (D) d(ATG)4–d(CAT)4 DNAs. (a) Perfect hybridization, (b) partial hybridization, (c) zipperlike-mismatch hybridization, and (d) dangling and then sliding block-like hybridization.
QCM Measurements of DNA Hybridization for Comparison with Those from TIRFM
A QCM biosensor allows an ensemble measurement of the binding and dissociation behaviors by detecting the total amount of substance on the sensing area. We performed a kinetic measurement for the DNA hybridization using a QCM technique with the condition same as that used in the TIRFM experiments. The time-course curves of the QCM frequency changes were based on the length of DNA and its sequence during hybridization (Figure S5A,C,E). We calculated the kinetic parameters kon, koff, and Kd from these results according to eqs 10–12 (Figure S5B,D, and F, Table 2). The koff values of the 8 and 12 bp DNA hybridization from QCM are similar to those from TIRFM. However, the koff value for dA12–dT12 from QCM is larger than that from TIRFM. We found that the kon and koff values of dA12–dT12 hybridization were close to those of the 8 bp but not to 12 bp DNA hybridization. This suggests that the binding of dA12–dT12 occurs mainly via zipperlike hybridization, detected by the QCM device as a large mass volume. In contrast, the histogram of association time in the TIRFM experiments should be fitted with a straight line on the plots showing a longer association time (Figure 4). Thus, the kinetic parameters obtained from an ensemble measurement, such as that using QCM, provide the average number of molecules and those from single-molecule observation, such as those via TIRFM, provide the average association time. Therefore, the difference between the kinetic parameters obtained by QCM and TIRFM could become more remarkable in case of interactions involving various binding modes. We are interested in investigating whether the multiple binding process occurring during cellular signal transduction depends on the average number of molecules or on the average association time.
Table 2. Kinetic Parameters of DNA Hybridization, as Obtained by the QCM Methoda.
| DNA | kon (×103 M–1 s–1) | koff (×10–3 s–1) | Kd (nM) |
|---|---|---|---|
| 8 mer–8 mer | 230 ± 10 | 29 ± 9 | 126 ± 38 |
| 12 mer–12 mer | 80 ± 10 | 0.7 ± 0.4 | 9 ± 5 |
| dA12–dT12 | 410 ± 20 | 52 ± 15 | 127 ± 37 |
| d(ATG)4–d(CAT)4 | 310 ± 7 | 2.9 ± 2.2 | 9 ± 7 |
Each kinetic parameter was obtained from eqs 10–12 in Experimental Section and is reported with experimental errors. Experimental conditions: 10 mM Tris–HCl, pH 8.0, 1 mM EDTA, 200 mM NaCl, 20 °C.
Finally, we discussed the possibility of DNA sliding via a zipperlike-mismatch hybridization followed by perfect hybridization, which showed stability. The kon value of the 12 mer DNA was smaller than that of the 8 mer DNA because of the low probability of collision required for perfect hybridization. In contrast, in dA12–dT12 hybridization, most of the target DNAs acted as 8 bp DNAs corresponding to a zipperlike-mismatch hybridization in the ensemble measurement of binding and dissociation behaviors (Table 2), and a few of the target DNAs acted as 12 bp corresponding to perfect hybridization with koffslow (Table 1). We observed the DNA hybridization using d(ATG)4 and d(CAT)4. We expected the block-like hybridization to shift by 3 bases (Figure S5G,H). The kon value in d(ATG)4–d(CAT)4 was close to that of 8 mer–8 mer (Table 2). Moreover, the koff value was similar to that of 12 mer–12 mer. Collectively, these results suggest that target-d(CAT)4 binds with 6 or 9 bp region via an interaction corresponding to the block-like mismatch hybridization (easy binding) and then proceeds to full-match hybridization with the same Kd value as that of 12 bp DNA (stable binding). In the TIRFM observations (Figures S6 and S7), bimodal linear-fitting for the plots in the histogram was obtained for d(ATG)4–d(CAT)4 DNAs, indicating two dissociation modes (partial and perfect hybridization) kinetically (Table 1). Thus, the dA12–dT12 hybridization indicates various binding/dissociation modes due to the zipperlike hybridization with a slight sliding. However, the d(ATG)4–d(CAT)4 hybridization showed initial dangling behavior followed by sliding and stable (partial and perfect) hybridization (Figure 6).
Conclusions
We observed hybridization of DNA with various lengths and sequences by two different methods: single-molecule observation using TIRFM and ensemble measurement using QCM. The resultant kinetic parameters obtained through TIRFM were compared with those obtained from QCM measurement. Because the hybridization of 8 mer–8 mer DNA consisted of a single binding mode, the hybridization of 12 mer–12 mer DNA showed both fast and slow dissociation rate constants. In addition, the hybridization of dA12–dT12 DNA showed multiple binding modes. In the case of multiple binding interactions, kinetic parameters obtained from QCM and TIRFM were different because the kinetic parameters obtained from QCM and TIRFM indicate the average number of molecules and average association time, respectively. Single-molecule detection in addition to ensemble measurements of biomolecular interactions presents more detailed information of the binding modes, which are essential to understand biomolecules more precisely. We are interested in assessing whether the biological function depends on the average number of molecules or the average association time. It would be necessary to clarify the correlation between single-molecule kinetics and biological functions in situ.
Experimental Section
Materials
NeutrAvidin and EZ-Link NHS-PEG4-biotin were purchased from Thermo Fisher Scientific (Waltham, MA). Biotinylated DNA and fluorescent-tagged oligonucleotides were purchased from Eurofin Genomics (Tokyo, Japan). Manicure was purchased from Shiseido (Tokyo, Japan). 3-Aminopropyltriethoxysilane (APTES) was purchased from Sigma Aldrich (St. Louis, MO). Boric acid was purchased from Nacalai Tesque (Kyoto, Japan). 4-(2-Hydroxyethyl)-1-piperazineethanesulfonic acid (HEPES) and ethylenediaminetetraacetic acid (EDTA) were purchased from Dojindo (Kumamoto, Japan). A cover glass (18 mm × 18 mm, no. 1S, 0.175 ± 0.015 mm thickness) and a slide glass (76 mm × 26 mm, S-0314 Neo no. 2, 1.0–1.2 mm thickness) were purchased from Matsunami Glass Industries (Osaka, Japan). 1-Ethyl-3-[3-dimethylaminopropyl]carbodiimide (EDC) was purchased from Tokyo Chemical Industry (Tokyo, Japan). N-Hydroxysuccinimide (NHS) was purchased from Wako Pure Chemical Industries (Osaka, Japan). All of the other reagents were purchased from Wako Pure Chemical Industries, Ltd. (Osaka, Japan), unless otherwise specified, and used without further purification. Type 1 ultrapure water (Milli-Q) was used in all of the experiments.
Cover Glass Modified with an Amino Group
To clean up a cover glass, it was sonicated in methanol for 20 min and rinsed in Milli-Q water. Then, the cover glass was immersed in 100 mM KOH, followed by sonication for 20 min. The stain-free cover glass was stored in Milli-Q water until further use. Next, the cover glass was immersed in 106 mL of mixture comprising 100 mL methanol, 5 mL acetic acid, and 1 mL APTES to modify the surface with an amino group (Figure 1B,C).
Reaction Cell Assembled with Cover Glass and Slide Glass
A slide glass with a hole (diameter: 12 mm) in the center was cleaned up by sonication in detergent solutions, acetone, and 100 mM KOH aqueous solutions for 20 min each, and the slide glass was stored in Milli-Q water until further use. In a clean booth, the slide glass was attached with the amino-group-modified cover glass by using manicure as the adhesive at the bottom around the hole to form a reaction cell (Figure 1B). The reaction cell was air-dried in a clean booth.
Immobilization of Biotinylated Probe DNA
The reaction cell equipped with the amino-group-modified cover glass at the bottom was filled with 70 μL NHS-PEG4-biotin solution (1 mg mL–1) buffered with 10 mM borate NaOH (pH 8.5) for 2 h to biotinylate the amino groups on the glass surface (Figure 1C). After rinsing out with the HEPES buffer (10 mM HEPES–NaOH, pH 7.5, 100 mM NaCl), the reaction cell was filled with 70 μL HEPES buffer, followed by the addition of 1 μL of 10 mg mL–1 NeutrAvidin solution and incubation at room temperature (20–25 °C) for 1 h to immobilize NeutrAvidin on the glass surface via avidin–biotin interaction. Then, the reaction cell was rinsed with 200 mM NaCl TE buffer (10 mM Tris–HCl, pH 8.0, 1 mM EDTA, 200 mM NaCl) and the reaction cell was filled with 70 μL of 200 mM NaCl TE buffer containing 10 pM 5′-biotinylated probe DNA to immobilize the biotinylated probe DNA on the surface. After incubation for 1 h, the reaction cell was rinsed with 200 mM NaCl TE buffer and filled with 70 μL of the same buffer. This reaction cell was used for DNA hybridization experiments.
Single-Molecule Observation of DNA Hybridization by TIRFM
A combination of an inverted fluorescence microscope IX71 (Olympus Co., Tokyo, Japan), an objective lens UApo N 100XOTIRF (Olympus Co.), a Samba 532-nm laser unit (Cobolt Inc., Solna, Sweden), an Electron Multiplier-CCD camera ImagEM (HAMAMATSU Photonics K.K., Shizuoka, Japan) was used as a TIRFM system. A biotinylated probe-DNA-immobilized cover glass of the reaction cell was placed in contact with the immersion oil on the objective lens of TIRFM. The cover glass was irradiated by a laser light at 532 nm from the lower side through the objective lens, resulting in the generation of an evanescent field on the upper surface of the glass plate (Figure 2A). When the Cy3-labeled target DNAs were added to the buffer solution in the reaction cell, CCD-camera images were recorded by laser irradiation with 60.53 ms exposure time. Cy3-labeled DNAs hybridized with probe DNAs immobilized on the glass plate appeared as bright spots in the images (Figure 2B). Time-lapse images were recorded at 5, 10, 20, 30, 40, 60, and 70 s. Software MetaMorph was used for analyzing the resultant images.
TIRFM Result-Based Kinetic Analysis of DNA Hybridization
The association time (ta) of Cy3-labeled DNAs with probe DNAs on the substrate was evaluated as continuous bright spots detected on the time-lapse images. ta depends on the binding affinity, and the distribution of the ta can be analyzed statistically.
In general, the dissociation reaction of double-stranded DNA (dsDNA) is expressed as eq 1.
| 1 |
The decrease in dsDNAs per unit time is proportional to the abundance of dsDNAs with the dissociation rate constant (koff) as a proportionality constant, as shown in eq 2.
| 2 |
By dividing both sides of eq 2 by the total amount of the DNA immobilized on the substrate and using the probability PdsDNA (=[dsDNA]/[total amount of the DNA immobilized on the substrate]), eq 3 can be derived as follows.
| 3 |
The probability P can adapt not only to space in total molecules but also to time in a single molecule from ergodicity. Thus, the probability PdsDNA(ta), which implies frequency of a single dsDNA molecule hybridized with association time ta, is described by eqs 4 and 5 obtained by integrating eq 3
| 4 |
| 5 |
where A is an integration coefficient.
In single-molecule TIRFM experiments, PdsDNA(ta) can be calculated by dividing [counts] by n, where [counts] is the number of bright spots with association time ta and n is the total number of bright spots counted. Thus, eq 5 can be replaced with eq 6
| 6 |
Therefore, we can obtain the koff′ values from the slope of linear plots obtained by plotting ln(counts/n) against ta from eq 6.
In single-molecule TIRFM observation, quenching of bright spots occurs not only because of dissociation of fluorescence-labeled molecules from an evanescent field but also because of the fluorescence bleaching with laser light.27 Because the effect of bleaching depends on laser exposure time (τex) and a time-lapse interval (τtl) related to the irradiation frequency, the actual dissociation rate constant (koff) is related to the apparent koff′ obtained from eq 6 by following eq 7(25)
| 7 |
where kb is the photobleaching rate constant. We calculated the actual koff values using eq 7.
27 MHz QCM Measurements of DNA Hybridization for Comparison of Kinetic Parameters
A 27 MHz QCM experiment was performed to obtain the conventional kinetic parameters of DNA hybridization for comparison with the kinetic parameters obtained from the single-molecule observation in TIRFM. An AFFINIX Q4 system (Initium Co. Ltd., Tokyo, Japan) was used in this study. A sensor cell designed for the AFFINIX Q4 system has a volume of 500 μL and is equipped with a quartz plate (60 μm thick and 8.7 mm in diameter) with a gold electrode of 5.7 mm2 area attached at the bottom of the cell. The QCM measurements were performed as mentioned previously.3,8 Briefly, 3,3′-dithiodipropionic acid was immobilized on a cleaned gold electrode, and carboxylic acids were activated as N-hydroxysuccinimidyl esters on the surface using EDC and NHS. NeutrAvidin was reacted with the activated esters on the QCM plate in the HEPES buffer. The biotinylated DNA was immobilized on the NeutrAvidin-immobilized QCM in the 200 mM NaCl TE buffer and frequency changes (ΔFwater) were monitored over time. When the ΔFwater value corresponding to an amount of biotinylated DNA reached 100 Hz (a predetermined value), 10 μM free biotin was added to regulate the immobilization amount. After rinsing the biotinylated DNA-immobilized QCM cell with 200 mM NaCl TE buffer, frequency changes in QCM in response to the addition of complementary DNA strands were measured over time.
Binding kinetics were analyzed using the time courses of frequency decreases (mass increases), as described previously.3,8 Briefly, the binding mode of the hybridization is given by eq 8.
| 8 |
The amount of dsDNAs formed at time t after the injection is described by eqs 9–12.
| 9 |
| 10 |
| 11 |
| 12 |
The binding relaxation time (τ) can be calculated from the time course of Δm in each concentration by a curve-fitting method based on eq 10. The kon and koff can be obtained from the slope and intercept of the linear correlation of the reciprocal plot of binding relaxation time (1/τ) against each concentration, using eq 11 (Figure S5). Kd values were calculated from the obtained kon and koff values, using eq 12.
Acknowledgments
The authors wish to acknowledge Prof. Yoshio Okahata of Tokyo Institute of Technology for helpful discussions regarding the results of this study. This work was financially supported by JSPS Grants-in-Aid for Scientific Research Grant No. 22225005.
Supporting Information Available
The Supporting Information is available free of charge on the ACS Publications website at DOI: 10.1021/acsomega.8b00135.
CCD-camera images for DNA hybridization of Cy3-labeled DNAs. Histogram analyses of association time for 8 mer–8 mer, 12 mer–12 mer, dA12–dT12, and d(ATG)4–d(CAT)4 DNAs; typical time courses of frequency of a QCM plate and kinetic analysis of DNA hybridization; TIRFM observation for the d(ATG)4–d(CAT)4 hybridization (PDF)
Author Present Address
§ Enzyme Research Team, RIKEN Center for Sustainable Resource Science, 2-1 Hirosawa, Wako-shi, Saitama 351-0198, Japan (K.Y.).
The authors declare no competing financial interest.
Supplementary Material
References
- Goh C.-S.; Milburn D.; Gerstein M. Conformational changes associated with protein-protein interactions. Curr. Opin. Struct. Biol. 2004, 14, 104–109. 10.1016/j.sbi.2004.01.005. [DOI] [PubMed] [Google Scholar]
- Freire E. The propagation of binding interactions to remote sites in proteins: Analysis of the binding of the monoclonal antibody D1.3 to lysozyme. Proc. Natl. Acad. Sci. U.S.A. 1999, 96, 10118–10122. 10.1073/pnas.96.18.10118. [DOI] [PMC free article] [PubMed] [Google Scholar]
- Homola J.; Yee S. S.; Gauglitz G. Surface plasmon resonance sensors: review. Sens. Actuators, B 1999, 54, 3–15. 10.1016/S0925-4005(98)00321-9. [DOI] [Google Scholar]
- Becker B.; Cooper M. A. A survey of the 2006–2009 quartz crystal microbalance biosensor literature. J. Mol. Recognit. 2011, 24, 754–787. 10.1002/jmr.1117. [DOI] [PubMed] [Google Scholar]
- Ferreira G. N. M.; da-Silva A.-C.; Tomé B. Acoustic wave biosensors: physical models and biological applications of quartz crystal microbalance. Trends Biotechnol. 2009, 27, 689–697. 10.1016/j.tibtech.2009.09.003. [DOI] [PubMed] [Google Scholar]
- Okahata Y.; Kawase M.; Niikura K.; Ohtake F.; Furusawa H.; Ebara Y. Kinetic measurements of DNA hybridization on an oligonucleotide-immobilized 27-MHz quartz crystal microbalance. Anal. Chem. 1998, 70, 1288–1296. 10.1021/ac970584w. [DOI] [PubMed] [Google Scholar]
- Furusawa H.; Kitamura Y.; Hagiwara N.; Tsurimoto T.; Okahata Y. Binding kinetics of the toroid-shaped PCNA to DNA strands on a 27 MHz quartz crystal microbalance. ChemPhysChem 2002, 446–448. . [DOI] [PubMed] [Google Scholar]
- Furusawa H.; Nakayama H.; Funasaki M.; Okahata Y. Kinetic characterization of small DNA-binding molecules interacting with a DNA strand on a quartz crystal microbalance. Anal. Biochem. 2016, 492, 34–42. 10.1016/j.ab.2015.09.015. [DOI] [PubMed] [Google Scholar]
- Matsuno H.; Furusawa H.; Okahata Y. Kinetic study of phosphorylation-dependent complex formation between the kinase-inducible domain (KID) of CREB and the KIX domain of CBP on a quartz crystal microbalance. Chem. - Eur. J. 2004, 10, 6172–6178. 10.1002/chem.200400030. [DOI] [PubMed] [Google Scholar]
- Furusawa H.; Takano H.; Okahata Y. Transient kinetic studies of pH-dependent hydrolyses by exo-type carboxypeptidase P on a 27-MHz quartz crystal microbalance. Anal. Chem. 2008, 80, 1005–1011. 10.1021/ac702290z. [DOI] [PubMed] [Google Scholar]
- Yazawa K.; Furusawa H.; Okahata Y. Real-time monitoring of Intermediates reveals the reaction pathway in the thiol-disulfide exchange between disulfide bond formation protein A (DsbA) and B (DsbB) on a membrane-immobilized quartz crystal microbalance (QCM) system. J. Biol. Chem. 2013, 288, 35969–35981. 10.1074/jbc.M113.519876. [DOI] [PMC free article] [PubMed] [Google Scholar]
- Neuman K. C.; Nagy A. Single-molecule force spectroscopy: optical tweezers, magnetic tweezers and atomic force microscopy. Nat. Methods 2008, 5, 491–505. 10.1038/nmeth.1218. [DOI] [PMC free article] [PubMed] [Google Scholar]
- Chu J.; Gonzalez-Lopez M.; Cockroft S. L.; Amorin M.; Ghadiri M. R. Real-time monitoring of DNA polymerase function and stepwise single-nucleotide DNA strand translocation through a protein nanopore. Angew. Chem., Int. Ed. 2010, 49, 10106–10109. 10.1002/anie.201005460. [DOI] [PMC free article] [PubMed] [Google Scholar]
- Gyarfas B.; Abu-Shumays R.; Wang H.; Dunbar W. B. Measuring single-molecule DNA hybridization by active control of DNA in a nanopore. Biophys. J. 2011, 100, 1509–1516. 10.1016/j.bpj.2011.01.029. [DOI] [PMC free article] [PubMed] [Google Scholar]
- Butler T. Z.; Pavlenok M.; Derrington I. M.; Niederweis M.; Gundlach J. H. Single-molecule DNA detection with an engineered MspA protein nanopore. Proc. Natl. Acad. Sci. U.S.A. 2008, 105, 20647–20652. 10.1073/pnas.0807514106. [DOI] [PMC free article] [PubMed] [Google Scholar]
- Li Z.; Hayman R. B.; Walt D. R. Detection of single-molecule DNA hybridization using enzymatic amplification in an array of femtoliter-sized reaction vessels. J. Am. Chem. Soc. 2008, 130, 12622–12623. 10.1021/ja8053018. [DOI] [PubMed] [Google Scholar]
- Sannomiya T.; Hafner C.; Voros J. In situ sensing of single binding events by localized surface plasmon resonance. Nano Lett. 2008, 8, 3450–3455. 10.1021/nl802317d. [DOI] [PubMed] [Google Scholar]
- Singh-Zocchi M.; Dixit S.; Ivanov V.; Zocchi G. Single-molecule detection of DNA hybridization. Proc. Natl. Acad. Sci. U.S.A. 2003, 100, 7605–7610. 10.1073/pnas.1337215100. [DOI] [PMC free article] [PubMed] [Google Scholar]
- Sorgenfrei S.; Chiu C.-Y.; Gonzalez R. L. Jr.; Yu Y.-J.; Kim P.; Nuckolls C.; Shepard K. L. Label-free single-molecule detection of DNA-hybridization kinetics with a carbon nanotube field-effect transistor. Nat. Nanotechnol. 2011, 6, 126–132. 10.1038/nnano.2010.275. [DOI] [PMC free article] [PubMed] [Google Scholar]
- Tokunaga M.; Kitamura K.; Saito K.; Iwane A. H.; Yanagida T. Single molecule imaging of fluorophores and enzymatic reactions achieved by objective-type total internal reflection fluorescence microscopy. Biochem. Biophys. Res. Commun. 1997, 235, 47–53. 10.1006/bbrc.1997.6732. [DOI] [PubMed] [Google Scholar]
- Yao G.; Fang X.; Yokota H.; Yanagida T.; Tan W. Monitoring molecular beacon DNA probe hybridization at the single-molecule level. Chem. - Eur. J. 2003, 9, 5686–5692. 10.1002/chem.200304977. [DOI] [PubMed] [Google Scholar]
- Kang S. H.; Kim Y. J.; Yeung E. S. Detection of single-molecule DNA hybridization by using dual-color total internal reflection fluorescence microscopy. Anal. Bioanal. Chem. 2007, 387, 2663–2671. 10.1007/s00216-007-1134-1. [DOI] [PubMed] [Google Scholar]
- Gunnarsson A.; Jönsson P.; Marie R.; Tegenfeldt J. O.; Höök F. Single-molecule detection and mismatch discrimination of unlabeled DNA targets. Nano Lett. 2008, 8, 183–188. 10.1021/nl072401j. [DOI] [PubMed] [Google Scholar]
- Gunnarsson A.; Jönsson P.; Zhdanov V. P.; Höök F. Kinetic and thermodynamic characterization of single-mismatch discrimination using single-molecule imaging. Nucleic Acids Res. 2009, 37, e99 10.1093/nar/gkp487. [DOI] [PMC free article] [PubMed] [Google Scholar]
- Peterson E. M.; Manhart M. W.; Harris J. M. Competitive assays of label-free DNA hybridization with single-molecule fluorescence imaging detection. Anal. Chem. 2016, 88, 6410–6417. 10.1021/acs.analchem.6b00992. [DOI] [PubMed] [Google Scholar]
- Ouldridge T. E.; Sulc P.; Romano F.; Doye J. P. K.; Louis A. A. DNA hybridization kinetics: zipping, internal displacement and sequence dependence. Nucleic Acids Res. 2013, 41, 8886–8895. 10.1093/nar/gkt687. [DOI] [PMC free article] [PubMed] [Google Scholar]
- Gebhardt J. C. M.; Suter D. M.; Roy R.; Zhao Z. W.; Chapman A. R.; Basu S.; Maniatis T.; Xie S. Single-molecule imaging of transcription factor binding to DNA in live mammalian cells. Nat. Methods 2013, 10, 421–426. 10.1038/nmeth.2411. [DOI] [PMC free article] [PubMed] [Google Scholar]
Associated Data
This section collects any data citations, data availability statements, or supplementary materials included in this article.


