Abstract

The forced-intercalation peptide nucleic acid (FIT-PNA) concept, introduced by Seitz and co-workers, is based on replacing a nucleobase of the PNA sequence with a cyanine dye (such as thiazole orange). The cyanine dye is thus a surrogate base that is forced to intercalate in the duplex (e.g., PNA:DNA). This allows single-mismatch sensitivity as the introduction of a mismatch in the vicinity of the dye increases freedom of motion and leads to a significant depletion of its fluorescence because of the free rotation of the monomethine bond separating the two π-systems of the cyanine dye. Herein, we designed and synthesized six FIT-PNA probes, featuring bisquinoline (BisQ), a red-emitting cyanine dye recently developed in our laboratory for FIT-PNAs. By following PNA–DNA duplex fluorescence, we found new sequence-based factors governing the fluorescence response to the mismatched FIT-PNA:DNA duplex. Fluorogenic properties are correlated with the π-stacking energy of three distinctive base pair steps (BPSs) in the PNA:DNA duplex. The first two are the two BPSs opposite BisQ, whereas the third is the BPS of the mismatch position, which presumably becomes unstacked due to the mismatch. We suggest a predictive model for FIT-PNA single-mismatch detection mechanism, a model that can be used in future research to improve FIT-PNA design.
Introduction
FIT-PNA (forced intercalation peptide nucleic acid) is a PNA (DNA-mimic) molecule that acts as a light-up probe; its fluorescence increases significantly after photoexcitation of FIT-PNA in the duplex form (PNA:DNA and PNA:RNA).1
It is designed by replacing one of the natural bases of PNA (typically a purine) with a fluorescent probe (termed a “surrogate base”). Upon hybridization, a mismatch in the vicinity of the surrogate base is recorded as a decrease in fluorescence (in comparison to a fully matched duplex) due to a less viscous environment surrounding the surrogate base.2 This feature endows FIT-PNAs with single-mismatch sensitivity, allowing the detection of single-nucleotide polymorphism (SNP), even in living cells.3
SNP is a variation of a single nucleotide at a specific position in a genome occurring within more than 1% of the population.4 This position may be in a coding, noncoding, or intergenic region. As research advances, more and more diseases and tendencies are linked to specific detectable SNPs. For example, a higher tendency for opioid addiction,5 rheumatoid arthritis,6 and colorectal cancer7 was found to be correlative with specific SNPs.
Two main forces are at work in the Watson–Crick double-stranded helix model: hydrogen bond base pairing and nucleobase π-stacking.8 Whereas complementary oligonucleotide recognition is ascribed to base pairing, the force enabling the thermal stability of the duplex is considered to be the π-stacking interactions.9
Considering the entropy loss as a result of duplex formation from two highly flexible oligonucleotide single strands, a significant enthalpy gain is needed to achieve successful duplex formation. The enthalpy of the π-stacking interaction of the duplex is the main source of this enthalpy gain,10 which is evident by the fact that duplex thermal stability for a specific sequence can be predicted as Tm (melting temperature) by accounting solely its π-stacking interactions.9 The interaction of each two nucleobases (in a defined 5′ to 3′ direction) is termed the “nearest-neighbor interaction”, or NNI, which has a particular value for ΔH.11
There are 10 possible NNI combinations, all of which were calorimetrically determined (Table 1). These values were found to be applicable to PNA:DNA duplexes as well.12
Table 1. NNI ΔH0 Values (kcal/mol)a (Adapted from Ref (11b)).
| interaction | ΔH0 | interaction | ΔH0 |
|---|---|---|---|
| AA/TT | 9.1 | CT/GA | 7.8 |
| AT/TA | 8.6 | GA/CT | 5.6 |
| TA/AT | 6.0 | CG/GC | 11.9 |
| CA/GT | 5.8 | GC/CG | 11.1 |
| GT/CA | 6.5 | GG/CC | 11.0 |
All values refer to the disruption of the interaction in an existing duplex at 1 M NaCl, 25 °C, and pH 7.
PNA was first introduced by Nielsen et al. in 1991.13 It is a DNA analogue which is hybridized to a complementary oligonucleotide according to Watson–Crick base pairing rules and thus exhibits true base pairing recognition abilities.14
This PNA structure mimics the 6 + 3 structure of DNA, featuring a six-atom backbone and a three-atom distance of nucleobase from the backbone.14 A molecular dynamics illustration of the PNA:DNA duplex exhibits the structural resemblance of the duplexed conformation of the two oligonucleotides.15
The PNA:DNA duplex exhibits a higher thermal stability than the DNA:DNA duplex; this characteristic is ascribed to its uncharged backbone.14 PNA is also characterized by increased mismatch selectivity; the effect of base pair mismatches on thermal stability is greater for the PNA:DNA duplex than for the DNA:DNA duplex.14
A structural mechanism to explain PNA:DNA hybrid favorable mismatch selectivity was shown by Rathinavelan and Yathindra16 by employing molecular dynamics on matched and mismatched DNA:PNA and DNA:DNA duplexes. They found that a mismatch at the PNA:DNA double helix causes a loss of π-stacking interaction situated 5′ to 3′ from the mismatched base on the DNA strand. This loss of π-stacking interaction does not occur at the same sequence DNA:DNA duplex. The loss of π-stacking interaction decreases the stability of the PNA:DNA mismatched duplex and is thus thought to account for the remarkable mismatch recognition of PNA.17
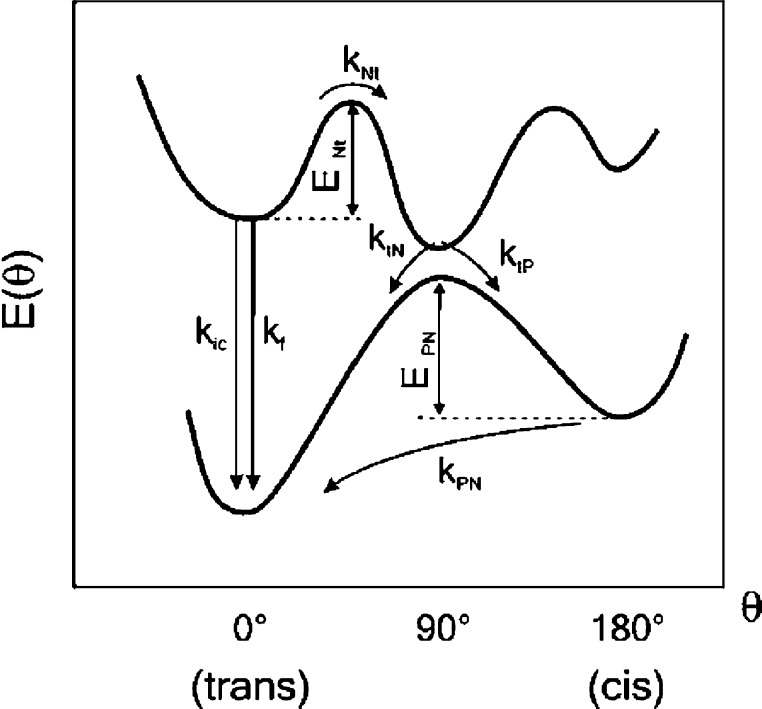
The surrogate base in FIT-PNA is a cyanine dye. The mechanism for cyanine dye viscosity-dependent quantum yield was theoretically described by Momicchioli and Baraldi.18 There are two major competing processes once the cyanine dye is photoexcited (Figure 1). One is denoted by “f”, which is the emissive one, resulting in fluorescence. The latter, defined as Nt [normal (planar) to twisted (perpendicular)], is a rotation at the methine connecting the two aromatic fragments. This process leads to a nonemissive route to the ground state because of the unique charge-transfer properties of the twisted excited state and, in turn, to a decrease in quantum yield.18 Environmental “viscosity” provides an energy barrier for this “normal-to-twisted” rotation (ENt in Figure 1), forcing the cyanine moiety to relax fluorescently. In this regard, intercalation of a cyanine dye into the double-stranded DNA π-stacking provides the viscosity needed for fluorescence enhancement.19
Figure 1.
Potential energy diagram for cyanine dye viscosity-induced fluorescence mechanism. The bottom and top curves represent the energies of the ground and first singlet excited states, respectively, as a function of the methane bridge torsion angle (Θ) (adapted from ref (19a)).
We have designed and synthesized six FIT-PNA probes that target an SNP that is associated with drug resistance in malaria. In 2013, researchers identified a molecular marker associated with the artemisinin-resistant strains of Plasmodium falciparum (which is the deadliest form of malaria): various SNP mutations in a gene encoding for Kelch 13 (K13) propeller domain were shown to be related with delayed parasite clearance in vitro and in vivo.20 We have focused on one of the most abundant SNPs in K13, C580Y, and explored the fluorogenic response of these FIT-PNAs as a function of mismatch type and position. This has led to a better understanding on the thermodynamic parameters that dictate the fluorogenic response and to a predictive model that could be applied to any given FIT-PNA sequence.
Results and Discussion
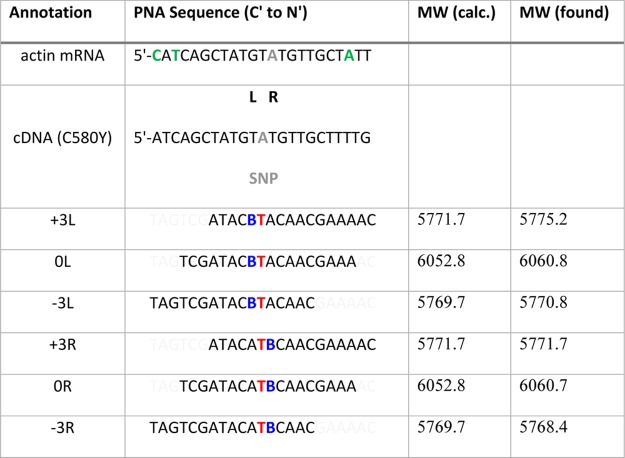
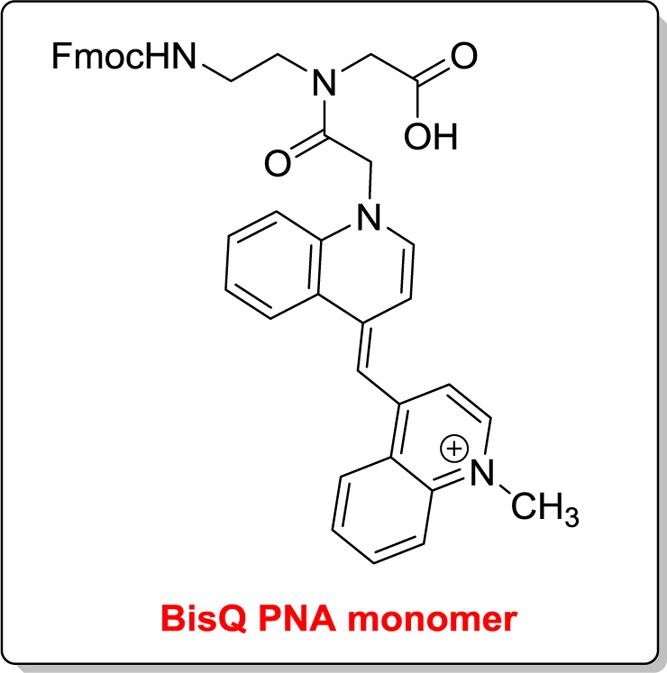
We have designed and synthesized six FIT-PNAs [Supporting Information, Figure S1—high-performance liquid chromatography (HPLC) chromatograms of purified FIT-PNAs] targeting the K13 gene in P. falciparum (Table 2). In these FIT-PNAs, we have added a stretch of eight d-lysines at the FIT-PNA C-terminus. This was done as we have previously shown that this peptide (octa-d-lysine) facilitates PNA uptake into P. falciparum-infected red blood cells in culture.3b Point mutations in this gene are associated with acquired drug resistance of this parasite to the leading antimalarial drug, artemisinin.20 We noticed, however, that in the P. falciparum gene, the P. falciparum actin gene has a sequence very similar to that of K13 with mismatches positioned several bases away from the point mutation (SNP) (Table 2, mismatches highlighted in green). This has prompted us to investigate whether mismatches that are not in the close vicinity of the surrogate base influence the fluorescence of FIT-PNAs. Thus, we have looked at other remote SNPs (other than actin mRNA) to delineate the effect of such remote mismatches on FIT-PNA fluorescence. As shown in Table 2, a red-emitting surrogate base [bisquinoline (BisQ), Scheme 1], recently developed in our laboratory for FIT-PNAs,3b was introduced at a position that is next to the single point mutation in the K13 gene (marked in red, C580Y). When BisQ is placed to the left of the SNP, toward the 5′-end of the DNA, the FIT-PNA is given the “L” annotation. When BisQ is to the right of the SNP, the FIT-PNA is defined as “R”. Shifting the FIT-PNA three bases toward the 3′-end of the DNA is then defined as “+3”, whereas shifting the FIT-PNA toward the 5′-end of the DNA is defined as “–3”.
Table 2. FIT-PNA Sequences and Their Corresponding molecular weights (MWs)a.
All FIT-PNAs include a polylysine peptide (D-K8) at the C-terminus.
 = BisQ,
  = SNP (C580Y), and
  = thymine opposite the SNP;
mismatches in mRNA of actin are marked in green.
Scheme 1. Chemical Structure of BisQ on the PNA Backbone.
Initially, experiments and analyses were conducted to determine fluorogenic discrimination of K13-FIT PNA. FIT-PNAs were annealed to 43-mer single-stranded DNAs with K13-C580 full complementary or single mismatches [G:T, C:T, and T:T mismatches adjacent to BisQ sequences B, C, and D (Supporting Information Table S1) and A:C, T:C, and C:C mismatches adjacent to BisQ sequences H, I, J, Q, R, and S (Supporting Information Table S1)]. Annealed FIT-PNA:C580Y DNA for all PNAs was used as a control (If, where f = fully complementary). Mismatch selectivity was assessed by comparing the normalized relative fluorescence (I/If), as shown in Table 3.
Table 3. Mismatch Discrimination by the L and R FIT-PNA Series.
| mismatch | FIT-PNA |
|||||
|---|---|---|---|---|---|---|
| +3L | 0L | –3L | +3R | 0R | –3R | |
| T:t | 0.98a | 0.90 | 0.81 | 0.62 | 0.70 | 0.75 |
| C:t | 0.53 | 0.52 | 0.54 | 0.61 | 0.52 | 0.55 |
| G:t | 0.72 | 0.75 | 0.73 | 0.41 | 0.33 | 0.40 |
| A:c | 0.56 | 0.63 | 0.68 | 0.53 | 0.48 | 0.40 |
| T:c | 0.86 | 0.74 | 0.80 | 0.48 | 0.45 | 0.56 |
| C:c | 0.65 | 0.75 | 0.97 | 0.48 | 0.49 | 0.45 |
All values are relative to fully matched duplex (I/If). Lower case letters denote PNA nucleobases.
A few interesting observations are notable. The shift of the FIT-PNA to either 3′ or 5′ (±3) typically has a small effect on mismatch discrimination (with the exception of the C:c mismatch for −3L, Table 3). In addition, the T:t and T:c mismatches are poorly discriminated for all L-type FIT-PNA probes. Other than the C:c mismatch (NNI = 5.6, Table S1), other mismatches are better discriminated by the R series. Form these data, it would be advisable to avoid SNP detection by FIT-PNAs in the case of a T:c or T:c mismatch when BisQ is to the left of these mismatches (L series).
The Seitz group1 and others3c suggested a mode of intercalation for FIT-PNAs, where the “base pair” of the surrogate base is “flipped out” to an extra-helical position and the exterior aromatic ring takes its place as stacked between the two adjacent bases. A mismatch adjacent to the surrogate base then loses this intercalation, resulting in a less viscous environment (i.e., increased torsional freedom of the monomethine bond, which results in lower fluorescence). However, this model cannot readily explain the directional bias for mismatch discrimination.
Instead, we suggest here a monomethine-restrictive binding mode which does not involve intercalation of the exterior heteroaromatic ring of the cyanine dye into the base stacking column. In this binding mode, the monomethine torsional rotation is restricted by the DNA base π-stacking interaction. As a result, the rotation will cause steric collision of the heteroaromatic ring, with the bases forcing them to unstack. Therefore, the π-stacking of the DNA bases is the force restricting the monomethine rotation, causing the cyanine dye (BisQ) to fluoresce.
It has been shown that a mismatch in a PNA:DNA duplex causes the unstacking of the base step situated 5′ to 3′ from the DNA mismatched base.16 In the current binding model, an R-positioned mismatch will cause the unstacking of one of the two base steps which create the BisQ external quinoline binding groove—restricting its rotational freedom. In contrast, the L-positioned mismatch will cause an unstacking of the base step further away from the DNA base triad opposite BisQ, resulting in a higher rotational freedom. This model can then explain this directional bias (Scheme 2).
Scheme 2. L and R Mismatch Discrimination.

BisQ is marked in blue B; the mismatch is marked in red. The unstacked base pair steps (BPSs) due to the mismatch are boxed. The DNA base triads opposite to BisQ are underlined. When the mismatch is situated 5′ to BisQ (R), the resulting unstacking occurs within the BisQ opposite to the DNA triad. In contrast, in the L case, the unstacked BPS is outside of the BisQ opposite to the DNA triad.
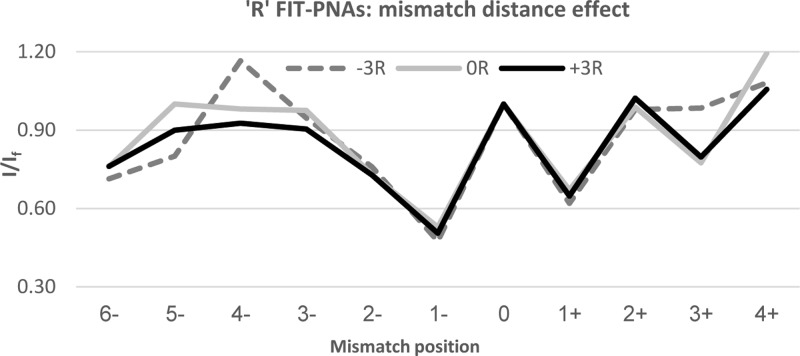
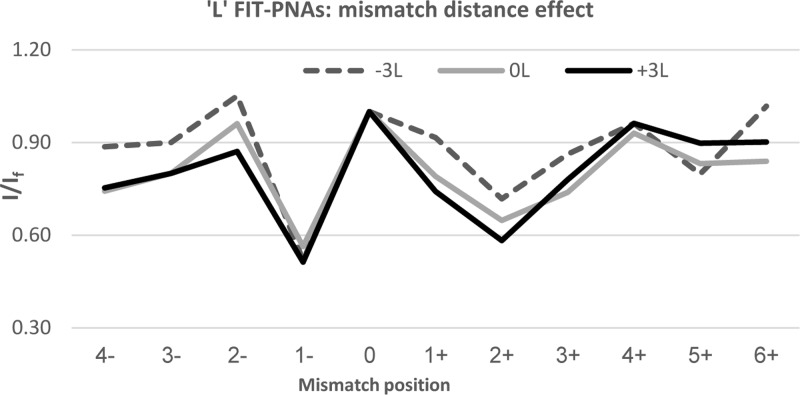
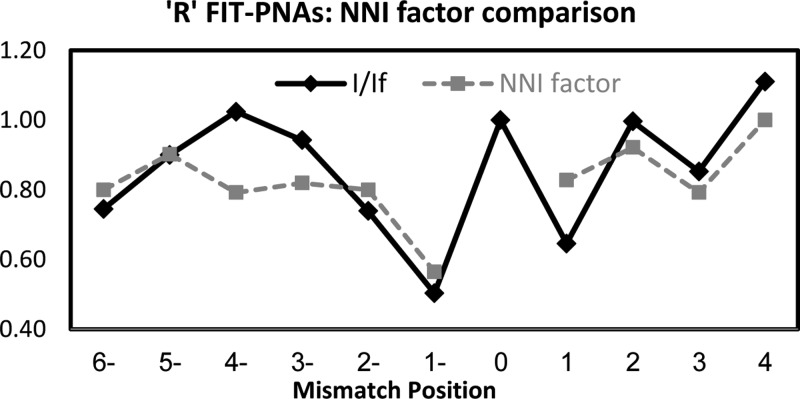
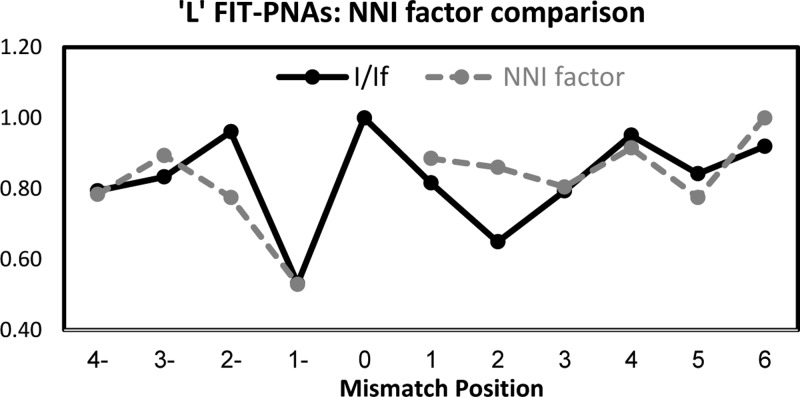
We next explored the effect of shifting the mismatch position from BisQ. It would be anticipated that once the mismatch is shifted away from BisQ, then fluorescence gain would be immediate given the undisturbed local duplex structure surrounding BisQ. To our surprise, we found that this is not the case. Figures 2 and 3 present the relative fluorescence (I/If) for both R and L FIT-PNA series, respectively.
Figure 2.
Effect of shifting the mismatch from the adjacent sites (±1) to BisQ for the R FIT-PNA series. The negative values in the x-axis correlate with shifting the mismatch to the 5′-direction of BisQ, and positive values for a 3′ shift. The specific mismatches are detailed in Supporting Information Table S2.
Figure 3.
Effect of shifting the mismatch from the adjacent sites (±1) to BisQ for the L FIT-PNA series. The negative values in the x-axis correlate with shifting the mismatch to the 5′-direction of BisQ, and positive values for a 3′ shift. The specific mismatches are detailed in Supporting Information Table S2.
In the R FIT-PNA series, the gain in fluorescence is not immediate when moving the mismatch to the 5′-end (the minus direction). In addition, there is a noticeable drop in fluorescence at position +3 for two out of the three FIT-PNAs (0R and +3R). In the L FIT-PNA series, there is a mirror image behavior toward the + direction where the full gain in fluorescence is achieved only at position +4. A small decrease in fluorescence is also noticeable in the minus direction (−3 and −4).
It is clear from this study that there are other factors governing the overall BisQ fluorescence (in the duplex form) that are not solely dependent on the mismatch position at the neighboring base to BisQ. Interestingly, the behavior observed here for FIT-PNAs is slightly different from that reported for FIT-DNA/LNA probes.21 A recent study with an FIT-DNA/LNA probe (QB-FIT)22 has shown a negligible effect of remote base mismatches (in viral RNA) on QB-FIT fluorescence. These differences may be related to the duplex form itself (DNA–RNA vs PNA–RNA) or to the sequence itself.
If indeed the π-stacking interaction of the base triad opposite to BisQ is the force restraining the monomethine torsion, then as the enthalpy of these interactions increases, the energy barrier for monomethine torsion increases, resulting in greater fluorescence quenching.
Hence, the first sequence-based factor tested is the π-stacking interaction enthalpy of the base triad opposite to BisQ. This value is quantified as the sum of the π-stacking NNI of two steps11,12 (ΔH(NNI)) according to the mismatch positions (−1 and +1). Because a mismatch at the −1 position causes one of the two steps opposite to BisQ to unstack (Scheme 2), the NNI enthalpy of this step was calculated as zero for such duplexes.
The next sequence-based factor is ΔH(NNI) of the π-stacking interaction for the base step situated 5′ to 3′ from the mismatch. Because this step becomes unstacked because of the mismatch,16 this ΔH(NNI) is, in fact, the entropy difference between the matched and mismatched duplexes.
Using a stochastic modeling approach, we designed a predictive model that is based on these two contributions: (1) the stacking energy of the nucleobase triad situated opposite to BisQ—calculated as the sum of the NNI enthalpy of two BPSs and, (2) the NNI enthalpy of the BPS which becomes unstacked because of the mismatch, situated 5′ to 3′ from the DNA mismatched base. An example for such a simple calculation is shown in the Supporting Information.
Figures 4 and 5 present the predictive model based on these two contributions for the R and L FIT-PNA series, respectively.
Figure 4.
Correlation of the NNI factor with I/If for the R FIT-PNA series.
Figure 5.
Correlation of the NNI factor with I/If for the L FIT-PNA series.
The resulting prediction (Figures 4 and 5) shows a good correlation with the experimental data for both L and R FIT-PNA series. Clearly, there are other factors that contribute to remote mismatches that could not be solely attributed to ΔH(NNI). Nonetheless, the NNI factor seems to provide a very reasonable fit even to mismatches that are several bases away from BisQ.
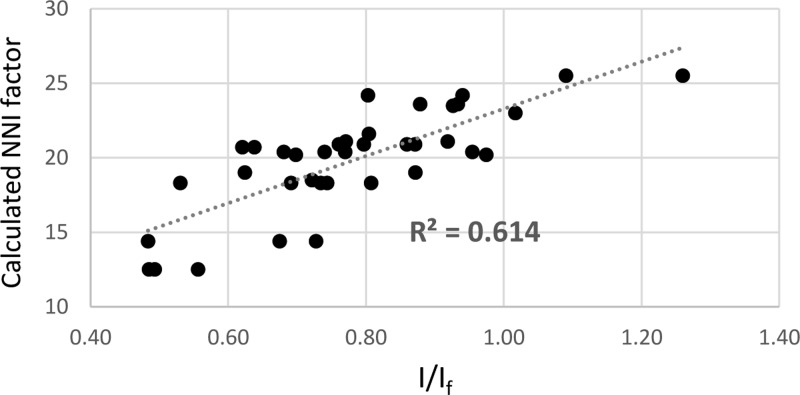
To test more robustly the correlation between I/If and its NNI enthalpy, we measured the fluorescence of 114 different mismatched FIT-PNA·DNAs (each duplex was measured thrice), varying the mismatched position and nucleobase (see the Supporting Information for DNA sequences).
The results are shown as a scatter plot (Figure 6) presenting 37 averaged I/If values (three PNAs with the same DNA measured three times; an average of nine data points for each I/If value on the graph) as a function of the calculated NNI enthalpy change calculated for both L and R series.
Figure 6.
Scatter plot of average measured I/If values as a function of calculated NNI factor. The full data set used to generate this scatter plot is presented in Table S3 (Supporting Information).
We observe a linear correlation of R2 = 0.61. The corresponding Pearson coefficient is 0.78, which, for a sample size of 37, is translated to a P value of 0.00001.
In conclusion, in this study, we have devised a simple thermodynamic-based model that allows predicting the mismatch discrimination of FIT-PNAs. This should allow a simple means to design highly fluorogenic FIT-PNAs with superior mismatch discrimination.
Experimental Methods
Materials
Fmoc-PNA monomers were purchased from PolyOrg, Inc. (USA) and used as received. Fmoc-D-Lys-(Boc)-OH was purchased from GL Biochem (Shanghai) ltd. Solvents and reagents for peptide chemistry were purchased from Bio-lab (Israel). BisQ monomer was synthesized, as reported earlier.3b
Solid-Phase Synthesis of FIT-PNAs
FIT-PNAs were synthesized in the solid phase based on literature procedures with some modifications described as follows: the first amino acid Fmoc-D-Lys-(Boc)-OH was coupled twice to the free hydroxyl groups of NovaSynTGA resin (Merck, Germany) using 10 equiv of the amino acid, 5 equiv of diisopropylcarbodiimide, and 0.1 equiv of 4-dimethylaminopyridine in dry dimethylformamide (DMF). Fmoc deprotection was carried out by shaking resin with a 20% piperidine solution in DMF for 10 min (×2), followed by washing with DMF and dichloromethane. For a 10 μmol scale synthesis on TGA-NovaSyn resin (loading −0.25 mmol/g), 2-(1H-7-azabenzotriazol-1-yl)-1,1,3,3-tetramethyl uronium hexafluorophosphate methanaminium (40 μmol), hydroxybenzotriazole (40 μmol), diisopropylethylamine (80 μmol), and Fmoc-D-Lys-(Boc)-OH or Fmoc-PNA monomers or BisQ monomer (40 μmol) were mixed in dry DMF (0.4 mL) for 5 min and the solution was then added to the amine-functionalized resin and mixed for 60 min. The FIT-PNAs were deprotected and released from the resin by treatment with 90:10 (v/v) trifluoroacetyl (TFA)/m-cresol for 3 h. The PNAs were triturated with cold ethyl ether, and the precipitate was collected. The PNA samples were analyzed and purified on RP-HPLC (Shimadzu LC2010), using a semipreparative C18 reverse-phase column (Phenomenex, Jupiter 300 A) at a flow rate of 4 mL/min. Mobile phase: 0.1% TFA in H2O (A) and acetonitrile (B) (see Supporting Information Figure S1). The authenticity of each FIT-PNA was confirmed by matrix-assisted laser desorption ionization time-of-flight mass spectrometry (Table 1).
FIT-PNA:DNA Annealing and Fluorescence Measurements
Solutions of 1 μM FIT-PNA and 2 μM complementary DNA in phosphate buffered saline were prepared. These solutions were incubated at 90 °C for 3 min and then allowed to gradually cool to room temperature (RT). Duplex solutions were placed in a 96-well plate, and fluorescence was recorded on a Cytation 3 plate reader at RT. This procedure was repeated three times for each duplex (λexc = 550 nm\λem = 580–700 nm).
Acknowledgments
This research was supported by the Israel Science Foundation (grant no. 476/17). E.Y. acknowledges the David R. Bloom Center for Pharmacy for financial support.
Supporting Information Available
The Supporting Information is available free of charge on the ACS Publications website at DOI: 10.1021/acsomega.8b00184.
HPLC chromatograms, DNA sequences, and NNI calculations (PDF)
The authors declare no competing financial interest.
Supplementary Material
References
- Köhler O.; Jarikote D. V.; Seitz O. Forced intercalation probes (FIT Probes): thiazole orange as a fluorescent base in peptide nucleic acids for homogeneous single-nucleotide-polymorphism detection. ChemBioChem 2005, 6, 69–77. 10.1002/cbic.200400260. [DOI] [PubMed] [Google Scholar]
- Socher E.; Jarikote D. V.; Knoll A.; Röglin L.; Burmeister J.; Seitz O. FIT probes: Peptide nucleic acid probes with a fluorescent base surrogate enable real-time DNA quantification and single nucleotide polymorphism discovery. Anal. Biochem. 2008, 375, 318–330. 10.1016/j.ab.2008.01.009. [DOI] [PubMed] [Google Scholar]
- a Kam Y.; Rubinstein A.; Nissan A.; Halle D.; Yavin E. Detection of endogenous K-ras mRNA in living cells at a single base resolution by a PNA molecular beacon. Mol. Pharm. 2012, 9, 685–693. 10.1021/mp200505k. [DOI] [PubMed] [Google Scholar]; b Kolevzon N.; Hashoul D.; Naik S.; Rubinstein A.; Yavin E. Single point mutation detection in living cancer cells by far-red emitting PNA–FIT probes. Chem. Commun. 2016, 52, 2405–2407. 10.1039/c5cc07502e. [DOI] [PubMed] [Google Scholar]; c Sonar M. V.; Wampole M. E.; Jin Y.-Y.; Chen C.-P.; Thakur M. L.; Wickstrom E. Fluorescence detection of KRAS2 mRNA hybridization in lung cancer cells with PNA-peptides containing an internal thiazole orange. Bioconjugate Chem. 2014, 25, 1697–1708. 10.1021/bc500304m. [DOI] [PMC free article] [PubMed] [Google Scholar]
- Vignal A.; Milan D.; SanCristobal M.; Eggen A. A review on SNP and other types of molecular markers and their use in animal genetics. Genet., Sel., Evol. 2002, 34, 275–305. 10.1186/1297-9686-34-3-275. [DOI] [PMC free article] [PubMed] [Google Scholar]
- Bond C.; LaForge K. S.; Tian M.; Melia D.; Zhang S.; Borg L.; Gong J.; Schluger J.; Strong J. A.; Leal S. M.; Tischfield J. A.; Kreek M. J.; Yu L. Single-nucleotide polymorphism in the human mu opioid receptor gene alters beta-endorphin binding and activity: possible implications for opiate addiction. Proc. Natl. Acad. Sci. U.S.A. 1998, 95, 9608–9613. 10.1073/pnas.95.16.9608. [DOI] [PMC free article] [PubMed] [Google Scholar]
- Saad M. N.; Mabrouk M. S.; Eldeib A. M.; Shaker O. G. Identification of rheumatoid arthritis biomarkers based on single nucleotide polymorphisms and haplotype blocks: A systematic review and meta-analysis. J. Adv. Res. 2016, 7, 1–16. 10.1016/j.jare.2015.01.008. [DOI] [PMC free article] [PubMed] [Google Scholar]
- Patidar P.; Bhojwani J. Identification and Pattern Analysis of SNPs Involved in Colorectal Cancer. J. Stem Cell Res. Ther. 2013, 3, 144. 10.4172/2157-7633.1000144. [DOI] [Google Scholar]
- Travers A.; Muskhelishvili G. DNA structure and function. FEBS J. 2015, 282, 2279–2295. 10.1111/febs.13307. [DOI] [PubMed] [Google Scholar]
- Yakovchuk P.; Protozanova E.; Frank-Kamenetskii M. D. Base-stacking and base-pairing contributions into thermal stability of the DNA double helix. Nucleic Acids Res. 2006, 34, 564–574. 10.1093/nar/gkj454. [DOI] [PMC free article] [PubMed] [Google Scholar]
- Borer P. N.; Dengler B.; Tinoco I. Jr.; Uhlenbeck O. C. Stability of ribonucleic acid double-stranded helices. J. Mol. Biol. 1974, 86, 843–853. 10.1016/0022-2836(74)90357-x. [DOI] [PubMed] [Google Scholar]
- a SantaLucia J. A unified view of polymer, dumbbell, and oligonucleotide DNA nearest-neighbor thermodynamics. Proc. Natl. Acad. Sci. U.S.A. 1998, 95, 1460–1465. 10.1073/pnas.95.4.1460. [DOI] [PMC free article] [PubMed] [Google Scholar]; b Breslauer K. J.; Frank R.; Blocker H.; Marky L. A. Predicting DNA duplex stability from the base sequence. Proc. Natl. Acad. Sci. U.S.A. 1986, 83, 3746–3750. 10.1073/pnas.83.11.3746. [DOI] [PMC free article] [PubMed] [Google Scholar]
- Griffin T. J.; Smith L. M. An approach to predicting the stabilities of peptide nucleic acid:DNA duplexes. Anal. Biochem. 1998, 260, 56–63. 10.1006/abio.1998.2686. [DOI] [PubMed] [Google Scholar]
- Nielsen P.; Egholm M.; Berg R.; Buchardt O. Sequence-selective recognition of DNA by strand displacement with a thymine-substituted polyamide. Science 1991, 254, 1497–1500. 10.1126/science.1962210. [DOI] [PubMed] [Google Scholar]
- Egholm M.; Buchardt O.; Christensen L.; Behrens C.; Freier S. M.; Driver D. A.; Berg R. H.; Kim S. K.; Norden B.; Nielsen P. E. PNA hybridizes to complementary oligonucleotides obeying the Watson–Crick hydrogen-bonding rules. Nature 1993, 365, 566–568. 10.1038/365566a0. [DOI] [PubMed] [Google Scholar]
- Autiero I.; Saviano M.; Langella E. Conformational studies of chiral D-Lys-PNA and achiral PNA system in binding with DNA or RNA through a molecular dynamics approach. Eur. J. Med. Chem. 2015, 91, 109–117. 10.1016/j.ejmech.2014.08.015. [DOI] [PubMed] [Google Scholar]
- Rathinavelan T.; Yathindra N. Molecular dynamics structures of peptide nucleic acid x DNA hybrid in the wild-type and mutated alleles of Ki-ras proto-oncogene–stereochemical rationale for the low affinity of PNA in the presence of an AC mismatch. FEBS J. 2005, 272, 4055–4070. 10.1111/j.1742-4658.2005.04817.x. [DOI] [PubMed] [Google Scholar]
- Giesen U.; Kleider W.; Berding C.; Geiger A.; Ørum H.; Nielsen P. E. A formula for thermal stability (T-m) prediction of PNA/DNA duplexes. Nucleic Acids Res. 1998, 26, 5004–5006. 10.1093/nar/26.21.5004. [DOI] [PMC free article] [PubMed] [Google Scholar]
- Momicchioli F.; Baraldi I.; Berthier G. Theoretical study of trans-cis photoisomerism in polymethine cyanines. Chem. Phys. 1998, 123, 103–112. 10.1016/0301-0104(88)87036-8. [DOI] [Google Scholar]
- a Levitus M.; Ranjit S. Cyanine dyes in biophysical research: the photophysics of polymethine fluorescent dyes in biomolecular environments. Q. Rev. Biophys. 2011, 44, 123–151. 10.1017/s0033583510000247. [DOI] [PubMed] [Google Scholar]; b Henary M.; Levitz A. Synthesis and applications of unsymmetrical carbocyanine dyes. Dyes Pigm. 2013, 99, 1107–1116. 10.1016/j.dyepig.2013.08.001. [DOI] [Google Scholar]
- Ariey F.; Witkowski B.; Amaratunga C.; Beghain J.; Langlois A.-C.; Khim N.; Kim S.; Duru V.; Bouchier C.; Ma L.; Lim P.; Leang R.; Duong S.; Sreng S.; Suon S.; Chuor C. M.; Bout D. M.; Ménard S.; Rogers W. O.; Genton B.; Fandeur T.; Miotto O.; Ringwald P.; Le Bras J.; Berry A.; Barale J.-C.; Fairhurst R. M.; Benoit-Vical F.; Mercereau-Puijalon O.; Ménard D. A molecular marker of artemisinin-resistant Plasmodium falciparum malaria. Nature 2014, 505, 50–55. 10.1038/nature12876. [DOI] [PMC free article] [PubMed] [Google Scholar]
- a Hövelmann F.; Gaspar I.; Chamiolo J.; Kasper M.; Steffen J.; Ephrussi A.; Seitz O. LNA-enhanced DNA FIT-probes for multicolour RNA imaging. Chem. Sci. 2016, 7, 128–135. 10.1039/c5sc03053f. [DOI] [PMC free article] [PubMed] [Google Scholar]; b Hövelmann F.; Gaspar I.; Ephrussi A.; Seitz O. Brightness Enhanced DNA FIT-Probes for Wash-Free RNA Imaging in Tissue. J. Am. Chem. Soc. 2013, 135, 19025–19032. 10.1021/ja410674h. [DOI] [PubMed] [Google Scholar]; c Hövelmann F.; Gaspar I.; Loibl S.; Ermilov E. A.; Röder B.; Wengel J.; Ephrussi A.; Seitz O. Brightness through Local Constraint-LNA-Enhanced FIT Hybridization Probes for In Vivo Ribonucleotide Particle Tracking. Angew. Chem., Int. Ed. 2014, 53, 11370–11375. [DOI] [PubMed] [Google Scholar]
- Haralampiev I.; Schade M.; Chamiolo J.; Jolmes F.; Prisner S.; Witkowski P. T.; Behrent M.; Hövelmann F.; Wolff T.; Seitz O.; Herrmann A. A Fluorescent RNA Forced-Intercalation Probe as a Pan-Selective Marker for InfluenzaA Virus Infection. ChemBioChem 2017, 18, 1589–1592. 10.1002/cbic.201700271. [DOI] [PubMed] [Google Scholar]
Associated Data
This section collects any data citations, data availability statements, or supplementary materials included in this article.


