Abstract
Electrostatic interactions play a pivotal role in the structure and mechanism of action of most biomolecules. There are several conceptually different methods to deal with electrostatics in molecular dynamics simulations. Ionic strength effects are usually introduced using such methodologies and can have a significant impact on the quality of the final conformation space obtained. We have previously shown that full system neutralization can lead to wrong lipidic phases in the 25% PA/PC bilayer (J. Chem. Theory Comput. 2014,10, 5483–5492). In this work, we investigate how two limit approaches to the ionic strength treatment (implicitly with GRF or using full system neutralization with either GRF or PME) can influence the conformational space of the second-generation PAMAM dendrimer. Constant-pH MD simulations were used to map PAMAM’s conformational space at its full pH range (from 2.5 to 12.5). Our simulations clearly captured the coupling between protonation and conformation in PAMAM. Interestingly, the dendrimer conformational distribution was almost independent of the ionic strength treatment methods, which is in contrast to what we have observed in charged lipid bilayers. Overall, our results confirm that both GRF with implicit ionic strength and a fully neutralized system with PME are valid approaches to model charged globular systems, using the GROMOS 54A7 force field.
1. Introduction
There are numerous examples of interesting charged systems across the biophysical, biochemical, and chemical fields, such as anionic lipid domains of cardiolipin in mitochondrial membranes1 and cationic proteins such as staphylococcal nuclease.2 In these systems, electrostatic interactions have a central role and, therefore, the ionic strength of the solution also becomes very important. Ionic strength influences the conformational space of molecules by attenuating their electrostatic interactions either directly or via screening effects.3,4
In molecular dynamics simulations, ionic strength effects can be introduced in an exclusively implicit manner by adding an extra attenuating term to the reaction field formalism (generalized reaction field, GRF)5 or by including explicit ions. In the latter case, it is common to simply add enough counter ions to achieve neutrality or to add extra ions, after neutrality, to obtain the desired ionic strength.
We have previously reported that, when dealing with charged membranes, in the GROMOS 54A7 force field, the system neutralization leads to simulations not being able to reproduce the correct experimental lipidic phases.6 To accurately describe the phase transition in 25% of phosphatidic acid (PA) and phosphatidylcholine (PC) anionic membranes, a new method to treat ionic strength was introduced.6,7 This method estimates the ion concentration near the bilayer using the Poisson–Boltzmann (PB) equation. In the studied charged membrane systems, even though the number of ions estimated from PB is usually not enough to neutralize the simulation box, the membrane properties observed were in better agreement with experimental results. When these systems were neutralized, the lipid bilayers remained too ordered, in the gel phase even at full ionization, probably because of excess of stabilizing counterions trapped near the membrane. By contrast, a simpler approach relying exclusively on GRF with an implicit ionic strength resulted in lipid bilayers being too unstable. This issue regarding the ionic strength treatment in MD simulations of charged membrane systems may have a profound effect on the quality of the model being simulated.6,7
Aware of the limitations in modeling ionic strength effects in charged membrane systems, we now question whether these effects are also present in charged globular systems, such as proteins or dendrimers. In this work, we explore whether the conformational space of one of such systems is influenced by different approaches for ionic strength inclusion. We opted for a second-generation polyamidoamine (PAMAM) dendrimer because it only has cationic groups, which simplifies the problem, and at low pH values will exhibit a significant positive charge.8 The PAMAM dendrimer is a ramified structure repeating tertiary amino groups, connected by amide bonds and ending with primary amines at the outer layer. Even at full ionization, it will retain its globular shape, similarly to proteins, and its conformational space can be reasonably described by its radius of gyration.9 Other advantages are its high structural plasticity, relatively high charge density, and titrable sites that are solvent-accessible. Hence, PAMAM should be more sensitive to ionic strength than a regular globular protein, which renders it a good system to check for differences in the protonation/conformation space between ionic strength treatment methods. This can be seen as a worst case scenario for what happens with regular proteins at physiological pH.
Lowering the pH, all amino groups in PAMAM will eventually protonate and expose their positive charges. The presence/absence of counterions in the simulation box should have an effect on charge repulsion between amino groups, their pKa values, and consequently, on how much these groups prefer to be exposed to solvent. We rely on constant-pH molecular dynamics (CpHMD) simulations10−27 to capture the coupling between amino group protonation and the conformational space of the PAMAM dendrimer. We can generate full titration curves that can be compared with experimental data8 for validation. A CpHMD method is thermodynamically more appropriate to explore PAMAM conformational space at a given pH value. Because proton occupancies are combinatorial by nature, MD simulations at fixed protonation states become impractical when several amino groups protonate at similar pH values and affect the proton affinities of neighboring groups. Furthermore, even if all relevant protonation combinations were simulated, the overall correlation between protonation and conformation would still not be fully captured because of the unknown weights of each protonation combination, as abundantly discussed in most CpHMD literature (e.g., see ref (10)). Our CpHMD method has been developed and optimized to work with GROMOS force fields, currently precluding the investigation of this neutralization issue with other force fields.
The treatment of long-range electrostatics also plays an important role in MD simulations of charged systems. Arguably, the most commonly used methods to deal with long-range interactions are particle mesh Ewald (PME) and reaction field (RF) or GRF. In Ewald summation-derived methods, the slowly conditionally convergent long-range interactions potential of a periodic system is separated into two rapidly convergent series. From a physical perspective, this is achieved by adding and then subtracting a charge distribution to the original point charge. The addition of a charge distribution of equal magnitude and opposite sign weakens the Coulombic interactions, allowing their potential to be calculated by a direct sum in the real space. The effect of an extra charge distribution is then corrected in the reciprocal space by subtracting an equal charge distribution and contribution of the interaction between the original charge and the added distribution. In PME, the Gaussian distribution charges in the reciprocal space are mapped onto a grid and the potential is efficiently calculated by leveraging a fast Fourier transform algorithm.28−31
The RF methods are based on Onsager’s work,32 in which the explicit (noncontinuum) system polarizes the surrounding dielectric, which in turn will act back. The implementation of such methods is made by applying a cutoff distance around the molecule from which it is assumed that there is a homogeneous medium with a fixed dielectric constant. Within this cutoff distance, the electrostatic potential of the Coulombic interactions between the solute and solvent sites are calculated to satisfy the Poisson equation. The GRF method, based on Kirkwood’s method,33,34 uses the general solution to the linearized PB equation in a sphere, which includes the effect of bulk ionic strength.5,31
As RF and GRF assume a spherical mean-field approximation beyond a cutoff in inhomogeneous systems, such as lipid bilayers, this assumption is no longer valid. However, RF or GRF has been shown to reproduce the experimental lipidic phases of PC-based lipid bilayers35,36 and the pH-dependent phase transition in the 25% PA/PC anionic membrane.6,7 Also, RF methods generate energy discontinuity on the surface of the cutoff sphere, while PME introduces artificial periodicity in the system.37 Another limitation in PME is that it requires a full system neutralization, which might not be physical in some charged systems, where full neutralization can be attained only at 3 or 4 nm away from the solute.6 Alternatively, PME can also be used in a charged system with a neutralizing uniform background charge density, but this can be a rough approximation and has already been found to introduce artifacts in inhomogeneous systems.38 In overall, both methods rely on assumptions and approximations and should be selected based on these approximations, and ultimately, on their ability to reproduce the experimental data.
In this work, we employed CpHMD simulations of the second-generation PAMAM dendrimer at its full pH range (from 2.5 to 12.5) to investigate the effects of using two limit approaches to the ionic strength treatment: implicitly (GRF) and full system neutralization with explicit ions (GRF or PME). In this context, more important than the ability of a given setup to reproduce the experimental data will be the direct comparison between ionic strength treatment approaches. In the future, this will help us make a better informed choice of which approach to use with GROMOS 54A7 in regular MD and CpHMD simulations of globular systems.
2. Results and Discussion
2.1. PAMAM Titration
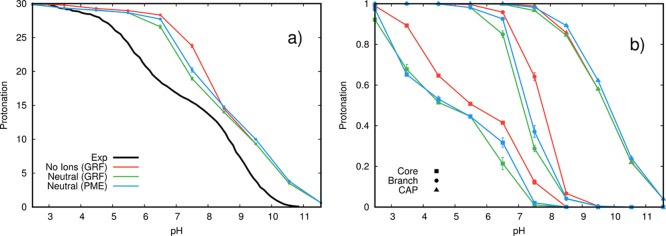
The CpHMD simulations were performed at different pH values, and they allowed us to obtain full titration curves from the average protonation states (Figure 1a). Our titration curves were able to capture the experimental curve trend where primary amines seem to titrate at higher pH values (8–11), while tertiary amines only become protonated at acidic pH (3–7) separated by a short plateau region. This plateau is not easily observed in our titration curves, but the separation between the two titration regions becomes clear in the primary/tertiary individual curves (Figure 1b). The calculated titration curves are shifted toward higher pH values, particularly for the tertiary amines. The reason for these deviations lies in the used pKmethod values, which were calibrated to predict the experimental pKa values of simple aliphatic amines, such as ethyl, diethyl, and triethyl amines. It seems that these values cannot be easily transferred from these compounds to PAMAM where the amino groups are bridged by amide bonds, which might be introducing quantum effects not completely captured by continuum electrostatic methods. The most significant difference between the calculated curves is observed at pH 7.5, where GRF with no ions is more charged than the neutral systems. This suggests that, in this pH region, the presence of counterions induces more compact conformations (see below), and the shorter distances between amino groups favor the neutral forms.
Figure 1.
Total titration curves for the simulated and experimental8 second-generation PAMAM (a) and the partial titration curves for the three different types of amines (b).
The three calculated titration curves were obtained using different methods to treat ionic strength (see the Methods section). Interestingly, similar results were obtained with all approaches, which indicates a low sensibility to the presence of counterions, contrary to that observed in charged membrane systems.6,7 This result can be explained by a weaker interaction between PAMAM and counterions (see the Counterion Effects section), a smaller availability of Cl– ions due to the different ion diffusion dimensionality and/or because protonation does not depend so much on the conformations of the solute.
2.2. PAMAM Conformational Analysis
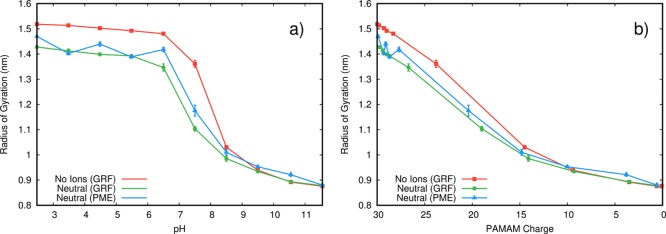
A clear advantage of choosing a dendrimer system for our study is that we can capture most of the conformational variability with a simple structural property such as the radius of gyration (Rg) (Figure 2). From the simulations, we observe a strong protonation/conformational coupling where PAMAM increases its Rg with decreasing pH. This is a simple response to the increasing charge repulsion, as observed in other dendrimers.39−42 Furthermore, the presence of counterions allows the dendrimer to sample slightly more compact conformations, suggesting that at least a fraction of those ions are interacting directly and stabilizing the charged amines.
Figure 2.
Average PAMAM radius of gyration at different pH values (a) and at the corresponding PAMAM charge values (b).
Validating structural information by comparing between simulations and experiments is seldom straightforward.43 The Rg data about G2-PAMAM in the literature are scarce, and most values available are obtained from computational MD simulations with very limited sampling.44−48 The longest production runs employed were obtained from 30 ns simulations,48 which is similar to what we disregard in our work because of the values of Rg not being equilibrated. There are SAXS experiments performed on G2-PAMAM in methanol which allowed the calculation of Rg values (1.1149 and 1.18 nm50). However, it is difficult to compare these values with our work, even at high pH values because of the solvent difference, which may have a significant nonobvious impact on the dendrimer structure. Furthermore, although hydrodynamic radii for PAMAM-G2 have been obtained by DOSY NMR at different pH values,51 the two kinds of radii are not directly comparable.52
The dendrimer’s more stretched conformations, typical of low pH values, also seem to induce a higher solvent exposure, which results in a solvent-accessible surface (SAS) area profile very similar to that observed for Rg (Figure S1 in the Supporting Information). As expected, the solvent exposure of the different amino groups depends on the topological position and on the pH region they titrate (Figure S2 in the Supporting Information). The primary amines are more solvent-exposed than the tertiary amines in all the pH range because they are in the outer layer of PAMAM. Interestingly, the most external tertiary amines (outer branch) are, at acidic pH values, the least exposed. This is probably related with transient interactions between these amino groups and the carbonyls of the outer amide segments (Figure S3 in the Supporting Information). These interactions are significantly less common in the inner amines because of a lower flexibility of the adjacent amide carbonyls, which would need to rotate ∼180° to establish the interaction.
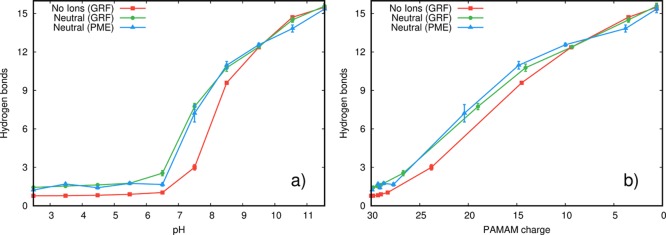
The PAMAM conformational space can also be described by the average number of intramolecular hydrogen bonds (Figure 3). All systems show a minimum number of hydrogen bonds at pH values below 6.5, maintaining a residual hydrogen bond average number of ∼1.5. Above this pH value, the total charge decreases (Figure 3b), leading to a lower repulsion between amino groups and, consequently, to a high number of hydrogen bonds. When using GRF without counterions in charged PAMAM, there is always slightly less hydrogen bonds due to a smaller attenuation of charge repulsions.
Figure 3.
Average number of hydrogen bonds in PAMAM at different pH (a) and ionization (b) values. The hydrogen bond criteria are described in the Methods section.
2.3. Counterion Effects
The distribution of ions around PAMAM shows strong pH dependence (Figure 4). In more charged dendrimers, we observe a higher abundance of interacting counterions which decreases with higher pH (deprotonation). The first (0.22 nm), second (∼0.42 nm), and third (∼0.62 nm) peaks correspond to ions replacing water molecules in the first three solvation shells. When PAMAM is almost fully deprotonated (pH 11.5), the only chloride ion in the system favors the aqueous solvent. Also, the ion distribution seems independent of the used long-range electrostatics treatment because we obtained an almost identical ion distribution profile for the simulations using PME (Figure S4).
Figure 4.
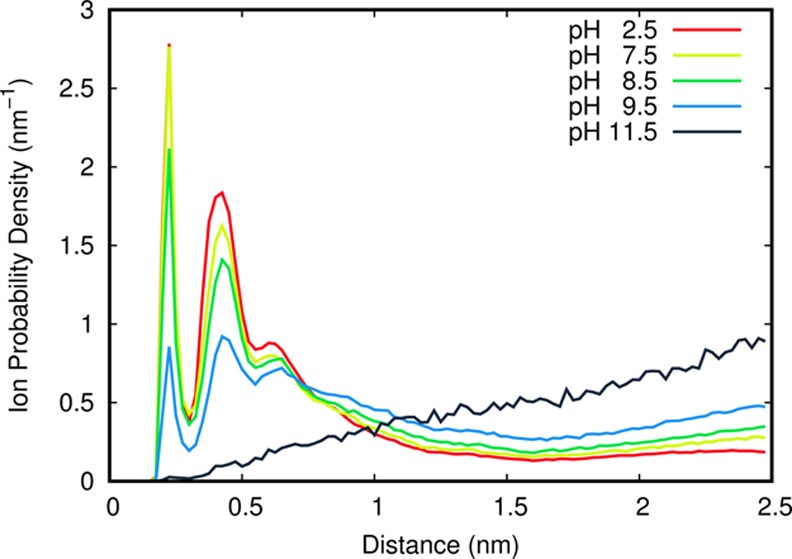
Probability density of the minimum distance between each Cl– and PAMAM in the GRF system. The dendrimer has an average total charge of 29.8, 19.0, 14.1, 9.3, and 0.6, at pH values 2.5, 7.5, 8.5, 9.5, and 11.5, respectively.
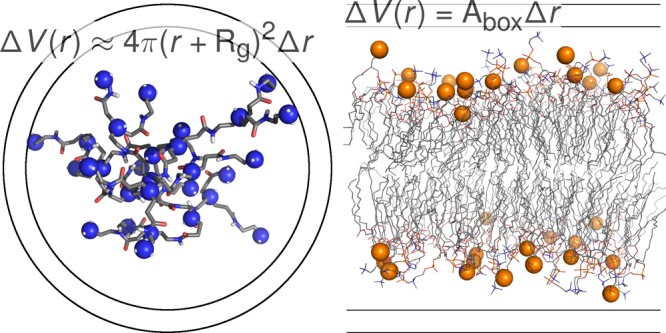
In globular systems, ions approaching the solute will experience a high concentration effect because of the significant decrease in the layer volume (Figure 5). Note that in a planar slab (like in membranes), the volume does not vary with distance, being proportional to the thickness of the layer being considered (Δr, Figure 5), whereas in a more globular geometry (such as in PAMAM), distant layers will occupy higher volumes than closer ones with the same thickness (Δr, Figure 5). This effect probably limits the accumulation of counterions near PAMAM, even when highly charged. To compare the two geometries, we used a highly charged PAMAM dendrimer (+30 charges) and a charged PA/PC membrane (−48 charges). These have similar surface charge densities (0.19 C m–2 for PAMAM and 0.21 C m–2 for PA/PC bilayer6) obtained from a rough approximation of their shape (a sphere with a radius equal to the average Rg, 1.4 nm, and a plane, x × y box vectors). We do not claim the PAMAM structure to be a sphere; we just use this simplification to estimate the surface charge densities of a globular fully charged PAMAM. From the simulations of these two systems, we computed the average counterion concentration when approaching the solute (Figure 6). We observe a clear difference between both distributions at higher distances. In PAMAM, there is a gradual convergence to a long (bulk) ionic strength value, whereas in the PA/PC, this distribution drops to ∼0 at short distances (∼1 nm). This excess in counterion binding to a lipid bilayer has already been observed6,7 and may be related with inaccurate force field parameters for cations.53,54Figure 6 also shows that the ion concentration at the first and second solvation shells are very similar, despite the different number of total counterions available. In fact, in PAMAM distribution, the two peaks correspond to ∼3 and ∼7 counterions, whereas in the PA/PC bilayer, there are ∼13 and ∼31 counterions in the same two regions. This difference perfectly illustrates the layer volume variation effect and helps understand why globular systems are more robust to changes in the ionic strength methods used.
Figure 5.
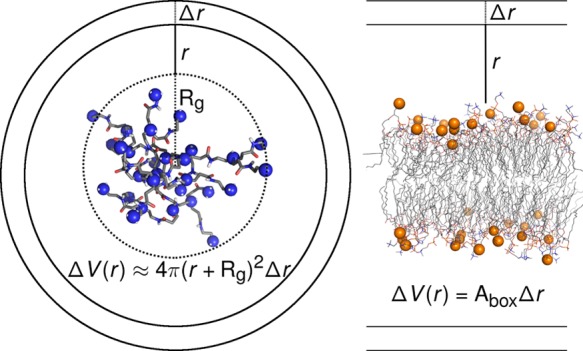
Schematic representation of the simplified geometries of PAMAM (spherical) and PA/PC membranes (planar). The amino groups, in PAMAM, and the phosphorus atoms, in the lipid bilayer, are shown as blue and orange spheres, respectively.
Figure 6.
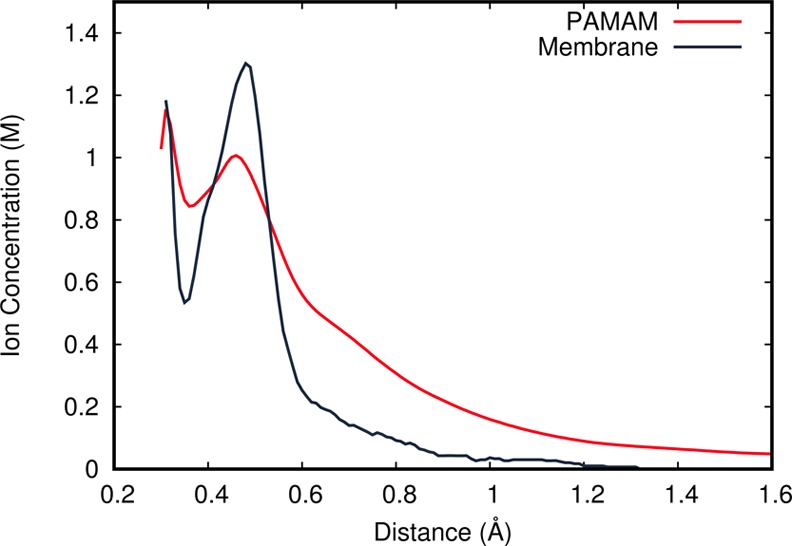
Counterion concentration distribution around PAMAM and PA/PC bilayer6 of similar charge density (0.19 C m–2 for PAMAM and 0.21 C m–2 for PA/PC). The number of counterions present in the PAMAM system is 30 Cl–, while for PA/PC, it is 48 Na+. The distribution was averaged using a floating window with a 0.2 nm bin size and a 0.01 nm increasing step.
3. Conclusions
In this work, we performed constant-pH MD simulations of second-generation PAMAM in its full pH range (from 2.5 to 12.5). The ionic strength effects were introduced in the simulations by using two limit approaches, implicitly with GRF or using full system neutralization with either GRF or PME. Our simulations clearly captured the coupling between protonation and conformation in these PAMAM dendrimers.
The calculated titration curves are in reasonable agreement with experimental data, clearly distinguishing between the contributions from the different amino groups of the dendrimer. Also, we observed that in our globular PAMAM dendrimer system, even when highly charged (i.e., at low pH), its conformational space is only slightly dependent on the ionic strength treatment methods. The presence of explicit counterions neutralizing our system has only a small effect on most of its structural properties. Therefore, it seems that counterions do not play such a crucial role in our PAMAM simulations, in contrast to what we observed in charged lipid bilayers.6
The fact that this charged globular system is mostly insensitive to changes in the ionic strength methods used can be explained by the small number of counterions directly interacting with PAMAM in the nearest solvation shells. In these systems, because of their radial topology, the ion accessible volume decreases sharply when approaching the solute, leading to significant ion–ion repulsion. In charged bilayer systems, even though there is a much larger number of ions bound to the solute, there is no equivalent volume variation, resulting in ion concentrations similar to PAMAM.
In conclusion, our results with this worst case scenario system indicate that these most common methods to deal with electrostatics and ionic strength effects are valid approaches to model charged globular systems in regular MD and CpHMD simulations using the GROMOS 54A7 force field.
4. Methods
4.1. Constant-pH MD Settings
All CpHMD simulations were performed with the stochastic titration constant-pH MD method.7,10−12,39,42,55−66 This method was implemented for the GROMACS package and consists of a MM/MD simulation in which the protonation states of a given molecule titrable sites are allowed to change. The exchange in protonation is determined by a Poisson–Boltzmann/Monte Carlo (PB/MC) step at a τprt interval (2 ps). After the protonation state update, a short MD of duration τrlx (0.2 ps) with a frozen solute allows the solvent to adapt to the new environment (for further details, please see refs (11) and (66)).
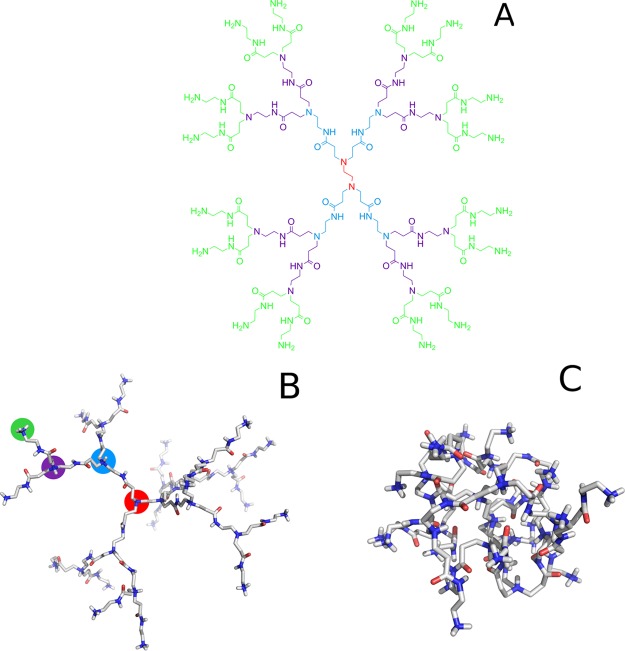
The second-generation PAMAM molecule used in this work has 30 titrable sites distributed in a radial symmetry. These sites consist of 2 core branch tertiary amines, 4 first-generation branch tertiary amines, 8 second-generation branch tertiary amines, and 16 end primary amines at the outer shell (Figure 7).
Figure 7.
Chemical Structure of a second-generation PAMAM (A). Conformations of an extendend PAMAM molecule at the low pH value (B) and a typical compact conformation at the high pH value (C). The amine types are color coded in the picture: red for a core amine, blue for an inner branch amine, purple for an outer branch amine, and green for a primary amine.
All amines were allowed to titrate in the complete pH range (from pH 2.5 to 12.5 in 1 unit steps). The branching tertiary amines connect two identical arms which can be distinguished by the protonation states of their amino groups. Also, because of a low energy barrier to inversion, these can racemize in the μs timescale. In GROMOS 54A7, these amino groups are not allowed to invert; hence, the final racemization obtained is only due to the fast changing of the protonation states obtained in our CpHMD simulations. Three different systems of PAMAM were set up, in which the ionic strength treatment was varied: without the addition of explicit ions, where GRF was used with an implicit ionic strength; and with the addition of explicit anions (Cl–) to approximately neutralize the simulation box, using two long-range electrostatics methods, GRF (at the intended ionic strength) or PME. All simulations were performed at ionic strength 0.1 M to match the experimental titration curve.8 In all “neutral” systems, the choice of the number of ions to include in our simulations required a self-consistent iterative procedure consisting of the following steps. First, an initially estimated number of ions is added to the simulation box; after 30 ns, the average box net charge is evaluated and a new attempt is made to attain neutrality. The procedure stops when the difference between the number of ions and the dendrimer charge is less than 1 unit (Table 1). In this procedure, the simulation box will not be completely neutralized, it simply ensures that the total charge fluctuates near zero (the standard deviations estimate the size of these fluctuations). Five replicates of 100 ns each (where the first 20 ns of every simulation were disregarded to account for the system equilibration) were done for each pH value, which led to a total cumulative simulation time of 15.5 μs.
Table 1. Summary of the Number of Ions Used in Each Long-Range Settings of the Simulations Performed in this Work and the Average PAMAM Chargea.
| GRF (no
ions) |
GRF (ions) |
PME (ions) |
||||
|---|---|---|---|---|---|---|
| pH | ions | charge (SD) | ions | charge (SD) | ions | charge (SD) |
| 2.5 | 0 | 30.0 (0.14) | 30 | 29.8 (0.36) | 30 | 29.9 (0.22) |
| 3.5 | 0 | 29.8 (0.41) | 29 | 29.4 (0.48) | 29 | 29.3 (0.47) |
| 4.5 | 0 | 29.3 (0.46) | 29 | 29.0 (0.27) | 29 | 29.1 (0.26) |
| 5.5 | 0 | 29.0 (0.32) | 29 | 28.7 (0.62) | 29 | 28.7 (0.61) |
| 6.5 | 0 | 28.3 (0.85) | 26 | 26.7 (1.63) | 27 | 27.7 (1.17) |
| 7.5 | 0 | 23.8 (2.37) | 19 | 19.0 (2.12) | 20 | 20.4 (2.30) |
| 8.5 | 0 | 14.5 (1.64) | 14 | 14.1 (1.52) | 15 | 14.8 (1.45) |
| 9.5 | 0 | 9.4 (1.61) | 9 | 9.3 (1.59) | 10 | 10.0 (1.61) |
| 10.5 | 0 | 3.5 (1.42) | 3 | 3.5 (1.43) | 4 | 3.8 (1.46) |
| 11.5 | 0 | 0.6 (0.75) | 1 | 0.6 (0.75) | 1 | 0.6 (0.74) |
| 12.5 | 0 | 0.1 (0.26) | ||||
SD: standard deviation.
4.2. Charge Parameterization of the Amino Groups
The amino groups model compounds used were parameterized from simple amines: ethylamine, diethylamine, and triethylamine for the primary, secondary, and tertiary amines, respectively. The atomic partial charges (Table S1 in the Supporting Information) were obtained from the RESP protocol,67 which fitted them to the electrostatic potential determined from geometry optimization in Gaussian 0968 using the B3LYP functional69−71 and the 6-31G(d) basis set.72 The pKmod values were obtained (Table S2 in the Supporting Information) from a calibration protocol,59 using CpHMD simulations of the three different amines and fitting to the desired experimental pKa values.73
4.3. MM/MD Settings
The MM/MD simulations were done with a modified version of the GROMOS 54A7 force field74 using GROMACS 4.0.7,75 also modified to include a user-specified ionic strength value for the GRF.11 There were ∼12300 explicit SPC76 water molecules in our systems, which only varied because of replacement with ions, in a rhombic dodecahedral simulation box with periodic boundary conditions. Long-range electrostatics were treated either with GRF or PME. GRF was used with twin-range cutoffs of 0.8 and 1.4 nm, with the neighbor lists being periodically updated every step or every 5 steps, respectively; a relative permittivity constant of 5477 and an ionic strength of 0.1 M were also used. With PME, we used a plain cutoff scheme of 0.9 nm to compute the short-range interactions and a Fourier space grid of 0.12 nm. The Lennard–Jones cutoffs were set to 1.4 in GRF and decreased to 0.9 nm in PME to use and update a single pair list, leading to increased computational speed without disregarding significant Lennard–Jones contributions. The simulations were performed with a 2 fs integration step.
All MD simulations were performed in the NPT ensemble. Temperature was kept constant using the v-rescale thermostat78 at 298 K with a relaxation time of 0.1 ps in a separate coupling for PAMAM and solvent (including ions). To maintain constant pressure at 1 bar, we used the Parrinello–Rahman coupling scheme79 with a relaxation time of 2.0 ps and a compressibility of 4.5 × 10⁻⁵ bar–1. The LINCS algorithm80 was used to constrain all solute bonds, and SETTLE81 was used for water molecules.
The minimization procedure consisted of three consecutive sets of ∼2000 steps with varying integrators: unconstrained steepest descent followed by unconstrained low-memory Broyden–Fletcher–Goldfarb–Shanno and, finally, another set of steepest descent but this time with all bonds constrained. The initiation procedure consisted of two sequential MD runs of 50 ps with different restraints on the PAMAM molecule. In the first run, all heavy atoms were restrained with a force constant of 1000 kJ·mol–1·nm–2, while in the second run, only the nitrogen atoms were restrained.
4.4. Poisson–Boltzmann/Monte Carlo Settings
The PB calculations were done with DelPhi V5.182 using GROMOS 54A7 force field partial charges, with the exception of the amino group charges. Atomic radii were derived from the Lennard–Jones parameters of each atom against the oxygen of a water molecule.83 The relative permittivity constants were 2 for PAMAM and 80 for the solvent. We used a temperature of 298 K and an ionic strength of 0.1 M. All PB calculations were done in a cubic grid with coulombic boundary potential. We used a two-step focusing procedure84 with 61 grid points and the focus grid being four times smaller than the coarser grid (corresponding to a grid space of 1.0 for the coarser grid and 0.25 for the smaller). The convergence threshold value was set to 0.01kBT/e.
PETIT V1.685 was used to perform the Monte Carlo sampling of protonation states with 105 cycles. Each cycle consists of random trial exchanges of the protonation state of all individual sites and pairs of sites with an interaction larger than 2 pH units that are either accepted or rejected according to a Metropolis criterion.86
4.5. Analyses
The analyses were carried out on the equilibrated segments of all simulations using tools from the GROMACS package75 together with in-house scripts. To calculate the hydrogen bonds in PAMAM, we need to circumvent a CpHMD-specific feature:56 all possible protonation positions have explicit protons present throughout the simulation, varying only in their charge upon (de)protonation events. Thus, we defined hydrogen bonds with simple 3.2 Å distance criteria87 for two nitrogen atoms or a nitrogen atom and an oxygen atom. All error bars show the standard error of the mean between the different replicates. PyMOL was used to generate all structural representations.88
Acknowledgments
We thank Rafael Nunes for help with artwork. This work was financially supported by Project LISBOA-01-0145-FEDER-007660 (Microbiologia Molecular, Estrutural e Celular) funded by FEDER funds through COMPETE2020—Programa Operacional Competitividade e Internacionalização (POCI) and by Fundação para a Ciência e a Tecnologia (FCT). The authors also thank FCT for grant SFRH/BPD/110491/2015, and projects UID/MULTI/00612/2013, and PTDC/QEQ-COM/5904/2014.
Supporting Information Available
The Supporting Information is available free of charge on the ACS Publications website at DOI: 10.1021/acsomega.7b01708.
Charge sets and pKmod values used in the simulations, total and per amine SAS area values, and hydrogen bond snapshots (PDF)
The authors declare no competing financial interest.
Supplementary Material
References
- Nelson D. L.; Cox M. M.. Lehninger Principles of Biochemistry; WH Freeman and Company: New York, 2005; pp 343–368. [Google Scholar]
- Whitten S. T.; García-Moreno E. B. pH dependence of stability of staphylococcal nuclease: evidence of substantial electrostatic interactions in the denatured state. Biochemistry 2000, 39, 14292–14304. 10.1021/bi001015c. [DOI] [PubMed] [Google Scholar]
- Kao Y.-H.; Fitch C. A.; Bhattacharya S.; Sarkisian C. J.; Lecomte J. T. J.; García-Moreno E. B. Salt effects on ionization equilibria of histidines in myoglobin. Biophys. J. 2000, 79, 1637–1654. 10.1016/s0006-3495(00)76414-9. [DOI] [PMC free article] [PubMed] [Google Scholar]
- Song B.; Cho J.-H.; Raleigh D. P. Ionic-strength-dependent effects in protein folding: Analysis of rate equilibrium free-energy relationships and their interpretation. Biochemistry 2007, 46, 14206–14214. 10.1021/bi701645g. [DOI] [PubMed] [Google Scholar]
- Tironi I. G.; Sperb R.; Smith P. E.; van Gunsteren W. F. A generalized reaction field method for molecular dynamics simulations. J. Chem. Phys. 1995, 102, 5451–5459. 10.1063/1.469273. [DOI] [Google Scholar]
- Vila-Viçosa D.; Teixeira V. H.; Santos H. A. F.; Baptista A. M.; Machuqueiro M. On the treatment of ionic strength in biomolecular simulations of charged lipid bilayers. J. Chem. Theory Comput. 2014, 10, 5483–5492. 10.1021/ct500680q. [DOI] [PubMed] [Google Scholar]
- Santos H. A. F.; Vila-Viçosa D.; Teixeira V. H.; Baptista A. M.; Machuqueiro M. Constant-pH MD simulations of DMPA/DMPC lipid bilayers. J. Chem. Theory Comput. 2015, 11, 5973–5979. 10.1021/acs.jctc.5b00956. [DOI] [PubMed] [Google Scholar]
- Cakara D.; Kleimann J.; Borkovec M. Microscopic protonation equilibria of poly (amidoamine) dendrimers from macroscopic titrations. Macromolecules 2003, 36, 4201–4207. 10.1021/ma0300241. [DOI] [Google Scholar]
- Bosman A. W.; Janssen H. M.; Meijer E. W. About Dendrimers: Structure, Physical Properties, and Applications. Chem. Rev. 1999, 99, 1665–1688. 10.1021/cr970069y. [DOI] [PubMed] [Google Scholar]
- Baptista A. M.; Teixeira V. H.; Soares C. M. Constant-pH molecular dynamics using stochastic titration. J. Chem. Phys. 2002, 117, 4184–4200. 10.1063/1.1497164. [DOI] [Google Scholar]
- Machuqueiro M.; Baptista A. M. Constant-pH Molecular Dynamics with Ionic Strength Effects: Protonation–Conformation Coupling in Decalysine. J. Phys. Chem. B 2006, 110, 2927–2933. 10.1021/jp056456q. [DOI] [PubMed] [Google Scholar]
- Teixeira V. H.; Vila-Viçosa D.; Reis P. B. P. S.; Machuqueiro M. pKa Values of Titrable Amino Acids at the Water/Membrane Interface. J. Chem. Theory Comput. 2016, 12, 930–934. 10.1021/acs.jctc.5b01114. [DOI] [PubMed] [Google Scholar]
- Bürgi R.; Kollman P. A.; van Gunsteren W. F. Simulating proteins at constant pH: an approach combining molecular dynamics and Monte Carlo simulation. Proteins: Struct., Funct., Bioinf. 2002, 47, 469–480. 10.1002/prot.10046. [DOI] [PubMed] [Google Scholar]
- Dlugosz M.; Antosiewicz J. M. Constant-pH molecular dynamics simulations: a test case of succinic acid. Chem. Phys. 2004, 302, 161–170. 10.1016/j.chemphys.2004.03.031. [DOI] [Google Scholar]
- Długosz M.; Antosiewicz J. M.; Robertson A. D. Constant-pH molecular dynamics study of protonation-structure relationship in a heptapeptide derived from ovomucoid third domain. Phys. Rev. E: Stat., Nonlinear, Soft Matter Phys. 2004, 69, 021915. 10.1103/physreve.69.021915. [DOI] [PubMed] [Google Scholar]
- Lee M. S.; Salsbury F. R. Jr.; Brooks C. L. III Constant-pH molecular dynamics using continuous titration coordinates. Proteins: Struct., Funct., Bioinf. 2004, 56, 738–752. 10.1002/prot.20128. [DOI] [PubMed] [Google Scholar]
- Mongan J.; Case D. A.; McCammon J. A. Constant pH molecular dynamics in generalized Born implicit solvent. J. Comput. Chem. 2004, 25, 2038–2048. 10.1002/jcc.20139. [DOI] [PubMed] [Google Scholar]
- Stern H. A. Molecular simulation with variable protonation states at constant pH. J. Chem. Phys. 2007, 126, 164112. 10.1063/1.2731781. [DOI] [PubMed] [Google Scholar]
- Itoh S. G.; Damjanović A.; Brooks B. R. pH replica-exchange method based on discrete protonation states. Proteins: Struct., Funct., Bioinf. 2011, 79, 3420–3436. 10.1002/prot.23176. [DOI] [PMC free article] [PubMed] [Google Scholar]
- Vorobjev Y. N. Potential of mean force of water-proton bath and molecular dynamic simulation of proteins at constant pH. J. Comput. Chem. 2012, 33, 832–842. 10.1002/jcc.22909. [DOI] [PubMed] [Google Scholar]
- Swails J. M.; Roitberg A. E. Enhancing conformation and protonation state sampling of hen egg white lysozyme using pH replica exchange molecular dynamics. J. Chem. Theory Comput. 2012, 8, 4393–4404. 10.1021/ct300512h. [DOI] [PubMed] [Google Scholar]
- Wallace J. A.; Shen J. K. Charge-leveling and proper treatment of long-range electrostatics in all-atom molecular dynamics at constant pH. J. Chem. Phys. 2012, 137, 184105. 10.1063/1.4766352. [DOI] [PMC free article] [PubMed] [Google Scholar]
- Bennett W. F. D.; Chen A. W.; Donnini S.; Groenhof G.; Tieleman D. P. Constant pH simulations with the coarse-grained MARTINI model—Application to oleic acid aggregates. Can. J. Chem. 2013, 91, 839–846. 10.1139/cjc-2013-0010. [DOI] [Google Scholar]
- Chen W.; Wallace J. A.; Yue Z.; Shen J. K. Introducing titratable water to all-atom molecular dynamics at constant pH. Biochem. J. 2013, 105, L15–L17. 10.1016/j.bpj.2013.06.036. [DOI] [PMC free article] [PubMed] [Google Scholar]
- Goh G. B.; Hulbert B. S.; Zhou H.; Brooks C. L. Constant pH molecular dynamics of proteins in explicit solvent with proton tautomerism. Proteins: Struct., Funct., Bioinf. 2014, 82, 1319–1331. 10.1002/prot.24499. [DOI] [PMC free article] [PubMed] [Google Scholar]
- Lee J.; Miller B. T.; Damjanović A.; Brooks B. R. Constant pH molecular dynamics in explicit solvent with enveloping distribution sampling and Hamiltonian exchange. J. Chem. Theory Comput. 2014, 10, 2738–2750. 10.1021/ct500175m. [DOI] [PMC free article] [PubMed] [Google Scholar]
- Swails J. M.; York D. M.; Roitberg A. E. Constant pH replica exchange molecular dynamics in explicit solvent using discrete protonation states: implementation, testing, and validation. J. Chem. Theory Comput. 2014, 10, 1341–1352. 10.1021/ct401042b. [DOI] [PMC free article] [PubMed] [Google Scholar]
- Darden T.; York D.; Pedersen L. Particle mesh Ewald: An N log (N) method for Ewald sums in large systems. J. Chem. Phys. 1993, 98, 10089–10092. 10.1063/1.464397. [DOI] [Google Scholar]
- Toukmaji A. Y.; Board J. A. Ewald summation techniques in perspective: a survey. Comput. Phys. Commun. 1996, 95, 73–92. 10.1016/0010-4655(96)00016-1. [DOI] [Google Scholar]
- Gibbon P.; Sutmann G.. Long-Range Interactions in Many-Particle Simulation. Quantum Simulations of Complex Many-Body Systems: From Theory to Algorithms; NIC Directors, 2002; Vol. 10. [Google Scholar]
- Cisneros G. A.; Karttunen M.; Ren P.; Sagui C. Classical Electrostatics for Biomolecular Simulations. Chem. Rev. 2014, 114, 779. 10.1021/cr300461d. [DOI] [PMC free article] [PubMed] [Google Scholar]
- Onsager L. Electric Moments of Molecules in Liquids. J. Am. Chem. Soc. 1936, 58, 1486–1493. 10.1021/ja01299a050. [DOI] [Google Scholar]
- Kirkwood J. G. Theory of solutions of molecules containing widely separated charges with special application to zwitterions. J. Chem. Phys. 1934, 2, 351–361. 10.1063/1.1749489. [DOI] [Google Scholar]
- Tanford C.; Kirkwood J. G. Theory of protein titration curves. I. General equations for impenetrable spheres. J. Am. Chem. Soc. 1957, 79, 5333–5339. 10.1021/ja01577a001. [DOI] [Google Scholar]
- Poger D.; Mark A. E. On the Validation of Molecular Dynamics Simulations of Saturated and cis-Monounsaturated Phosphatidylcholine Lipid Bilayers: A Comparison with Experiment. J. Chem. Theory Comput. 2010, 6, 325–336. 10.1021/ct900487a. [DOI] [PubMed] [Google Scholar]
- Poger D.; Van Gunsteren W. F.; Mark A. E. A new force field for simulating phosphatidylcholine bilayers. J. Comput. Chem. 2010, 31, 1117–1125. 10.1002/jcc.21396. [DOI] [PubMed] [Google Scholar]
- Hünenberger P.; McCammon J. A. Effect of artificial periodicity in simulations of biomolecules under Ewald boundary conditions: a continuum electrostatics study. Biophys. Chem. 1999, 78, 69–88. 10.1016/s0301-4622(99)00007-1. [DOI] [PubMed] [Google Scholar]
- Hub J. S.; de Groot B. L.; Grubmüller H.; Groenhof G. Quantifying Artifacts in Ewald Simulations of Inhomogeneous Systems with a Net Charge. J. Chem. Theory Comput. 2014, 10, 381–390. 10.1021/ct400626b. [DOI] [PubMed] [Google Scholar]
- Filipe L. C. S.; Machuqueiro M.; Darbre T.; Baptista A. M. Exploring the Structural Properties of Positively Charged Peptide Dendrimers. J. Phys. Chem. B 2016, 120, 11323–11330. 10.1021/acs.jpcb.6b09156. [DOI] [PubMed] [Google Scholar]
- Filipe L. C. S.; Machuqueiro M.; Darbre T.; Baptista A. M. Unraveling the Conformational Determinants of Peptide Dendrimers Using Molecular Dynamics Simulations. Macromolecules 2013, 46, 9427–9436. 10.1021/ma401574b. [DOI] [Google Scholar]
- Filipe L. C. S.; Machuqueiro M.; Baptista A. M. Unfolding the Conformational Behavior of Peptide Dendrimers: Insights from Molecular Dynamics Simulations. J. Am. Chem. Soc. 2011, 133, 5042–5052. 10.1021/ja111001v. [DOI] [PubMed] [Google Scholar]
- Filipe L. C. S.; Campos S. R. R.; Machuqueiro M.; Darbre T.; Baptista A. M. Structuring Peptide Dendrimers through pH Modulation and Substrate Binding. J. Phys. Chem. B 2016, 120, 10138–10152. 10.1021/acs.jpcb.6b05905. [DOI] [PubMed] [Google Scholar]
- van Gunsteren W. F.; Daura X.; Hansen N.; Mark A. E.; Oostenbrink C.; Riniker S.; Smith L. J. Validation of molecular simulation: An overview of issues. Angew. Chem., Int. Ed. 2017, 57, 884. 10.1002/anie.201702945. [DOI] [PubMed] [Google Scholar]
- Lee I.; Athey B. D.; Wetzel A. W.; Meixner W.; Baker J. R. Structural molecular dynamics studies on polyamidoamine dendrimers for a therapeutic application: effects of pH and generation. Macromolecules 2002, 35, 4510–4520. 10.1021/ma010354q. [DOI] [Google Scholar]
- Han M.; Chen P.; Yang X. Molecular dynamics simulation of PAMAM dendrimer in aqueous solution. Polymer 2005, 46, 3481–3488. 10.1016/j.polymer.2005.02.107. [DOI] [Google Scholar]
- Maiti P. K.; Messina R. Counterion distribution and ζ-potential in PAMAM dendrimer. Macromolecules 2008, 41, 5002–5006. 10.1021/ma7025435. [DOI] [Google Scholar]
- Barra P. A.; Barraza L.; Jiménez V. A.; Gavín J. A.; Alderete J. B. Complexation of Mefenamic Acid by Low-Generation PAMAM Dendrimers: Insight from NMR Spectroscopy Studies and Molecular Dynamics Simulations. Macromol. Chem. Phys. 2014, 215, 372–383. 10.1002/macp.201300398. [DOI] [Google Scholar]
- Ficici E.; Andricioaei I.; Howorka S. Dendrimers in nanoscale confinement: the interplay between conformational change and nanopore entrance. Nano Lett. 2015, 15, 4822–4828. 10.1021/acs.nanolett.5b01960. [DOI] [PubMed] [Google Scholar]
- Mallamace F.; Lesieur P.; Lombardo D.; Micali N.; MonsuScolaro L.; Romeo A.; Romeo E.. Trends in Colloid and Interface Science XIII. Progress in Colloid and Polymer Science; Težak D., Martinis M., Eds.; Springer: Berlin, Heidelberg, 1999; Vol. 112, pp 152–156. [Google Scholar]
- Rathgeber S.; Pakula T.; Urban V. Structure of star-burst dendrimers: A comparison between small angle x-ray scattering and computer simulation results. J. Chem. Phys. 2004, 121, 3840–3853. 10.1063/1.1768516. [DOI] [PubMed] [Google Scholar]
- Jiménez V. A.; Gavín J. A.; Alderete J. B. Scaling trend in diffusion coefficients of low generation G0–G3 PAMAM dendrimers in aqueous solution at high and neutral pH. Struct. Chem. 2012, 23, 123–128. 10.1007/s11224-011-9844-6. [DOI] [Google Scholar]
- Rubinstein M.; Colby R.. Polymer Physics; Oxford University Press: New York, 2003; p 456. [Google Scholar]
- Knecht V.; Klasczyk B. Specific binding of chloride ions to lipid vesicles and implications at molecular scale. Biochem. J. 2013, 104, 818. 10.1016/j.bpj.2012.12.056. [DOI] [PMC free article] [PubMed] [Google Scholar]
- Venable R. M.; Luo Y.; Gawrisch K.; Roux B.; Pastor R. W. Simulations of anionic lipid membranes: Development of interaction-specific ion parameters and validation using NMR data. J. Phys. Chem. B 2013, 117, 10183–10192. 10.1021/jp401512z. [DOI] [PMC free article] [PubMed] [Google Scholar]
- Machuqueiro M.; Baptista A. M. The pH-Dependent Conformational States of Kyotorphin: A Constant-pH Molecular Dynamics Study. Biochem. J. 2007, 92, 1836–1845. 10.1529/biophysj.106.092445. [DOI] [PMC free article] [PubMed] [Google Scholar]
- Machuqueiro M.; Baptista A. M. Acidic range titration of HEWL using a constant-pH molecular dynamics method. Proteins: Struct., Funct., Bioinf. 2008, 72, 289–298. 10.1002/prot.21923. [DOI] [PubMed] [Google Scholar]
- Machuqueiro M.; Baptista A. M. Molecular Dynamics Constant-pH and Reduction Potential: Application to Cytochrome c3. J. Am. Chem. Soc. 2009, 131, 12586–12594. 10.1021/ja808463e. [DOI] [PubMed] [Google Scholar]
- Campos S. R. R.; Machuqueiro M.; Baptista A. M. Constant-pH molecular dynamics simulations reveal a β-rich form of the human prion protein. J. Phys. Chem. B 2010, 114, 12692–12700. 10.1021/jp104753t. [DOI] [PubMed] [Google Scholar]
- Machuqueiro M.; Baptista A. M. Is the prediction of pKa values by constant-pH molecular dynamics being hindered by inherited problems?. Proteins 2011, 79, 3437–3447. 10.1002/prot.23115. [DOI] [PubMed] [Google Scholar]
- Vila-Viçosa D.; Campos S. R. R.; Baptista A. M.; Machuqueiro M. Reversibility of prion misfolding: insights from constant-pH molecular dynamics simulations. J. Phys. Chem. B 2012, 116, 8812–8821. 10.1021/jp3034837. [DOI] [PubMed] [Google Scholar]
- Henriques J.; Costa P. J.; Calhorda M. J.; Machuqueiro M. Charge Parametrization of the DvH-c3 Heme Group: Validation Using Constant-(pH,E) Molecular Dynamics Simulations. J. Phys. Chem. B 2013, 117, 70–82. 10.1021/jp3082134. [DOI] [PubMed] [Google Scholar]
- Carvalheda C. A.; Campos S. R. R.; Machuqueiro M.; Baptista A. M. Structural Effects of pH and Deacylation on Surfactant Protein C in an Organic Solvent Mixture: A Constant-pH MD Study. J. Chem. Inf. Model. 2013, 53, 2979–2989. 10.1021/ci400479c. [DOI] [PubMed] [Google Scholar]
- Vila-Viçosa D.; Teixeira V. H.; Santos H. A. F.; Machuqueiro M. Conformational study of GSH and GSSG using constant-pH molecular dynamics simulations. J. Phys. Chem. B 2013, 117, 7507–7517. 10.1021/jp401066v. [DOI] [PubMed] [Google Scholar]
- Vila-Viçosa D.; Francesconi O.; Machuqueiro M. Why a diaminopyrrolic tripodal receptor binds mannosides in acetonitrile but not in water?. Beilstein J. Org. Chem. 2014, 10, 1513–1523. 10.3762/bjoc.10.156. [DOI] [PMC free article] [PubMed] [Google Scholar]
- Magalhães P. R.; Machuqueiro M.; Baptista A. M. Constant-pH Molecular Dynamics Study of Kyotorphin in an Explicit Bilayer. Biophys. J. 2015, 108, 2282–2290. 10.1016/j.bpj.2015.03.052. [DOI] [PMC free article] [PubMed] [Google Scholar]
- Vila-Viçosa D.; Teixeira V. H.; Baptista A. M.; Machuqueiro M. Constant-pH MD simulations of an oleic acid bilayer. J. Chem. Theory Comput. 2015, 11, 2367–2376. 10.1021/acs.jctc.5b00095. [DOI] [PubMed] [Google Scholar]
- Bayly C.; Cieplak P.; Cornell W.; Kollman P. A Well Behaved Electrostatic Based Method Using Charge Restraints For Deriving Atomic Charges: The RESP Model. J. Phys. Chem. 1993, 97, 10269–10280. 10.1021/j100142a004. [DOI] [Google Scholar]
- Frisch M. J.; et al. Gaussian 09, Revision C.01; Gaussian, Inc.: Wallingford, CT, 2009.
- Becke A. D. Density-functional thermochemistry. III. The role of exact exchange. J. Chem. Phys. 1993, 98, 5648–5652. 10.1063/1.464913. [DOI] [Google Scholar]
- Stephens P. J.; Devlin F. J.; Chabalowski C. F.; Frisch M. J. Ab initio calculation of vibrational absorption and circular dichroism spectra using density functional force fields. J. Phys. Chem. 1994, 98, 11623–11627. 10.1021/j100096a001. [DOI] [Google Scholar]
- Lee C.; Yang W.; Parr R. G. Development of the Colle-Salvetti correlation-energy formula into a functional of the electron density. Phys. Rev. B: Condens. Matter Mater. Phys. 1988, 37, 785–789. 10.1103/physrevb.37.785. [DOI] [PubMed] [Google Scholar]
- Hariharan P. C.; Pople J. A. The influence of polarization functions on molecular orbital hydrogenation energies. Theor. Chim. Acta 1973, 28, 213–222. 10.1007/bf00533485. [DOI] [Google Scholar]
- Albert A.; Serjeant E. P.. The Determination of Ionization Constants, 3rd ed.; Chapman and Hall: 733 Third Avenue, New York, 1984; p 151. [Google Scholar]
- Schmid N.; Eichenberger A. P.; Choutko A.; Riniker S.; Winger M.; Mark A. E.; Van Gunsteren W. F. Definition and testing of the GROMOS force-field versions 54A7 and 54B7. Eur. Biophys. J. 2011, 40, 843–856. 10.1007/s00249-011-0700-9. [DOI] [PubMed] [Google Scholar]
- Hess B.; Kutzner C.; van der Spoel D.; Lindahl E. GROMACS 4: Algorithms for Highly Efficient, Load-Balanced, and Scalable Molecular Simulation. J. Chem. Theory Comput. 2008, 4, 435–447. 10.1021/ct700301q. [DOI] [PubMed] [Google Scholar]
- Hermans J.; Berendsen H. J. C.; van Gunsteren W. F.; Postma J. P. M. A Consistent Empirical Potential for Water-Protein Interactions. Biopolymers 1984, 23, 1513–1518. 10.1002/bip.360230807. [DOI] [Google Scholar]
- Smith P. E.; van Gunsteren W. F. Consistent dielectric properties of the simple point charge and extended point charge water models at 277 and 300 K. J. Chem. Phys. 1994, 100, 3169–3174. 10.1063/1.466407. [DOI] [Google Scholar]
- Bussi G.; Donadio D.; Parrinello M. Canonical sampling through velocity rescaling. J. Chem. Phys. 2007, 126, 014101. 10.1063/1.2408420. [DOI] [PubMed] [Google Scholar]
- Parrinello M.; Rahman A. Polymorphic transitions in single crystals: A new molecular dynamics method. J. Appl. Phys. 1981, 52, 7182–7190. 10.1063/1.328693. [DOI] [Google Scholar]
- Hess B. P-LINCS: A Parallel Linear Constraint Solver for Molecular Simulation. J. Chem. Theory Comput. 2008, 4, 116–122. 10.1021/ct700200b. [DOI] [PubMed] [Google Scholar]
- Miyamoto S.; Kollman P. SETTLE: An analytical version of the SHAKE and RATTLE algorithm for rigid water models. J. Comput. Chem. 1992, 13, 952–962. 10.1002/jcc.540130805. [DOI] [Google Scholar]
- Rocchia W.; Sridharan S.; Nicholls A.; Alexov E.; Chiabrera A.; Honig B. Rapid grid-based construction of the molecular surface and the use of induced surface charge to calculate reaction field energies: Applications to the molecular systems and geometric objects. J. Comput. Chem. 2002, 23, 128–137. 10.1002/jcc.1161. [DOI] [PubMed] [Google Scholar]
- Teixeira V. H.; Cunha C. C.; Machuqueiro M.; Oliveira A. S. F.; Victor B. L.; Soares C. M.; Baptista A. M. On the Use of Different Dielectric Constants for Computing Individual and Pairwise Terms in Poisson-Boltzmann Studies of Protein Ionization Equilibrium. J. Phys. Chem. B 2005, 109, 14691–14706. 10.1021/jp052259f. [DOI] [PubMed] [Google Scholar]
- Gilson M. K.; Sharp K. A.; Honig B. H. Calculating the Electrostatic Potential of Molecules in Solution: Method and Error Assessment. J. Comput. Chem. 1988, 9, 327–335. 10.1002/jcc.540090407. [DOI] [Google Scholar]
- Baptista A. M.; Soares C. M. Some Theoretical and Computational Aspects of the Inclusion of Proton Isomerism in the Protonation Equilibrium of Proteins. J. Phys. Chem. B 2001, 105, 293–309. 10.1021/jp002763e. [DOI] [Google Scholar]
- Metropolis N.; Rosenbluth A. W.; Rosenbluth M. N.; Teller A. H.; Teller E. Equation of state calculations by fast computing machines. J. Chem. Phys. 1953, 21, 1087–1092. 10.1063/1.1699114. [DOI] [Google Scholar]
- Jeffrey G. A.An Introduction to Hydrogen Bonding; Oxford University Press: New York, 1997; pp 261–298, includes bibliographical references and index. [Google Scholar]
- Schrödinger, LLC . PyMOL The PyMOL Molecular Graphics System, Version 1.7.
Associated Data
This section collects any data citations, data availability statements, or supplementary materials included in this article.


