Abstract
Hospital-acquired infections can cause serious complications and are a severe problem because of the increased emergence of antibiotic-resistant bacteria. Biophysical modification of the material surfaces to prevent or reduce bacteria adhesion is an attractive alternative to antibiotic treatment. Since stainless steel is a widely used material for implants and in hospital settings, in this work, we used stainless steel to investigate the effect of the material surface topographies on bacterial adhesion and early biofilm formation. Stainless steel samples with different surface roughnesses Rq in a range of 217.9–56.6 nm (Ra in a range of 172.5–45.2 nm) were fabricated via electropolishing and compared for adhesion of bacterial pathogens Pseudomonas aeruginosa and Staphylococcus aureus. It was found that the number of viable cells on the untreated rough surface was at least 10-fold lower than those on the electropolished surfaces after 4 h of incubation time for P. aeruginosa and 15-fold lower for S. aureus. Fluorescence images and scanning electron microscopy images revealed that the bacterial cells tend to adhere individually as single cells on untreated rough surfaces. In contrast, clusters of the bacterial cells (microcolonies) were observed on electropolished smooth surfaces. Our study demonstrates that nanoscale surface roughness can play an important role in restraining bacterial adhesion and formation of microcolonies.
1. Introduction
Bacterial adhesion and biofilm formation on material surfaces can cause severe health problems as they often lead to microbial contamination and chronic infections.1,2 Up to date, several approaches using various alloy compositions and antibacterial coatings have been developed to control the bacterial adhesion and viability on surfaces.3−6 However, administration of antibacterial agents may cause antimicrobial resistance problems. In the past decade, the influence of surface topographies has attracted much attention as micro/nanoscale structures exhibited antiadhesion properties or direct contact killing of microbes.7−19 The study of microbial retention on micro/nanoscale surface textures provides bases for further development of novel antimicrobial surfaces.
Stainless steel is an iron-based alloy containing at least 10.5% Cr with numerous alloying elements that improve the mechanical and corrosion properties. Surface textures of grooves and ridges are normally produced using a mechanical wet-grinding process. Smoother surfaces can be obtained by subsequent electropolishing treatment. The polished stainless steel is widely used for hospital furniture, equipment, and devices, as well as for implants such as osteosynthesis screws and plates, intramedullary nails, and external fixation devices.20 A number of studies have been carried out to investigate the influence of the surface roughness of stainless steel on the bacterial adhesion and the conclusions however remain inconsistent. Some work demonstrated no direct correlation between surface roughness and the adhesion of bacteria or spores,21−26 whereas others showed a positive correlation between bacterial adhesion and the surface roughness,27−29 for example, some observed significantly fewer bacterial cells adhering on electropolished smooth surfaces.30−32 It was also reported that the adhesion of bacteria was minimal at roughness Ra of 160 nm in a study in which five types of surface finishes corresponding to roughness values Ra between 30 and 890 nm were compared.33 These discrepancies underline that it is important to investigate and understand the topographic effect of stainless steel surfaces on bacterial adhesion properties.
In this work, stainless steel samples with surface roughness Rq values varying from 217.9 to 56.6 nm (Ra in a range of 172.5–45.2 nm) were prepared and compared for their properties of binding bacterial cells. Pseudomonas aeruginosa, a Gram-negative bacterial strain, and Staphylococcus aureus, a Gram-positive bacterial strain, were taken as the model bacteria. Viable cells were quantified on untreated and electropolished stainless steel surfaces. Furthermore, fluorescence microscopy and scanning electron microscopy (SEM) were applied to investigate the morphology of the adhered cells. The obtained images revealed that the nanoscale surface topographies restrain bacterial adhesion and formation of microcolonies.
2. Experimental Section
2.1. Preparation of Stainless Steel Samples
The stainless steel sheet (4N Wet ground finishes, Outokumpu Tornio Works, 2012) was cut by a laser processing machine to obtain circular coupons of 18 mm in diameter and 1 mm in thickness. The coupons were first cleaned in an ultrasonic bath (KKS Ultraschall AG, Switzerland) containing a solution made of 10% (v/v) cleaner KKS 219-5000 for 15 min at 27 kHz and 50–70 °C, followed by 3 min at 27 kHz and 45–55 °C in a mixture consisting of 4% (v/v) cleaner KKS 180-7136 and 1% (v/v) cleaner KKS 180-7415 to remove adhesive residues.34 The coupons were then fixed by a clamping system for electropolishing process. The coupons were taken as the anode and chrome–nickel steel as the cathode in electropolishing electrolyte ElpoLux TM (ElpoChem AG). The stainless steel substrates were electropolished for various time periods of 20, 60, 120, and 240 s at a voltage of 7 V. The coupons were then neutralized in the cleaning bath containing 4% (v/v) cleaner KKS 180-7136 and 1% (v/v) cleaner KKS 180-7415 at 45–55 °C.
The electropolished and nonelectropolished coupons were subjected to a final cleaning in the ultrasonic bath containing cleaner KKS 180-7026 at 80 kHz and 45–55 °C for 2 min. This treatment was repeated twice. Finally, the coupons were rinsed with deionized (DI) water, dried in an oven at 90–120 °C for 15 min, and stored individually in blister containers in a vacuum package until usage, with the ground side facing up.
Before the bacterial adhesion experiment, the samples were sterilized in 12-well microplates filled with 70% ethanol. After 5 min incubation, ethanol was removed by aspirating the liquid and the samples were rinsed by DI water and dried in air.
2.2. Chemical Reagents
All chemicals and reagents were purchased from Sigma-Aldrich (Buchs, Switzerland), if not mentioned otherwise. The cleaners for coupon treatment were purchased from KKS Ultraschall AG, Switzerland.
2.3. SEM and Atomic Force Microscopy
SEM images were taken using a field-emission scanning electron microscope (Zeiss LEO 1550) at 1 kV under 20k, 30k, and 50k magnifications at stage angles of 0° and 30°. Atomic force microscopy (AFM) images were taken by using a Nanosurf Flex-Axiom setup with tip of Tap190Al-G.
2.4. Surface Characterization by X-ray Photoelectron Spectroscopy
X-ray Photoelectron Spectroscopy (XPS) measurements were performed with scanning XPS microprobe (PHI VersaProbe II spectrometer, Physical Electronics) using monochromatic Al Kα radiation (1486.6 eV) and a takeoff angle of 45° (with respect to the surface plane) as described previously.35 The operating pressure of the analysis chamber was below 5 × 10⁻⁷ Pa during the measurements. Two sets of independently prepared samples were analyzed. Areas, each of 800 μm × 800 μm size, were randomly chosen on each sample and analyzed using a microfocused, scanned X-ray beam with a diameter of 100 μm (operated at a power of 25 W at 15 kV). Survey scan spectra (0–1100 eV) were acquired with an energy step width of 0.8 eV, an acquisition time of 20 ms per data point, and a pass energy of 187 eV.
2.5. Surface Hydrophobicity
Using the drop shape analyzer DSA25E (Krüss GmbH, Hamburg, Germany), the surface hydrophobicity was assessed by measuring the contact angle between the samples and a drop of DI water or diiodomethane. Two independent experiments with two sets of independently prepared samples were performed. For each sample, three drops were measured.
2.6. Zeta Potential Measurement
Surface zeta potential of the stainless steel samples was measured using Nano ZSP (Malvern Instruments) with a surface zeta potential dip cell (ZEN1020). The samples were cut into a size of 2 × 3 × 1 mm3 (L × W × H), and the zeta potential was measured according to the manufacturer instruction and previously described procedure.36 For calibration, 25 mL of a solution was prepared by diluting 2.5 μL of micromer PEGylated polystyrene particles (micromod Partikeltechnologie GmbH, monodispersed, Germany, size of the particles: 1 μm; initial particle concentration: 50 mg/mL) in a phosphate buffer solution. The final solution had a concentration of 5 μg/mL at a pH of 7.0.
2.7. Quantification of Bacterial Viability
S. aureus (DSMZ 20231) and P. aeruginosa (DSMZ 1117) were used in this work. Bacteria from glycerol stocks were cultivated on Tryptic Soy Agar plates. A single colony was transferred to 10 mL of culture medium containing 30% Tryptic Soy Broth (TSB) and 0.25% glucose and incubated overnight at 37 °C and 160 rpm. Overnight culture (1 mL) was added to 10 mL of fresh TSB and incubated until it had reached the exponential growth phase, which took about 2 h. Bacterial cells were then diluted with 0.9% NaCl to approximate 105 CFU/mL. The suspension (400 μL), which covered the entire area of the surfaces, was loaded onto the stainless steel coupon surfaces and incubated at room temperature for 0, 4, and 24 h without shaking. The cell suspension was removed by aspirating the liquid and the coupon samples were washed three times with 2 mL of phosphate-buffered saline (PBS) each to remove nonadhered cells. To release the adhered cells from the coupons for viable cell quantification, the coupons were placed into a 50 mL Falcon tube containing 2.5 mL of PBS and sonicated for 5 min in a sonication water bath (Bransonic 52, Branson Ultrasonics SA, Carouge, Switzerland) at a frequency of 40 kHz and room temperature, followed by further vortexing for 15 s. The suspension was then removed and the number of viable cells in the suspension was evaluated by the classical colony counting method.37 Two independent experiments with three repeats per sample in each experiment were performed.
In parallel, to analyze the adhered bacteria on the coupon surfaces, the PBS-washed coupons were analyzed with microscopy as described below.
2.8. Analysis of Bacterial Adhesion Using Fluorescence Microscopy
A mixture of 5 μM SYTO9 (Life technologies) and 45 μM propidium iodide (PI) in DI water was freshly prepared and used to stain bacterial cells as described previously.38 The mixture (400 μL) was added to the top of the washed sample placed in a microplate well, and the plate was incubated for 30 min at room temperature in the dark. The staining mixture was removed and the wells with samples were washed three times with 2 mL of ddH2O. The samples were then analyzed by fluorescence microscopy (Leica DM6000B). For SYTO9, excitation at 488 nm was used; the emission was observed at 528 nm, and PI staining was monitored at excitation at 535 nm and the emission at 590 nm. For each sample, three images were taken at three fixed locations to obtain a statistical overview. Two independent experiments with three technical repeats of each sample per experiment were performed.
2.9. Derjaguin−Landau−Verwey−Overbeek/ Extended Derjagui−Landau−Verwey−Overbeek Model
The classical Derjaguin−Landau−Verwey−Overbeek (DLVO) and extended Derjaguin−Landau−Verwey−Overbeek (XDLVO) theories are recently used to estimate the total free energy of interaction between a bacterium and a flat material surface immersed in aqueous medium.49 The total free energy of interaction between a bacterium and a flat substrate immersed in an aqueous medium is the sum of the attractive Lifshitz van der Waals energy, the repulsive electrostatic double-layer interaction energy, and the Lewis acid–base interaction energy. The total interaction energy as a function of the separation distance can be calculated by using Derjaguin approximation. Adhesion between two interacting surfaces occurs when the total energy is negative, and repulsion occurs when the total energy is positive. The details of the model are provided in the Supporting Information S3.
3. Results and Discussion
3.1. Characterization of Surface Properties of Stainless Steel Samples
3.1.1. Surface Roughness
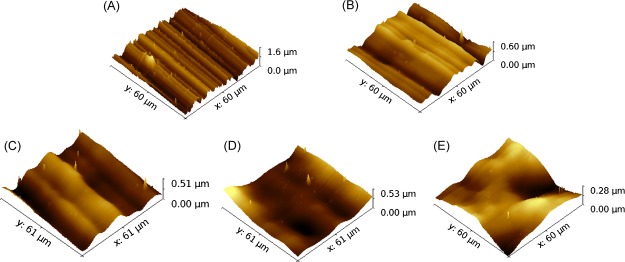
The AFM images of the stainless steel samples are shown in Figure 1. The topographical profiles extracted from the AFM images are compared in the Supporting Information Figure S1. An untreated surface exhibits aligned random alternating micro/nanoscale grooves and ridges (Figure 1A). Typical grooves have peak-to-peak distance and depth varying from tens of nanometers to several micrometers, with the surface average roughness Ra of 172.5 nm and root-mean-square roughness Rq of 217.9 nm. Smoother surfaces were obtained after treatment of electropolishing for 20, 60, 120, and 240 s (Figure 1B–E). Shallow grooves can still be observed after 20 s of electropolishing, with the surface roughness Ra = 82.4 nm and root-mean-square roughness Rq = 101.6 nm. After electropolishing for 120 s, no obvious grooves or ridges were observed on the sample surface. The average roughness (Ra) and the root-mean-square roughness (Rq) for the five types of stainless steel surfaces are summarized in Table 1.
Figure 1.
AFM micrographs of untreated and electropolished stainless steel surfaces: (A) untreated surface; (B) electropolished surface for 20 s; (C) electropolished surface for 60 s; (D) electropolished surface for 120 s; and (E) electropolished surface for 240 s.
Table 1. Characterization of Surface Properties of Stainless Steels.
| sample type | roughness (nm) Ra, Rq | contact angle (°) θw⊥w∥, θ | contact angle (°) θmi⊥mi∥, θ | solid fraction Φ | zeta potential (mV) | P.a. viable cells (CFU/mL)a | S.a. viable cells (CFU/mL)a |
|---|---|---|---|---|---|---|---|
| P0s | 172.5, 217.9 | 77.1, 101.7 | 42.3, 85.8 | 0.67 | –40.0 | 4.4 × 10² | 3.1 × 10² |
| P20s | 82.4, 101.6 | 83.2, 85.8 | 46.2, 47.9 | 0.90 | –35.7 | 5.1 × 10³ | 9.3 × 10³ |
| P60s | 68.8, 83.1 | 80.8, 79.7 | 47.3, 48.0 | 0.99 | –51.8 | 7.4 × 10³ | 1.7 × 10⁴ |
| P120s | 60.5, 80.7 | 81.2, 79.5 | 47.5, 48.0 | 0.99 | –40.1 | 3.7 × 10³ | 5.2 × 10³ |
| P240s | 45.2, 56.6 | 80.4, 78.8 | 47.4, 47.4 | 1.00 | –46.8 | 5.8 × 10³ | 1.9 × 10⁴ |
Adhered viable cells after incubation of 4 h; P.a.: P. aeruginosa; S.a.: S. aureus.
3.1.2. Surface Chemistry Measured by XPS
XPS data of the five stainless steel surface types are provided in the Supporting Information Table S1. After electropolishing for 20 s, the content of oxygen increases from 30 to 47%. Meanwhile, the content of carbon decreases from 61 to 41%. The reasons for the changes are likely due to the removal of hydrocarbon contamination and possible oxidation in the process of electropolishing. There are no significant differences in element composition between surfaces with electropolishing times from 20 to 240 s. These results showed that electropolishing did not introduce contamination to the metal surfaces, which could have possibly influenced bacterial adhesion.
3.1.3. Surface Hydrophobicity
The contact angle measurement was conducted using DI water and diiodomethane to measure the surface hydrophobicity. Interestingly, the contact angle is anisotropic depending on the orientation of the grooves on rough surfaces. As shown in Figure 2, on untreated surface with highest roughness values, the contact angle of water measured perpendicular to the grooves is 77.1° ± 3.5°, exhibiting hydrophilic properties. In contrast, the contact angle measured in parallel to the grooves is 101.7° ± 1.9°, exhibiting hydrophobic properties. The liquid drops tend to spread along the grooves, as wetting across the high ridges requires more energy. The anisotropy of contact angle is not present on smoother surfaces. As shown in Figure 2, after electropolishing for 60 s, there is almost no difference in contact angle measured in parallel or perpendicular to the grooves. Taking the average contact angle measured on the surfaces of 60, 120, and 240 s electropolished samples, the surface energy of 26.9 mJ/m2 for stainless steel was calculated based on the Owens–Wendt–Rabel–Kaelble model.39 The contact angle data are summarized in Table 1.
Figure 2.
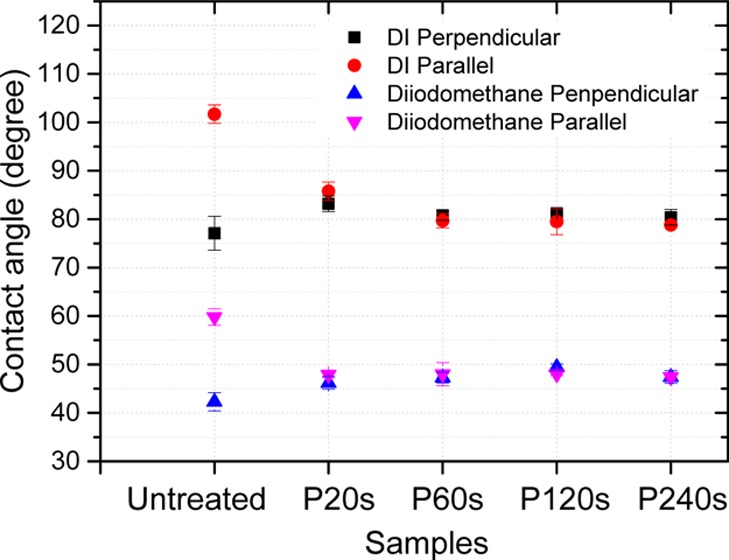
Contact angle measured for different stainless steel surfaces using DI water and diiodomethane in the direction parallel and perpendicular to the surface groove textures. P20s, P60s, P120s, and P240s: surfaces electropolished for 20, 60, 120, and 240 s, respectively. N = 6.
There are two different models that describe the wetting of rough, nanostructured surfaces. In the Wenzel model, the liquid completely penetrates into the nanostructures. The homogeneous wetting on nanostructures further reduces the contact angle for a hydrophilic surface and further increases the contact angle for a hydrophilic surface; in the Cassie model, there is air trapped under the liquid in the nanostructure. The heterogeneous wetting may lead to the apparent contact angle larger than 90° for a hydrophilic surface. On the smooth surface of the stainless steel samples, the contact angle observed perpendicular to the groove structures is smaller than 90°, whereas on the rough surface, the contact angle becomes larger than 90°. Therefore, the Cassie model is considered in our case. The solid fraction Φ is shown in the Table 1 by taking the 240 s polished surface as the reference.
3.1.4. Surface Charge Measured by Zeta Potential
The zeta potential of the sample surfaces exhibit similar negative zeta potential between −47 and −35 mV (Table 1).
In summary, the characterization of the surface properties suggests that the major difference between untreated and electropolished surfaces is the surface topography. The directional wetting phenomenon on the rough surfaces is related to the surface micro/nanoscale structures and textures rather than the surface charge potential or chemical composition.
3.2. Comparison of Bacterial Adhesion on Nanorough and Smooth Surfaces
3.2.1. Viable Bacterial Cells Adhered on Stainless Steel Surfaces
By taking P. aeruginosa and S. aureus as the model bacteria, the adhered viable cells were quantified on rough and smooth surfaces after 0 and 4 h incubation time. In the case of initial culture (0 h), the number of viable cells was similar on all rough and smooth surfaces at 3 × 10⁴ CFU/mL for P. aeruginosa and 1.5 × 10⁴ CFU/mL for S. aureus (Figure 3). After 4 h incubation, the number of viable P. aeruginosa cells is reduced by a factor of more than 10 on untreated rough surfaces (4 × 10² CFU/mL) compared with the electropolished smoother surfaces [(4–7) × 103 CFU/mL] (Figure 3A). For S. aureus cells, the reduction factor is increased to be more than 15 on the untreated rough surface (3 × 10² CFU/mL) compared with the smooth surfaces (5 × 10³ to 2 × 10⁴ CFU/mL) (Figure 3B). The observations indicate that the rough surfaces efficiently decrease the number of viable bacteria at the early stage of biofilm formation.
Figure 3.
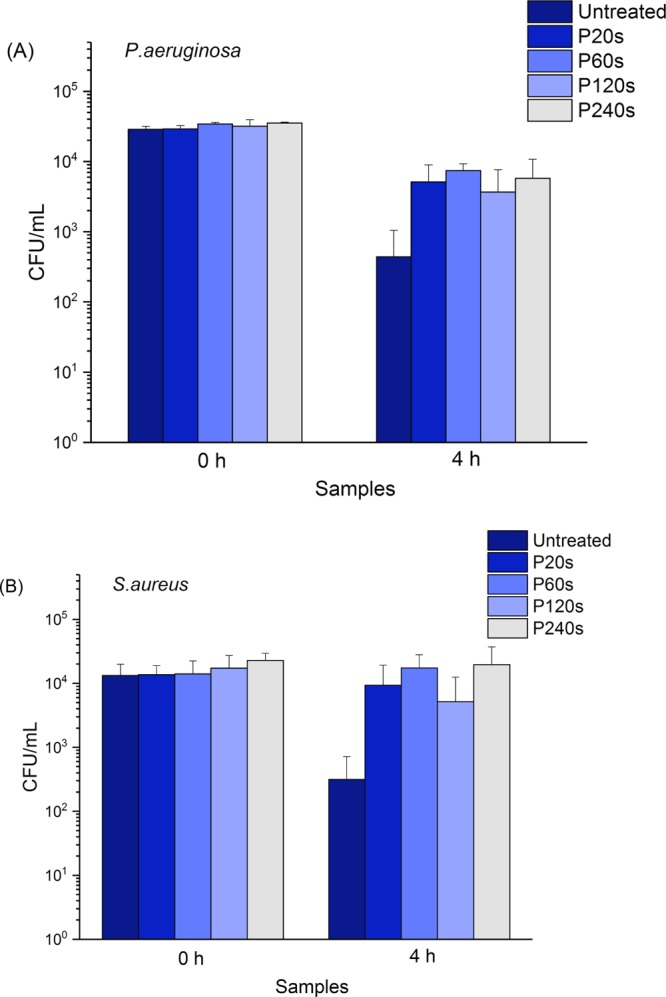
Viable cells of P. aeruginosa (A) and S. aureus (B) on different stainless steel surfaces after 0 and 4 h of incubation time. CFU: colony forming units; P20s, P60s, P120s, and P240s: surfaces electropolished for 20, 60, 120, and 240 s, respectively. N = 6.
3.2.2. Bacterial Retention and Cell Morphology on Stainless Steel Surfaces
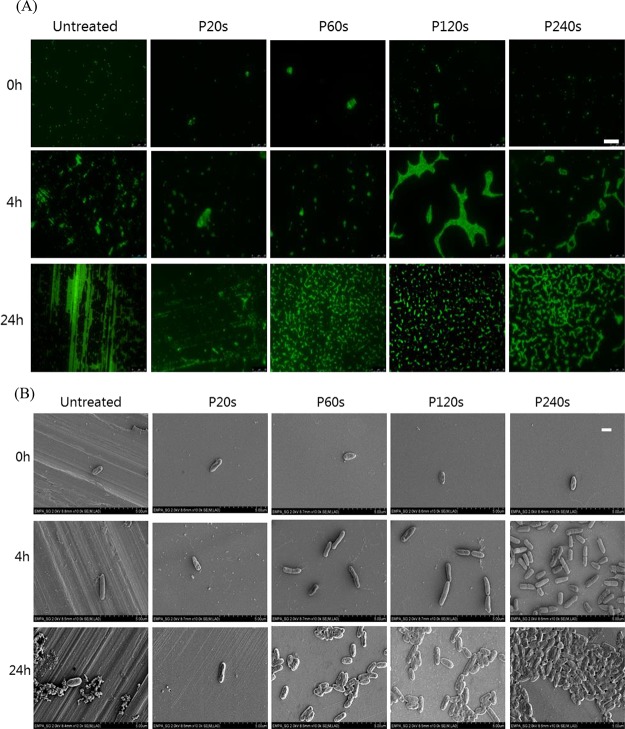
The retention of bacteria on stainless steel surfaces after incubation for 0, 4, and 24 h was analyzed by fluorescence microscopy and SEM imaging. On all tested surfaces, very few dead cells could be found (Figure S2). Therefore, the total number of cells (stained in green with Syto9) was considered here. For the P. aeruginosa strain, in the case of initial incubation (0 h), individual cells distributed on surfaces were observed for all samples as shown in Figure 4A. After 4 h incubation, cluster of cells started to form, especially on the 120 and 240 s electropolished smooth surfaces. After 24 h incubation, dense and homogeneously distributed microcolonies could be observed on 60, 120, and 240 s electropolished surfaces (Figure 4A). On the rough untreated surface, there were large amounts of fluorescent substances filling in the aligned grooves and also covering over the ridges. Although the amount of the fluorescent substances was much less on the surface electropolished for 20 s, such an aligned pattern along the longitudinal grooves was still distinguishable. SEM images in Figure 4B reveal that these fluorescent substances are likely to be extracellular polymeric substances (EPSs) secreted by the adhered P. aeruginosa cells. The SEM images also demonstrate the formation of cell microcolonies on smooth surfaces.
Figure 4.
Representative images of P. aeruginosa on different surfaces of stainless steel after 0, 4, and 24 h incubation time. (A) Fluorescence images after cells being stained with Syto9, scale bar: 25 μm and (B) SEM images, scale bar: 1 μm.
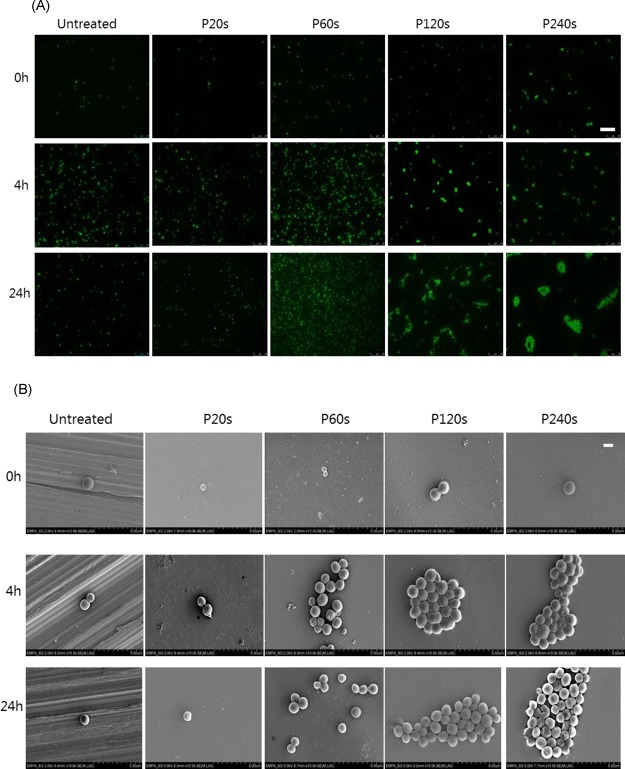
In the case of S. aureus shown in Figure 5, bacteria tended to adhere individually on untreated and 20 s electropolished surfaces even after 24 h of incubation. Clusters of bacterial cells were formed on smoother surfaces electropolished for 120 and 240 s after 4 h of incubation. These clusters of cells further developed into large microcolonies after 24 h incubation. In contrast to P. aeruginosa, no groove-guided proliferation pattern is observed for S. aureus (Figure 5A). A similar observation has been reported previously that S. aureus cells are scattered all over the microrough titanium surface in small clumps of two to four bacteria, whereas on the electropolished titanium and stainless steel surfaces, the bacteria were found to aggregate in large clumps.20
Figure 5.
Representative images of S. aureus on different surfaces of stainless steel after 0, 4, and 24 h of incubation time. (A) Fluorescence images after cells being stained with Syto9, scale bar: 25 μm and (B) SEM images, scale bar: 1 μm.
3.3. Theoretical Model Discussions on the Observed Bacterial Adhesion
Bacteria adhesion in a dispersed manner and then progressing to clustering (usually when cell signaling begins) to finally form microcolonies (clumps) are typical steps during biofilm formation.40,41 Even though many studies have been attempted to understand whether and how the surface topography can influence these steps,21−32 there is still no clear answer up to now. The adhesion and proliferation of bacteria on material surfaces have been found to be complex biological processes affected by numerous parameters including material composition, surface charge, and surface topography.13,42,43 In this work, the major difference between untreated and electropolished stainless steel surfaces is the surface topography as summarized in Table 1. We discuss here the effect of surface topographies of stainless steel on bacterial adhesion and early biofilm formation.
The interaction of a bacterial cell with a material surface was shown to follow the principle of colloidal physics described by the classical Derjaguin–Landau–Verwey–Overbeek (DLVO) theory,44,45 assuming that bacterial cells are homogenous sphere particles and the cell appendages are not considered. The total free energy between a surface and a particle is the sum of their Coulomb and van der Waals interactions. As bacteria and material surfaces in neutral aqueous solution are usually negatively charged, the electrostatic Coulomb interaction is normally repulsive. The Coulomb interaction is dependent on the ionic strength of the solution. This repulsive energy increases as the ionic strength decreases because there is less charge shielding effect of ions in the electrical double layer. The Debye length for a 0.9% NaCl solution at 15 mM ionic strength is 1.8 nm. It is generally considered that the region of varying potential extends to a distance of about three times of the Debye length before the potential has decayed to about 2% of its value at the surface. The competing attractive van der Waals force is short-ranged, which is dominant in the vicinity of a surface within several nanometers. Under these conditions, the total free energy leads to an energy barrier, which the bacterial cells cannot surmount by Brownian motion, and a shallow secondary energy minimum outside of the energy barrier.42 In the later extended DLVO (XDLVO) theory, the additional Lewis acid–base interaction energy was considered.46,47 This strong acid–base interaction leads to a decrease of the energy barrier and deeper secondary energy minimum. The distance dependence of acid–base interactions is also short-ranged. The calculations have shown that a distance between the interacting surfaces of less than 5 nm is required.48
On the basis of the DLVO theory, the bacterial cells initially reach the secondary energy minimum position by Brownian motion or motility. Afterward, the bacteria produce EPS or use nanofibers such as pili and flagella to adhere irreversibly on the surface. The bacteria adhere irreversibly even on negatively charged material surfaces, when they tend to get a close contact, and maximize the contact area with the material surface to gain total free energy. Experimentally, it has been reported that the bacteria retained preferably in the grain boundaries or aligned within the grooves of the stainless steel surface with the width comparable to the diameter of the bacterial cells.33
The total interaction free energy between a bacterial cell and the stainless steel surface using DLVO and XDLVO theories is shown in Figure 6. The parameters for the calculation are listed in the Supporting Information S3. The energy barrier is 83 kT calculated from the classical DLVO theory. This barrier height is reduced to be nearly half when additional Lewis acid–base interaction energy is considered. A shallow secondary energy minimum at several kT outside of the energy barrier is observed at distance 5–7 nm to the surface. The energy barrier appears at a distance smaller than 4 nm. Once the energy barrier is surmounted by the secretion of EPS or nanofibers such as pili and flagella, the bacteria adhere irreversibly on the surface.
Figure 6.
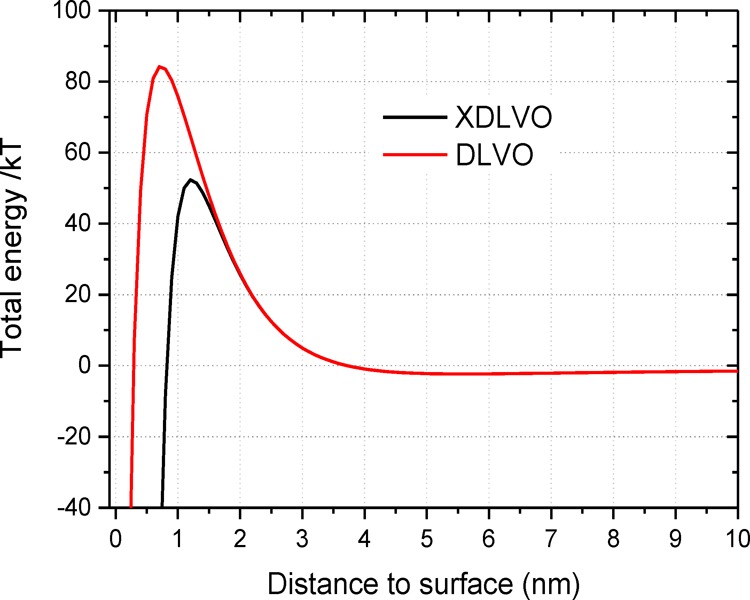
Total interaction free energy between a bacterial cell and the stainless steel surface based on DLVO and XDLVO theories.
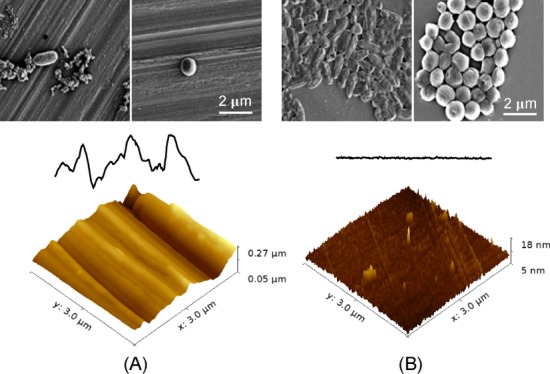
When the surface features reach nanoscale, the total surface area of the surface is increased, but the actual contact area of the material surface with the bacterial cell can either be increased or decreased depending on the topographical features of the nanostructures. The AFM images of the stainless steel surfaces at a scale of 3 μm are compared in the Supporting Information Figure S1. Grooves and trenches with depth larger than 30 nm and width smaller than 1 μm are only visible on the untreated surface. With the treatment of electropolishing, the surfaces become smooth with peak height less than 10 nm. The contact area and therefore the total free energy gain will increase on a surface with low roughness with low peak density and small peak height as sketched in Figure 7A. On a surface with high roughness, high peak density, and large peak height, as the widths of the grooves and trenches are smaller than the dimensions of the bacterial cells, the bacteria are actually suspended between the grooves rather than confined inside the groove cavities. The actual contact area between the bacterium and the surface will decrease as demonstrated in Figure 7B. As both the van der Waals and acid–base interactions are short-ranged (smaller than 5 nm), the total energy gain on a rough surface with large peak density and height will be orders of magnitude smaller. The effect of nanoscale surface roughness on the total interaction energy was recently described in a three-dimensional model, where the average height and peak density of surface structures were considered.49 Lower peak density contributes to larger total energy gain for average height structures below 70 nm, whereas for surfaces with average height structures larger than 150 nm, the energy gain is smaller and the peak density is of minor significance. According to the model, stronger bacterial adhesion should take place on the surfaces with low roughness and low peak density. Indeed, in our experiments, more than 10-fold viable cells were observed on electropolished surfaces after 4 h incubation.
Figure 7.
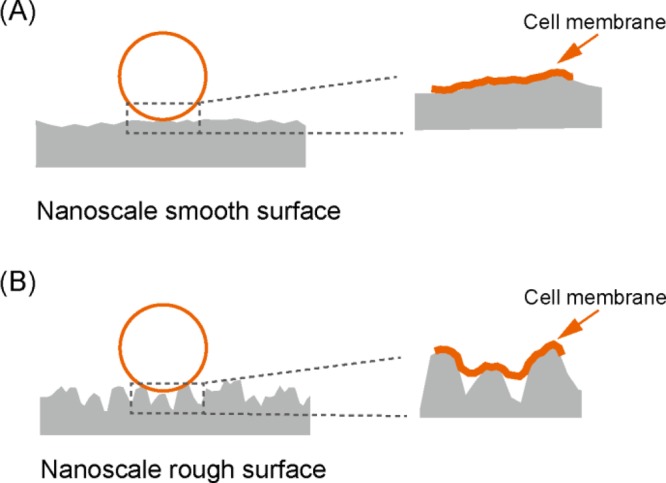
Schematic illustration of bacterial adhesion on nanoscale rough surface (A) and smooth surface (B). The cell membrane is deformed and elongated on the nanoscale rough surface topography.
The adhesion and proliferation of bacteria on material surfaces are divided into several steps. After initial adhesion, the irreversibly attached bacteria start to grow, divide, and form microcolonies. We have observed the least adhered bacteria on the rough surface with smallest solid fraction. The results indicate that the bacterial adhesion may also be reduced by less actual contact area due to trapped air in the cavities. The production of additional EPS helps strong binding and stabilization of the cells on the surface. This is obvious for P. aeruginosa, which is able to produce a significant amount of EPS on surfaces.50,51 It has been reported that the bacteria tend to maximize the contact area with nanoscale structures.52 The cells suspending on nanopillar arrays may cause the elongation of the cell membrane, leading even to cell rupture and death.53 On the nanoscale groove structures, the cell membrane is likely slightly deformed and elongated on the topography because of cell gravity and the energy gain by maximizing the contact area with substrate as illustrated in Figure 7. In our study, the bacteria adhered individually on the untreated rough surface, contrasting with clusters of bacterial cells on electropolished smooth surfaces. On nanoscale rough surfaces, the cell proliferation may be suppressed by the deformation of the cell membrane. After 24 h of incubation, clear clusters and microcolonies of S. aureus appeared on smooth surfaces of 120 and 240 s electropolished samples, whereas individually distributed cells were still visible on rough surfaces. For P. aeruginosa, microcolonies were formed on smooth surfaces already after 4 h incubation. It was reported recently that the morphology of the bacterial microcolonies was affected by the surface charge. Mushroom-like microcolonies with high levels of cyclic diguanylate were formed on negatively charged surfaces, which indicates increased production of matrix components such as EPS to develop biofilms.54 In our work, the development of early biofilm was clearly suppressed on rough surfaces. Our observations suggest that the nanoscale surface topographies may prohibit the proliferation of adhered bacteria at early stage.
4. Conclusions
In this work, we have studied the influence of micro/nanotopographies of stainless steel surfaces on bacterial adhesion and formation of early biofilm. In total, five types of surfaces with roughness Rq varying from 217.9 to 56.6 nm (Ra in a range of 172.5–45.2 nm) were compared for their properties of adhering bacterial cells and influencing cell proliferation. The surface structure of the untreated rough surface is multiscale. Large grooves are tens of micrometers wide and more than 500 nm deep. Nanoscale grooves and trenches have depth larger than 30 nm and width smaller than 1 μm. Qualitative and quantitative results of adhesion analysis on the different surfaces correlated with each other and showed significantly more bacterial cells on the electropolished smooth surfaces than on the untreated one after 4 h of incubation time. Interestingly, on untreated rough surfaces, the bacterial cells were scattered all over in small clumps, whereas on the electropolished smooth surfaces, the bacteria were found to clump in large clusters. Our observations demonstrate that the nanoscale surface topographies restrain bacterial adhesion and formation of microcolonies.
Acknowledgments
We thank Dr. Patrick Rupper for helping with XPS measurement, Dr. Marianne Vandenbossche for Zeta Potential analysis. S.W. acknowledges the research funding received from the Fundamental Research Funds for the Central Universities (grant number 2015RC052) and the National Natural Science Foundation of China (grant number 31600771).
Supporting Information Available
The Supporting Information is available free of charge on the ACS Publications website at DOI: 10.1021/acsomega.8b00769.
AFM images and topographical profiles for different stainless steel surfaces at the scale of 3 μm; XPS spectra of the stainless steel surfaces; live/dead staining of bacterial cells on stainless steel surfaces; and DLVO/XDLVO theory (PDF)
Author Contributions
∥ S.W. and S.A. contributed equally.
The authors declare no competing financial interest.
Supplementary Material
References
- Darouiche R. O. Device-associated infections: A macroproblem that starts with microadherence. Clin. Infect. Dis. 2001, 33, 1567–1572. 10.1086/323130. [DOI] [PubMed] [Google Scholar]
- Percival S. L.; Suleman L.; Vuotto C.; Donelli G. Healthcare-associated infections, medical devices and biofilms: risk, tolerance and control. J. Med. Microbiol. 2015, 64, 323–334. 10.1099/jmm.0.000032. [DOI] [PubMed] [Google Scholar]
- Monteiro D. R.; Gorup L. F.; Takamiya A. S.; Ruvollo-Filho A. C.; de Camargo E. R.; Barbosa D. B. The growing importance of materials that prevent microbial adhesion: antimicrobial effect of medical devices containing silver. Int. J. Antimicrob. Agents 2009, 34, 103–110. 10.1016/j.ijantimicag.2009.01.017. [DOI] [PubMed] [Google Scholar]
- Silvestry-Rodriguez N.; Sicairos-Ruelas E. E.; Gerba C. P.; Bright K. R.. Silver as a Disinfectant. Reviews of Environmental Contamination and Toxicology; Springer New York: New York, NY, 2007; pp 23–45. [DOI] [PMC free article] [PubMed] [Google Scholar]
- Kugel A.; Stafslien S.; Chisholm B. J. Antimicrobial coatings produced by “tethering” biocides to the coating matrix: A comprehensive review. Prog. Org. Coat. 2011, 72, 222–252. 10.1016/j.porgcoat.2011.07.004. [DOI] [Google Scholar]
- Abreu A. C.; Tavares R. R.; Borges A.; Mergulhão F.; Simões M. Current and emergent strategies for disinfection of hospital environments. J. Antimicrob. Chemother. 2013, 68, 2718–2732. 10.1093/jac/dkt281. [DOI] [PMC free article] [PubMed] [Google Scholar]
- Anselme K.; Davidson P.; Popa A. M.; Giazzon M.; Liley M.; Ploux L. The interaction of cells and bacteria with surfaces structured at the nanometre scale. Acta Biomater. 2010, 6, 3824–3846. 10.1016/j.actbio.2010.04.001. [DOI] [PubMed] [Google Scholar]
- Bixler G. D.; Bhushan B. Biofouling: lessons from nature. Philos. Trans. R. Soc., A 2012, 370, 2381–2417. 10.1098/rsta.2011.0502. [DOI] [PubMed] [Google Scholar]
- Graham M.; Cady N. Nano and Microscale Topographies for the Prevention of Bacterial Surface Fouling. Coatings 2014, 4, 37–59. 10.3390/coatings4010037. [DOI] [Google Scholar]
- Graham M. V.; Mosier A. P.; Kiehl T. R.; Kaloyeros A. E.; Cady N. C. Development of antifouling surfaces to reduce bacterial attachment. Soft Matter 2013, 9, 6235–6244. 10.1039/c3sm50584g. [DOI] [Google Scholar]
- Hasan J.; Chatterjee K. Recent advances in engineering topography mediated antibacterial surfaces. Nanoscale 2015, 7, 15568–15575. 10.1039/c5nr04156b. [DOI] [PMC free article] [PubMed] [Google Scholar]
- Nir S.; Reches M. Bio-inspired antifouling approaches: the quest towards non-toxic and non-biocidal materials. Curr. Opin. Biotechnol. 2016, 39, 48–55. 10.1016/j.copbio.2015.12.012. [DOI] [PubMed] [Google Scholar]
- Renner L. D.; Weibel D. B. Physicochemical regulation of biofilm formation. MRS Bull. 2011, 36, 347–355. 10.1557/mrs.2011.65. [DOI] [PMC free article] [PubMed] [Google Scholar]
- Scardino A. J.; de Nys R. Mini review: Biomimetic models and bioinspired surfaces for fouling control. Biofouling 2011, 27, 73–86. 10.1080/08927014.2010.536837. [DOI] [PubMed] [Google Scholar]
- Scardino A. J.; Hudleston D.; Peng Z.; Paul N. A.; de Nys R. Biomimetic characterisation of key surface parameters for the development of fouling resistant materials. Biofouling 2009, 25, 83–93. 10.1080/08927010802538480. [DOI] [PubMed] [Google Scholar]
- Hočevar M.; Jenko M.; Godec M.; Drobne D. An overview of the influence of stainless-steel surface properties on bacterial adhesion. Mater. Technol. 2014, 48, 609–617. [Google Scholar]
- Crawford R. J.; Webb H. K.; Truong V. K.; Hasan J.; Ivanova E. P. Surface topographical factors influencing bacterial attachment. Adv. Colloid Interface Sci. 2012, 179, 142–149. 10.1016/j.cis.2012.06.015. [DOI] [PubMed] [Google Scholar]
- Hsu L. C.; Fang J.; Borca-Tasciuc D. A.; Worobo R. W.; Moraru C. I. Effect of Micro- and Nanoscale Topography on the Adhesion of Bacterial Cells to Solid Surfaces. Appl. Environ. Microbiol. 2013, 79, 2703–2712. 10.1128/aem.03436-12. [DOI] [PMC free article] [PubMed] [Google Scholar]
- Elbourne A.; Crawford R. J.; Ivanova E. P. Nano-structured antimicrobial surfaces: From nature to synthetic analogues. J. Colloid Interface Sci. 2017, 508, 603. 10.1016/j.jcis.2017.07.021. [DOI] [PubMed] [Google Scholar]
- Harris L. G.; Meredith D. O.; Eschbach L.; Richards R. G. Staphylococcus aureus adhesion to standard micro-rough and electropolished implant materials. J. Mater. Sci.: Mater. Med. 2007, 18, 1151–1156. 10.1007/s10856-007-0143-0. [DOI] [PubMed] [Google Scholar]
- Jullien C.; Bénézech T.; Carpentier B.; Lebret V.; Faille C. Identification of surface characteristics relevant to the hygienic status of stainless steel for the food industry. J. Food Eng. 2003, 56, 77–87. 10.1016/s0260-8774(02)00150-4. [DOI] [Google Scholar]
- Ortega M. P.; Hagiwara T.; Watanabe H.; Sakiyama T. Adhesion behavior and removability of Escherichia coli on stainless steel surface. Food Control 2010, 21, 573–578. 10.1016/j.foodcont.2009.08.010. [DOI] [Google Scholar]
- Whitehead K. A.; Verran J. The effect of surface properties and application method on the retention of Pseudomonas aeruginosa on uncoated and titanium-coated stainless steel. Int. Biodeterior. Biodegrad. 2007, 60, 74–80. 10.1016/j.ibiod.2006.11.009. [DOI] [Google Scholar]
- Flint S. H.; Brooks J. D.; Bremer P. J. Properties of the stainless steel substrate, influencing the adhesion of thermo-resistant streptococci. J. Food Eng. 2000, 43, 235–242. 10.1016/s0260-8774(99)00157-0. [DOI] [Google Scholar]
- Boulangé-Petermann L.; Rault J.; Bellon-Fontaine M.-N. Adhesion of streptococcus thermophilus to stainless steel with different surface topography and roughness. Biofouling 1997, 11, 201–216. 10.1080/08927019709378331. [DOI] [Google Scholar]
- Hilbert L. R.; Bagge-Ravn D.; Kold J.; Gram L. Influence of surface roughness of stainless steel on microbial adhesion and corrosion resistance. Int. Biodeterior. Biodegrad. 2003, 52, 175–185. 10.1016/s0964-8305(03)00104-5. [DOI] [Google Scholar]
- Arnold J. W.; Bailey G. W. Surface finishes on stainless steel reduce bacterial attachment and early biofilm formation: scanning electron and atomic force microscopy study. Poult. Sci. 2000, 79, 1839–1845. 10.1093/ps/79.12.1839. [DOI] [PubMed] [Google Scholar]
- Arnold J. W.; Boothe D. H.; Bailey G. W. Parameters of treated stainless steel surfaces important for resistance to bacterial contamination. Trans. ASAE 2001, 44, 347. 10.13031/2013.4668. [DOI] [Google Scholar]
- Bohinc K.; Dražić G.; Abram A.; Jevšnik M.; Jeršek B.; Nipič D.; Kurinčič M.; Raspor P. Metal surface characteristics dictate bacterial adhesion capacity. Int. J. Adhes. Adhes. 2016, 68, 39–46. 10.1016/j.ijadhadh.2016.01.008. [DOI] [Google Scholar]
- Allion A.; Baron J.-P.; Boulange-Petermann L. Impact of surface energy and roughness on cell distribution and viability. Biofouling 2006, 22, 269–278. 10.1080/08927010600902789. [DOI] [PubMed] [Google Scholar]
- Bagherifard S.; Hickey D. J.; de Luca A. C.; Malheiro V. N.; Markaki A. E.; Guagliano M.; Webster T. J. The influence of nanostructured features on bacterial adhesion and bone cell functions on severely shot peened 316L stainless steel. Biomaterials 2015, 73, 185–197. 10.1016/j.biomaterials.2015.09.019. [DOI] [PubMed] [Google Scholar]
- Goulter-Thorsen R. M.; Taran E.; Gentle I. R.; Gobius K. S.; Dykes G. A. Surface roughness of stainless steel influences attachment and detachment of Escherichia coli O157. J. Food Prot. 2011, 74, 1359–1363. 10.4315/0362-028x.jfp-11-006. [DOI] [PubMed] [Google Scholar]
- Medilanski E.; Kaufmann K.; Wick L. Y.; Wanner O.; Harms H. Influence of the Surface Topography of Stainless Steel on Bacterial Adhesion. Biofouling 2002, 18, 193–203. 10.1080/08927010290011370. [DOI] [Google Scholar]
- Zwahlen A.; de Wild M.; Jung C.. Comparison of Methods for Testing Ultrasound in the Cleaning Bath. DAGA 2014, Oldenburg, 2014.
- Schmidt-Emrich S.; Stiefel P.; Rupper P.; Katzenmeier H.; Amberg C.; Maniura-Weber K.; Ren Q. Rapid Assay to Assess Bacterial Adhesion on Textiles. Materials 2016, 9, 249. 10.3390/ma9040249. [DOI] [PMC free article] [PubMed] [Google Scholar]
- Corbett J. C. W.; McNeil-Watson F.; Jack R. O.; Howarth M. Measuring surface zeta potential using phase analysis light scattering in a simple dip cell arrangement. Colloids Surf., A 2012, 396, 169–176. 10.1016/j.colsurfa.2011.12.065. [DOI] [Google Scholar]
- Sanders E. R. Aseptic Laboratory Techniques: Plating Methods. J. Vis. Exp. 2012, 63, e3064. 10.3791/3064. [DOI] [PMC free article] [PubMed] [Google Scholar]
- Stiefel P.; Schmidt-Emrich S.; Maniura-Weber K.; Ren Q. Critical aspects of using bacterial cell viability assays with the fluorophores SYTO9 and propidium iodide. BMC Microbiol. 2015, 15, 36. 10.1186/s12866-015-0376-x. [DOI] [PMC free article] [PubMed] [Google Scholar]
- Owens D. K.; Wendt R. C. Estimation of the surface free energy of polymers. J. Appl. Polym. Sci. 1969, 13, 1741–1747. 10.1002/app.1969.070130815. [DOI] [Google Scholar]
- de Medeiros Aires M.; Treter J.; Filho A. N.; Nascimento I. O.; Macedo A. J.; Alves C. Minimizing Pseudomonas aeruginosa adhesion to titanium surfaces by a plasma nitriding process. AIMS Biophys. 2016, 4, 19–32. 10.3934/biophy.2017.1.19. [DOI] [Google Scholar]
- Flemming H.-C.; Wingender J. The biofilm matrix. Nat. Rev. Microbiol. 2010, 8, 623–633. 10.1038/nrmicro2415. [DOI] [PubMed] [Google Scholar]
- Hori K.; Matsumoto S. Bacterial adhesion: From mechanism to control. Biochem. Eng. J. 2010, 48, 424–434. 10.1016/j.bej.2009.11.014. [DOI] [Google Scholar]
- Palmer J.; Flint S.; Brooks J. Bacterial cell attachment, the beginning of a biofilm. J. Ind. Microbiol. Biotechnol. 2007, 34, 577–588. 10.1007/s10295-007-0234-4. [DOI] [PubMed] [Google Scholar]
- Marshall K. C.; Stout R.; Mitchell R. Mechanism of the Initial Events in the Sorption of Marine Bacteria to Surfaces. Microbiology 1971, 68, 337–348. 10.1099/00221287-68-3-337. [DOI] [Google Scholar]
- Fitch R. M. Principles of colloid and surface chemistry, by Paul C. Hiemenz, Marcel Dekker, New York, 1977, 516 pp. No Price given. J. Polym. Sci. Polym. Lett. Ed. 1984, 22, 508–509. 10.1002/pol.1984.130220910. [DOI] [Google Scholar]
- Van Oss C. J. The forces involved in bioadhesion to flat surfaces and particles — Their determination and relative roles. Biofouling 1991, 4, 25–35. 10.1080/08927019109378192. [DOI] [Google Scholar]
- van Oss C. J.; Chaudhury M. K.; Good R. J. Monopolar surfaces. Adv. Colloid Interface Sci. 1987, 28, 35–64. 10.1016/0001-8686(87)80008-8. [DOI] [PubMed] [Google Scholar]
- Bos R.; van der Mei H. C.; Busscher H. J. Physico-chemistry of initial microbial adhesive interactions – its mechanisms and methods for study. FEMS Microbiol. Rev. 1999, 23, 179–230. 10.1111/j.1574-6976.1999.tb00396.x. [DOI] [PubMed] [Google Scholar]
- Siegismund D.; Undisz A.; Germerodt S.; Schuster S.; Rettenmayr M. Quantification of the interaction between biomaterial surfaces and bacteria by 3-D modeling. Acta Biomater. 2014, 10, 267–275. 10.1016/j.actbio.2013.09.016. [DOI] [PubMed] [Google Scholar]
- Myszka K.; Czaczyk K. Characterization of Adhesive Exopolysaccharide (EPS) Produced by Pseudomonas aeruginosa Under Starvation Conditions. Curr. Microbiol. 2009, 58, 541–546. 10.1007/s00284-009-9365-3. [DOI] [PubMed] [Google Scholar]
- Dunne W. M. Bacterial adhesion: Seen any good biofilms lately?. Clin. Microbiol. Rev. 2002, 15, 155. 10.1128/cmr.15.2.155-166.2002. [DOI] [PMC free article] [PubMed] [Google Scholar]
- Hochbaum A. I.; Aizenberg J. Bacteria Pattern Spontaneously on Periodic Nanostructure Arrays. Nano Lett. 2010, 10, 3717–3721. 10.1021/nl102290k. [DOI] [PubMed] [Google Scholar]
- Ivanova E. P.; Hasan J.; Webb H. K.; Truong V. K.; Watson G. S.; Watson J. A.; Baulin V. A.; Pogodin S.; Wang J. Y.; Tobin M. J.; Löbbe C.; Crawford R. J. Natural Bactericidal Surfaces: Mechanical Rupture of Pseudomonas aeruginosa Cells by Cicada Wings. Small 2012, 8, 2489–2494. 10.1002/smll.201200528. [DOI] [PubMed] [Google Scholar]
- Rzhepishevska O.; Hakobyan S.; Ruhal R.; Gautrot J.; Barbero D.; Ramstedt M. The surface charge of anti-bacterial coatings alters motility and biofilm architecture. Biomater. Sci. 2013, 1, 589–602. 10.1039/c3bm00197k. [DOI] [PubMed] [Google Scholar]
Associated Data
This section collects any data citations, data availability statements, or supplementary materials included in this article.


