Abstract
Nanoimaging methods, atomic force microscopy (AFM) in particular, are widely used to study the interaction of biological molecules with the supported lipid bilayer (SLB), which itself is a traditional model for cellular membranes. Success in these studies is based on the availability of a stable SLB for the required observation period, which can extend several hours. The application of AFM requires that the SLB have a smooth morphology, thus enabling visualization of proteins and other molecules on its surface. Herein, we describe protocols for SLB assembly by using 1-palmitoyl-2-oleoyl-sn-glycero-3-phosphocholine (POPC) and 1-palmitoyl-2-oleoyl-sn-glycero-3-phospho-L-serine (POPS) on a mica support. Our methodology enables us to assemble defect-free POPC and POPS SLBs that remain stable for at least 8 h. The application of such smooth and stable surfaces is illustrated by monitoring of the on-surface aggregation of amyloid proteins with the use of time-lapse AFM.
Keywords: Supported lipid bilayer, Nanoimaging, Atomic force microscope, Time-lapse imaging, Amyloid aggregation
1 Introduction
Cell membranes are essential components where various cellular processes take place and essentially act as the site of communication between the intra- and extracellular environments [1–4]. To understand cellular events that occur on the surfaces, researchers have developed many in vitro model systems to mimic the milieu of the cell, like bicelles [5], micelles [6], vesicles or liposomes [7], supported lipid bilayers (SLB), and planar lipid bilayers [8–10], among which SLBs have gained interest due to their relatively simple preparation and compatibility with a variety of surface-based techniques [10, 11].
Nanoimaging with atomic force microscope (AFM) allows researchers to directly monitor on-membrane events in a near-physiological environment. However, obtaining a stable, homogeneous, and relatively defect-free SLB surface is essential for any reliable experiments that mimic events on cell membranes. A smooth, relatively vesicle-free surface is also critical for probing the interaction of proteins or small molecules with the surface of the SLB. Herein, we describe methods for the preparation and characterization of SLB surfaces that meet these criteria by using the following lipids on a mica surface: 1-palmitoyl-2-oleoyl-sn-gly-cero-3-phosphocholine (POPC) and 1-palmitoyl-2-oleoyl-sn-gly-cero-3-phospho-L-serine (POPS). Notably, the tapping mode of AFM in buffer medium, where the tip gently scans the biological sample [12, 13], is used to directly characterize the topography and stability of the SLB surfaces. The results show that the homogenous, defect-free SLB surfaces constructed by using this technique remain stable for as long as 3 days, whereas SLB surfaces with small defects can be stable for at least 8 h. Time-lapse imaging was employed to visualize the in situ interaction of amyloid proteins with these SLB surfaces in real time.
2 Materials
2.1 Reagents for SLB Preparation
POPC and POPS: Both lipids were purchased from Avanti Polar Lipids Inc. (Alabaster, Alabama, USA). POPC and POPS samples come in sealed glass ampules (25 mg), which should be stored in −20°C. All the methods and results presented herein were obtained using these samples. Notably, there are a few other companies that also provide lipid molecules, including Matreya, LLC (College, Pennsylvania, USA), and Lipoid LLC (Newark, New Jersey, USA).
Chloroform. HPLC grade (amylene and ethanol stabilized).
Sodium phosphate buffer (10×): To prepare 100 mM sodium phosphate buffer (pH 7.4), dissolve 3.1 g of NaH2PO4∙H2O and 10.9 g of Na2HPO4 in water. Next, filter the solution filtered through a disposable Millex-GP syringe filter unit (0.22 μm) before use. All buffer solutions should be prepared with deionized (DI) water (18.2 MΩ at room temperature).
2.2 Instruments and Related Accessories
AFM instruments. The following AFM instruments were used due to their availability: NanoScope MultiMode 8 system (Bruker, Santa Barbara, California, USA) and MFP-3D AFM (Oxford Instrument Asylum Research, Santa Barbara, California, USA).
MSNL AFM cantilevers E and F (Bruker, Santa Barbara, California, USA).
AFM specimen discs (Ted Pella, Inc., Redding, California, USA).
2 mL glass vial and glass pipette (Fisher Scientific, Waltham, Massachusetts, USA).
Micro glass slides (Allegiance Healthcare Corporation, McGaw Park, Illinois, USA).
Muscovite mica (Asheville Schoonmaker Mica Co., Newport News, Virginia, USA).
Texwipe TX604 wipers (Texwipe, Kernersville, North Carolina, USA).
Ruban Invisible Tape (Staples Office Superstore, Framingham, Massachusetts, USA).
Double-sided sticky black, conductive carbon tape (Ted Pella, Inc., Redding, California, USA).
Aron Alpha Industrial Krazy Glue™ (Toagosei America, West Jefferson, Ohio, USA).
Ultrasonicator—Branson 1210 (Branson Ultrasonics, Danbury, Connecticut, USA).
Vacuum oven—VWR Sheldon, Model 1400E (J&M Scientific, Woburn, Massachusetts).
ImmEdge Hydrophobic Barrier Pen (Vector Laboratories, Inc., Burlingame, California, USA).
Dry bath incubator (Fisher Scientific, Waltham, Massachusetts, USA).
3 Methods
3.1 Preparation of POPC SLB
Open the mouth of the glass ampule containing 25 mg of POPC and then add 1 mL chloroform. This is the stock solution. Always use a glass pipette (see Note 1).
Pipette 20 μL of the above solution into a glass vial and evaporate the chloroform. First, gently purge the vial by using argon flow, and then place the vial in a vacuum chamber overnight, or for 8 h, to ensure complete drying.
To prepare a 0.5 mg/mL solution of POPC, add 1 mL of 10 mM sodium phosphate buffer (pH 7.4), and then sonicate the solution until it becomes clear (see Note 2).
Using Krazy™ glue, paste a piece of mica (1.0×1.0 cm) onto a glass slide and allow it to dry for 30 min. After drying, draw a line along edges of the mica with a hydrophobic pen and again allow it to dry for 10 min (see Note 3).
Once sonication is complete from step 3, cleave the mica by using scotch tape until a clear layer of mica is visible on the tape.
Add ~200 μL of the 0.5 mg/mL POPC solution onto the mica, and place it in a dry heating bath at 60°C for 1 h (see Note 4).
Add buffer periodically to prevent sample drying.
After incubating for 1 h in the heating bath, remove the sample from the heating plate, allow it to reach room temperature, and then rinse the surface gently, but thoroughly, with the 10 mM sodium phosphate buffer (pH 7.4).
Add ~100 μL of 10 mM phosphate buffer (pH 7.4) to the newly prepared POPC SLB surface, and immediately place it on the AFM stage for imaging.
3.2 Preparation of POPS SLB
Add 1 mL of chloroform immediately after opening the mouth of the glass ampule containing 25 mg of POPS powder. Transfer the solution to the glass vial. This is the stock solution. Always use a glass pipette (see Note 1).
To prepare the working solution, use a glass pipette to extract 20 μL of the stock solution and place it into a new glass vial. Completely evaporate the chloroform from the working solution by first applying an argon stream and then leaving the sample in vacuum chamber overnight.
Add 1 mL of the 10 mM sodium phosphate buffer (pH 7.4) to prepare the 0.5 mg/mL POPS solution, which will be used for SLB preparation. Then sonicate the POPS solution for 30–40 min at room temperature until the solution becomes clear.
Repeat the steps 4 and 5 in Subheading 3.1.
Add ~150 μL of the 0.5 mg/mL POPS solution onto the freshly cleaved mica surface attached to a glass slide.
Incubate for 1 h at 60°C in a dry heating bath.
Repeat steps 7–9 described in Subheading 3.1.
3.3 Testing of the Surfaces
3.3.1 Ex Situ AFM Imaging of POPC SLB Prepared at Room Temperature
The formation of the SLB surface involves a few characteristic steps, including the deposition of vesicles on a solid support (Fig. 1a), followed by deformation and rupture of the vesicles (Fig. 1b), and then the transformation of vesicles into lipid patches (Fig. 1c), which coalesce and reorganize into larger patches (Fig. 1d) [8, 14]. These steps can be directly visualized by ex situ AFM imaging described in the following steps.
Fig. 1.
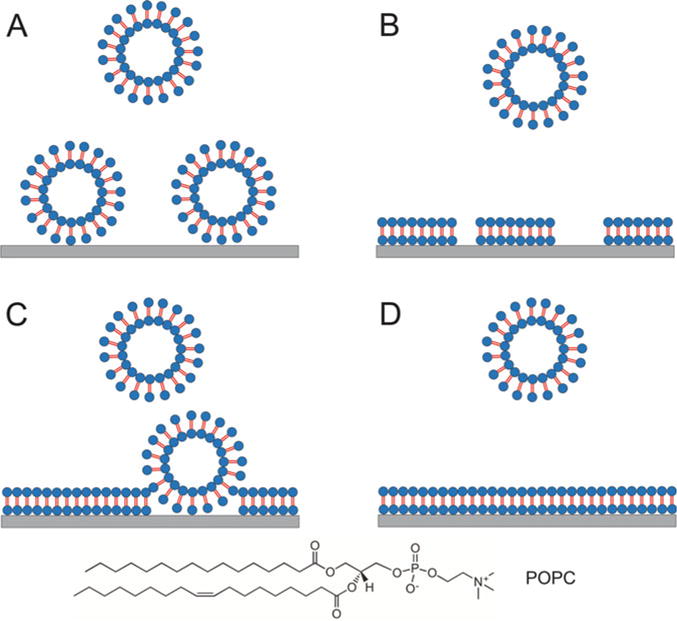
Proposed formation process of phospholipids onto mica surface. (a) Deposition/adhesion, vesicles deposit onto mica over time; (b) rupture, vesicles rupture and form patches; (c) coalescence of lipid patches; adjacent lipid patches merge to form larger patches while some vesicles are trapped; (d) completion, trapped vesicles and vesicles from solution fix the SLB, resulting in homogenous SLB. Objects are out of scale. Water layer between SLB and mica surface is omitted for simplicity. The chemical structure of POPC is shown at the bottom
Perform steps 1–3 in Subheading 3.1.
Deposit 30 μL of POPS solution onto a freshly cleaved mica surface, which has been mounted on a metal disc using a double-sided tape.
Incubate the POPC solution at room temperature in a humid environment, which is created by placing wet paper towels at the bottom of a petri dish and covering it with the lid.
After the desired incubation times are achieved, wash excess POPC by thoroughly, but gently, exchanging the POPC solution with the sodium phosphate buffer. Keep the subsequent POPC SLB in buffer in a humid chamber.
Perform imaging of the samples in liquid by using a Multi-Mode 8 AFM equipped with the PeakForce-HR (High Rate) mode (see Note 5). Use the MSNL cantilever E, with a nominal spring constant of 0.1 N/m.
Initially (i.e., after 1 min incubation), only the vesicles are observed on the surface (Fig. 2a). After 3 min of incubation, the number of vesicles deposited on the surface is increased (Fig. 2b). Vesicles start forming small patches after 6 min (Fig. 2c). These patches coalesce to form bigger patches (Fig. 2d), and after 15 min of incubation, large lipid patches are obtained (Fig. 2e).
Fig. 2.
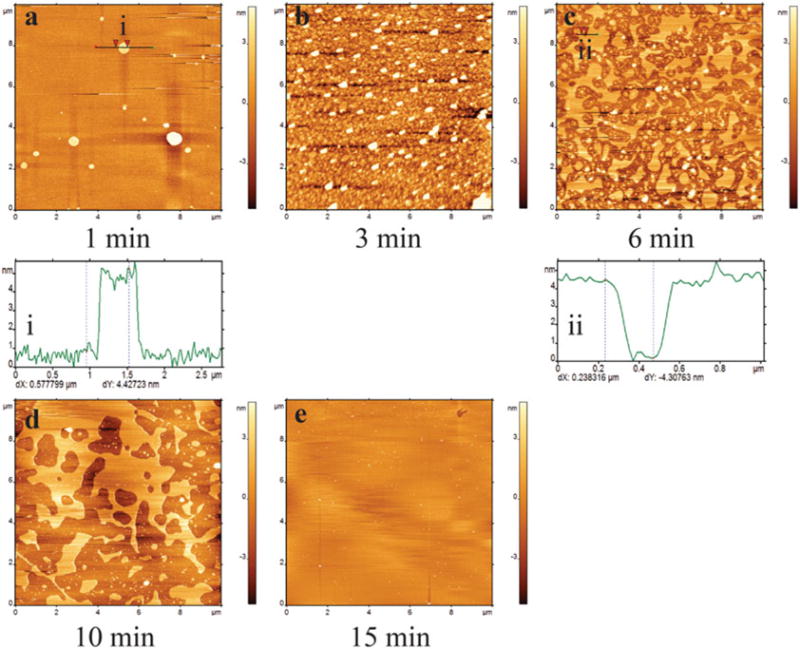
Ex situ time-lapse of the formation of POPC SLB. (a–e) are AFM images taken at different time periods. At 1 min (a), there are a few vesicles on the substrate, evidenced by the cross section (i) of the round-shaped feature indicated a black straight line. At 3 min (b), more vesicles deposit on the substrate. Most vesicles transformed into lipid patches/islands (6 min, plate (c)). A cross section shows the height of the lipid islands are about 4.3 nm (ii). The vesicles then coalesce into large patches (d, 10 min). After incubated for 15 min (e), almost full coverage of SLB has been achieved. Images are 10×10 μm. The concentration of POPC was 0.5 mg/mL
3.3.2 In Situ Time-Lapse AFM Imaging of the Formation of the POPC SLB at Room Temperature
In situ time-lapse AFM imaging provides the unique opportunity to monitor the same surface area for a considerable period of time. Further, this technique enables one to directly visualize the formation of the POPC SLB on the mica surface in real time. Detailed methods for this procedure are described below.
For the MultiMode 8 AFM, a metal disc can be used to mount the mica substrate onto the sample stage. The MSNL cantilever F, with a nominal spring constant of 0.6 N/m, can be used to image in liquid. The sample stage is surrounded by rubber to prevent the leakage of liquid. On top of the sample stage, a fluid cell is mounted in an inverted fashion. This fluid cell has an inlet and an outlet, both of which allow for exchange of buffer in situ and are each connected to a disposable 1 mL syringes. Buffer exchange is achieved by streaming fresh buffer into the inlet while evacuating the existing buffer through the outlet.
First, an image of the mica support alone should be acquired to ensure that the substrate is clean (Fig. 3a).
Add 5 μg/mL of POPC solution (see Note 6); images are to be taken immediately after injecting the POPC solution (Fig. 3b). The number of vesicles is increased after 8 min of imaging (Fig. 3c) and starts forming patches after 13 min of imaging (Fig. 3d). Patches coalesce to form the large patch with small defects (Fig. 3e, f). The circled features in Fig. 3g, h indicate how the vesicle, which is trapped in the bilayer or appears from the solution, fixes the defects. The height of the patches (4–5 nm) obtained from the cross-section profiles indicates the formation of a single bilayer (Fig. 3i–iii).
Use PeakForce mode to image (see Note 5). The imaging parameters will be automatically adjusted by the NanoScope 8 software to ensure the best optimal imaging quality.
Fig. 3.
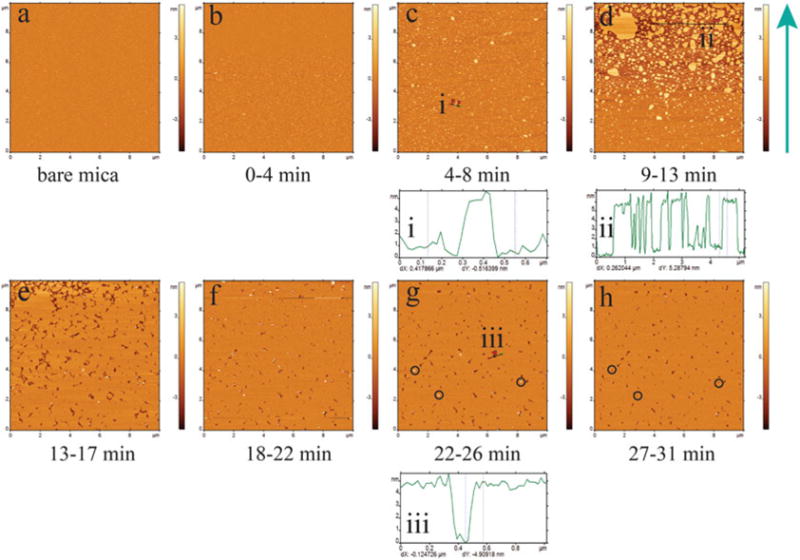
In situ time-lapse AFM imaging of 5 μg/mL on freshly cleaved bare mica. (a) Prior to adding of POPC, bare mica surface is imaged which is very smooth. (b–h) are in situ time-lapse images showing the process of the formation of a POPC SLB. At 0–4 min, there are only a few small vesicles, if there are any (b). More and more vesicles deposit onto the substrate (c). Vesicles rupture into patches (d). Lipid patches coalesce into uniform SLB with small defects (e). Trapped vesicles or vesicles from the solution fix packing defects (f–h). i, ii, and iii are cross sections indicated with black solid lines at c, d, and g, respectively. Green arrow to the right of frame “d” shows the scanning direction
3.3.3 Heating in Order to Improve Homogeneity of POPC SLB Surface
Notably, preparation of bilayers at room temperature usually results in defects. In turn, SLB surfaces prepared at elevated temperature (60°C) provide homogeneous bilayers with complete coverage.
Follow the steps mentioned in Subheading 3.1 (see Note 7).
In the case of preparing the POPC SLB at an elevated temperature (60°C), a cooling step is recommended in order to create more homogeneous SLB surfaces. Extensive exchange of the lipid solution with buffer is suggested to remove any excess vesicles. It is also important to note that the POPC SLB should not be harshly rinsed; this force can potentially damage the bilayer surface.
After gently rinsing with the sodium phosphate buffer, add 100 μL of the same buffer on top of the prepared SLB, and keep the sample in a humid chamber until imaging (see Note 8). Samples should be imaged as soon as possible after the rinsing. AFM can be used to monitor the homogeneity of the POPC SLB by scanning a relatively large area of the surface. Figure 4a demonstrates a defect-free, large patch of a POPC SLB. A larger area (80×80 μm) is scanned to locate any defects (Fig. 4b). A hole/defect and a second layer of bilayer is found, whose depth and height are shown in the cross-section profiles (Fig. 4i and ii).
This increased homogeneity due to the incubation at elevated temperature is also true for POPS SLB formation.
Fig. 4.
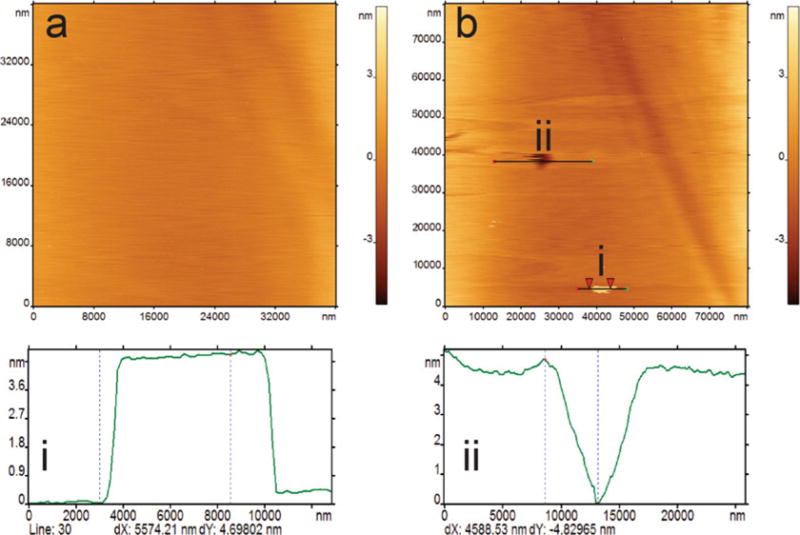
AFM images of a POPC SLB prepared by incubating 0.5 mg/mL at 60°C for 1 h. (a) A 20×20 μm image shows uniform coverage with no packing defects. (b) shows a zoomed-out view of the same area of 80×80 μm, which shows a large packing defect and a second layer on top of the POPC SLB. Cross sections show the height (i) and the depth (ii) of the packing defect and the second layer, respectively
3.4 Validation of Homogeneity of the POPC SLB Surface
Nano-scratching or nano-shaving is a suitable method to characterize the homogeneity and the number of layers formed during the SLB preparation. These experiments are performed using a MultiMode 8 AFM. Prior to nano-scratching, the sample is scanned to acquire a reference image using the Peak-Force Tapping mode in liquid. The AFM tip is then retracted and engaged again with the contact mode.
Scratching is performed using the MSNL cantilever F, with a nominal spring constant of 0.6 N/m. The applied force is 8–10 nN (see Note 9). A small surface area of 500×500 nm is selected on the bilayer, and then the scratching is performed at scanning rate of 44 Hz for 3–5 min, depending on the sharpness of the tip.
After completion of scratching, the tip is retracted, and the imaging mode is switched back to PeakForce imaging. The same area is imaged again to inspect if there is a scratched hole with an expected size and height or depth (Fig. 5a). Figure 5b shows the 3D projection of the scratched area squared on the SLB (Fig. 5b). In this case, the height of the shaved area (~4.0 nm) indicates the formation of one bilayer (Fig. 5i). The scratching experiment can also be performed after 48 hours of formation of the SLB (Fig. 5c, d). The depth of the scratched area is ~5.0 nm, which is typical for a SLB (Fig. 5ii).
Fig. 5.
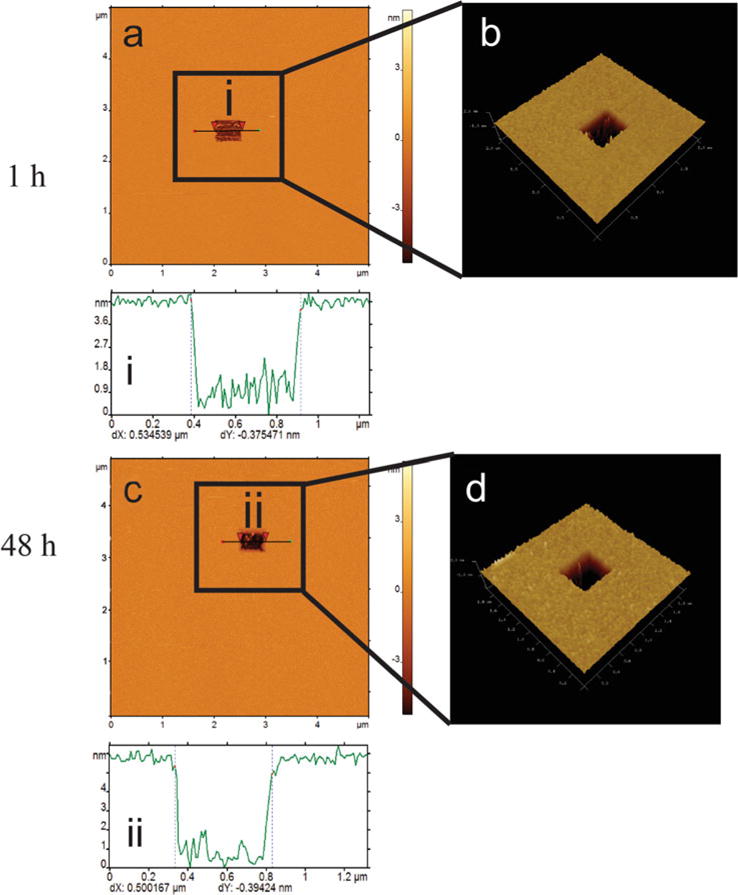
Characterization of POPC SLB morphology and homogeneity. Nano-lithography was conducted on freshly prepared homogenous sample (a). A square with size of 500×500 nm can be clearly seen. The zoom-in 3D display shows the shape and depth of the hole (b). The cross section shows the hole is ~500 nm wide and ~4 nm deep (i). Nano-lithography was also performed on the homogenous sample after 48 h (c). A square sized in 500×500 nm can be clearly seen. The zoom-in 3D display shows the shape and depth of the hole (d). The cross section shows the hole is ~500 nm in width and ~5 nm in depth (ii)
3.5 Stabilities of the POPC SLB Surface
To examine the stability of the obtained POPC SLBs, one can use the MFP3D AFM in the tapping mode and the MSNL cantilever E, with a nominal spring constant of 0.1 N/m, in liquid. The driving frequency will vary between 7 and 9 kHz. The drive amplitude is set to 1.5 V, and the setpoint is ~0.6–0.8 V (see Note 10). 10 mM sodium phosphate buffer is to be injected periodically to keep the sample wet and the instrument stable.
The morphology of defective POPC SLB surfaces can be imaged by using AFM (Fig. 6). The stability, in terms of disrupted area, has been successfully captured (see Note 11). Figure 6a shows the topographic image of a POPC SLB with defects. The bilayer surface remains stable up to 2.5 h (Fig. 6b). After 2.5 h, the defects begin to grow (Fig. 6c) and finally disrupt the bilayer with large defects (Fig. 6d, e). The same bilayer sample can be imaged again after 24 h, which also shows large holes/defects (Fig. 6f).
In contrast to SLB surfaces formed at room temperature, these same types of bilayers formed under elevated temperatures (see Subheading 3.3.3) not only form homogeneous and relatively defect-free bilayers but are also more stable (Fig. 7). Figure 7a shows a large area (i.e., 20×20 μm) of a defect-free SLB surface. This same area was monitored using time-lapse imaging, which shows that the SLB remained stable up to 11 h (Fig. 7b–d). AFM images have been captured from several other areas after 24, 48, and 72 h (Fig. 7e–g), which did not show any indication of disruption of the SLB surface. After 96 h, the surface started forming some defects, which are shown by black circles (Fig. 7h).
Fig. 6.
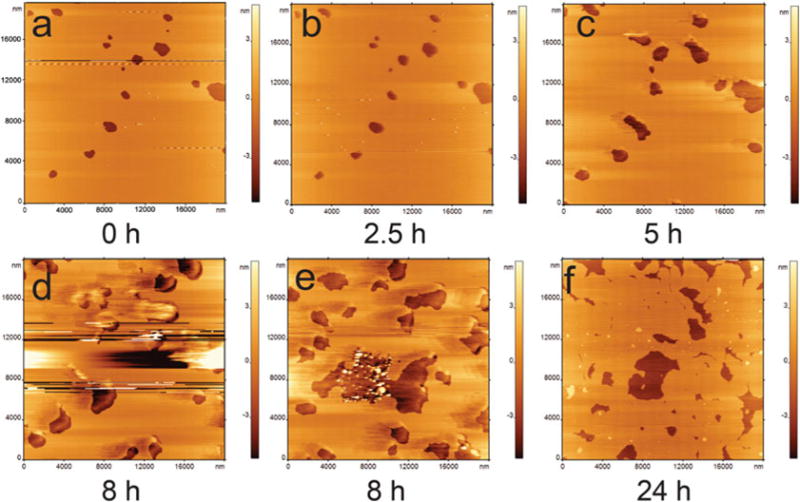
In situ time-lapse AFM images (a–d) of a POPC SLB with packing defects. The stability test shows that it is stable for 2.5 h (b). After 2.5 h, the defects start to grow (c) and result in complete damage of the bilayer (d). An image taken from a different spot after 8 h is shown in (e). The bilayer was imaged again after 24 h (f). Images are 20×20 μm
Fig. 7.
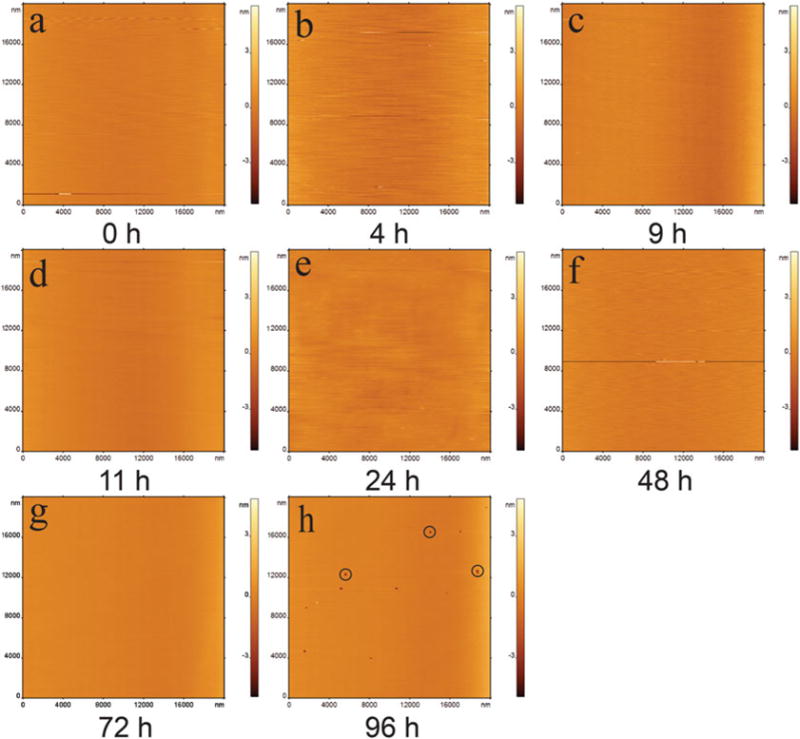
In situ time-lapse AFM characterization of POPC SLB prepared by incubating 0.5 mg/mL at 60°C for 1 h. (a–c) Images are taken during first 9 h. The POPC shows no packing defects. The stability test shows that it is stable for 11 h (d). Representative images from different spots after 11 h demonstrate the lipid is stable for 72 h (e–g). The bilayer starts to disintegrate after 96 h (h). Defects are highlighted with black circles. Images are 20 20 μm
3.6 Observation of Interaction of α-Syn with POPS SLB Surface
These smooth, stable, and defect-free POPS SLB surfaces were used as model membrane systems to probe the interaction of amyloid proteins with bilayers. The POPS SLB surface was prepared as described in Subheading 3.2, and a solution of 10 nM α-synuclein (α-syn) protein was placed above the bilayer. Figure 8a shows AFM images taken just after the tip approached the surface. Here, a smooth, homogeneous, relatively vesicle-free surface is essential because otherwise the vesicles could be mistaken for protein aggregates. The α-syn aggregates appear as clear, small, globular features after 1 h of incubation of protein on the POPS SLB (Fig. 8b). Thus, the POPS SLB assembled, as described above, can be used to monitor the aggregation of the amyloid proteins in situ using time-lapse imaging.
Fig. 8.
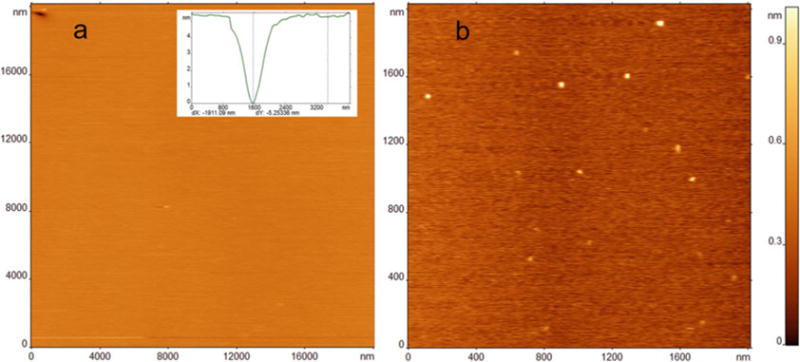
(a) AFM image of a 20×20 μm area of POPS SLB prepared by incubating 0.5 mg/mL lipid in phosphate buffer at 60°C for 1 h. A single packing defect is visible in the upper left-hand corner of the scanned image. Cross-section profile in the inset demonstrates the expected height for a packing defect. (b) α-Syn aggregates on POPS bilayer after 1 h
4 Notes
Lipids solution should always be stored in a glass container with a Teflon closure under −20°C. Glass pipette/tips are preferred for handling lipid solutions because chloroform solutions leech contaminants from plastics.
The appropriate time to stop ultrasonication is when the solution becomes clear, and there are no visible lipid flakes. To reduce hydrolysis, it is necessary to maintain temperature not more than 5–10 degrees above transition temperature of the lipid.
For MFP 3D heat- and humidity-resistant double-sided tape can be used instead of glue, for example, “Atemto PET Acrylic Double Sided Adhesive Sticker Tape.” This may also be useful, if mica needs to be attached post SLB formation, when volatile compounds from glue are unacceptable.
During heating stage of sample preparation, it can be placed into a humidified chamber (e.g., petri dish with wet tissue) to minimize buffer evaporation; however, liquid meniscus must still be monitored, since some evaporation will happen anyway, and if meniscus was too small it may dry out.
The AFM cantilever operated under the regular tapping mode may also induce the rupture of vesicles. The PeakForce module is an excellent option here because of its low invasiveness and fast scan rate.
The reasoning behind using 5 μg/mL instead of 0.5 mg/mL is that increased concentration results in faster rupture of vesicles, thus causing difficulty in capturing the initial stages of bilayer formation. The deposition of vesicles on the mica support is diffusion-dependent. In this case, a reduced concentration is preferred.
A transparent glue is very useful for this experimental setup. In particular, when aligning the laser on an asylum MFP 3D AFM, this type of glue gives one a clear bottom view of the cantilever. Nontransparent glue also works but requires additional adjustments, in which a transparent glass slide needs to be used to align the laser before mounting the sample.
While a defect-free membrane can be stable for as long as 72 h, the membrane “aging” and degradation process starts regardless of the start of scanning. Lipids that form the bilayer start hydrolyzing and forming lysolipids as soon as they are exposed to water; therefore, it is best to start imaging the SLB immediately after preparation.
In our case while using NanoScope MultiMode 8 system, the drive amplitude is 3 V for a brand-new sharp tip and 8 V for a worn wear tip. The voltage can be converted to force if the spring constant and deflection sensitivity of the cantilever are both known.
The scanning rate can greatly vary depending on multiple factors: variable tip quality and frequency, gain, drive amplitude, surface smoothness, and adhesion. Typically, a 90×90 μm SLB with no other components can be scanned at 0.7 Hz with MSNL-E or MSNL-A and at 1 Hz with MSNL-F. Smaller areas, like 15×15 μm and below, can be scanned at 2–4 Hz.
The AFM tip is placed on idle (electronically retract once, about 20 μm above the sample) to let it exert minimum influence on the sample. When the sample needs to survive overnight, it can be taken out of the sample stage and occluded with a cap that contains a wet Texwipe wiper. This treatment prevents the sample from drying and is able to preserve the sample in aqueous solution for prolonged time.
Acknowledgments
The work at University of Nebraska Medical Center was supported by grants from the National Institutes of Health (NIH) GM096039, GM118006, and NS101504 to Y.L.L. We thank Jean-Christophe Rochet (Purdue University) for providing us with the α-syn protein.
References
- 1.Coskun Ü, Simons K. Cell membranes: the lipid perspective. Structure. 2011;19(11):1543–1548. doi: 10.1016/j.str.2011.10.010. [DOI] [PubMed] [Google Scholar]
- 2.Ingólfsson HI, Melo MN, van Eerden FJ, Arnarez C, Lopez CA, Wassenaar TA, Periole X, de Vries AH, Tieleman DP, Marrink SJ. Lipid organization of the plasma membrane. J Am Chem Soc. 2014;136(41):14554–14559. doi: 10.1021/ja507832e. [DOI] [PubMed] [Google Scholar]
- 3.Nicolson GL. The fluid-mosaic model of membrane structure: still relevant to understanding the structure, function and dynamics of biological membranes after more than 40 years. Biochim Biophys Acta. 2014;1838(6):1451–1466. doi: 10.1016/j.bbamem.2013.10.019. [DOI] [PubMed] [Google Scholar]
- 4.Simons K, Toomre D. Lipid rafts and signal transduction. Nat Rev Mol Cell Biol. 2000;1(1):31–39. doi: 10.1038/35036052. [DOI] [PubMed] [Google Scholar]
- 5.Durr UH, Gildenberg M, Ramamoorthy A. The magic of bicelles lights up membrane protein structure. Chem Rev. 2012;112(11):6054–6074. doi: 10.1021/cr300061w. [DOI] [PMC free article] [PubMed] [Google Scholar]
- 6.Ahmad Z, Shah A, Siddiq M, Kraatz H-B. Polymeric micelles as drug delivery vehicles. RSC Adv. 2014;4(33):17028–17038. doi: 10.1039/C3RA47370H. [DOI] [Google Scholar]
- 7.Akbarzadeh A, Rezaei-Sadabady R, Davaran S, Joo SW, Zarghami N, Hanifehpour Y, Samiei M, Kouhi M, Nejati-Koshki K. Liposome: classification, preparation, and applications. Nanoscale Res Lett. 2013;8(1):102. doi: 10.1186/1556-276x-8-102. [DOI] [PMC free article] [PubMed] [Google Scholar]
- 8.Richter RP, Berat R, Brisson AR. Formation of solid-supported lipid bilayers: an integrated view. Langmuir. 2006;22(8):3497–3505. doi: 10.1021/la052687c. [DOI] [PubMed] [Google Scholar]
- 9.Pfefferkorn CM, Jiang Z, Lee JC. Biophysics of alpha-synuclein membrane interactions. Biochim Biophys Acta. 2012;1818(2):162–171. doi: 10.1016/j.bbamem.2011.07.032. [DOI] [PMC free article] [PubMed] [Google Scholar]
- 10.Castellana ET, Cremer PS. Solid supported lipid bilayers: from biophysical studies to sensor design. Surf Sci Rep. 2006;61(10):429–444. doi: 10.1016/j.surfrep.2006.06.001. [DOI] [PMC free article] [PubMed] [Google Scholar]
- 11.Plant AL, Brigham-Burke M, Petrella EC, O’Shannessy DJ. Phospholipid/alkanethiol bilayers for cell-surface receptor studies by surface plasmon resonance. Anal Biochem. 1995;226(2):342–348. doi: 10.1006/abio.1995.1234. [DOI] [PubMed] [Google Scholar]
- 12.Shlyakhtenko LS, Gall AA, Lyubchenko YL. Mica functionalization for imaging of DNA and protein-DNA complexes with atomic force microscopy. Methods Mol Biol. 2013;931:295–312. doi: 10.1007/978-1-62703-056-4_14. [DOI] [PMC free article] [PubMed] [Google Scholar]
- 13.Lyubchenko YL, Shlyakhtenko LS. AFM for analysis of structure and dynamics of DNA and protein-DNA complexes. Methods. 2009;47(3):206–213. doi: 10.1016/j.ymeth.2008.09.002. [DOI] [PMC free article] [PubMed] [Google Scholar]
- 14.Andrecka J, Spillane KM, Ortega-Arroyo J, Kukura P. Direct observation and control of supported lipid bilayer formation with interferometric scattering microscopy. ACS Nano. 2013;7(12):10662–10670. doi: 10.1021/nn403367c. [DOI] [PubMed] [Google Scholar]


