Abstract
Reduced graphene oxide (RGO)-supported bismuth ferrite (BiFeO3) (RGO–BFO) nanocomposite is synthesized via a two-step chemical route for photoelectrochemical (PEC) water splitting and photocatalytic dye degradation. The detailed structural analysis, chemical coupling, and morphology of BFO- and RGO-supported BFO are established through X-ray diffraction, Raman and X-ray photoelectron spectroscopy, and high-resolution transmission electron microscopy studies. The modified band structure in RGO–BFO is obtained from the UV–vis spectroscopy study and supported by density functional theory (DFT). The photocatalytic degradation of Rhodamine B dye achieved under 120 min visible-light illumination is 94% by the RGO–BFO composite with a degradation rate of 1.86 × 10⁻² min–1, which is 3.8 times faster than the BFO nanoparticles. The chemical oxygen demand (COD) study further confirmed the mineralization of an organic dye in presence of the RGO–BFO catalyst. The RGO–BFO composite shows excellent PEC performance toward water splitting, with a photocurrent density of 10.2 mA·cm–2, a solar-to-hydrogen conversion efficiency of 3.3%, and a hole injection efficiency of 98% at 1 V (vs Ag/AgCl). The enhanced catalytic activity of RGO–BFO is explained on the basis of the modified band structure and chemical coupling between BFO and RGO, leading to the fast charge transport through the interfacial layers, hindering the recombination of the photogenerated electron–hole pair and ensuring the availability of free charge carriers to assist the catalytic activity.
Introduction
Photoelectrochemical (PEC) water splitting, utilizing a semiconductor nanoparticle as the catalyst to produce hydrogen and oxygen, has attracted considerable attention over the past few decades.1−10 Hydrogen generation from water splitting11 has the following advantages: (1) reasonable solar-to-hydrogen (STH) efficiency; (2) low processing cost; and (3) the ability to achieve separate hydrogen and oxygen evolution during the reaction. Photocatalysts facilitate the water-splitting reaction through the formation of an electron (e–) and hole (h+) pair under solar light irradiation, which oxidizes water on the surface of the photocatalyst unless they recombine giving no net chemical reaction. The holes and electrons in the PEC process can degrade the dye in the presence of water.12 TiO2 is considered as the most promising photocatalyst for water splitting to generate hydrogen under the irradiation of sunlight.13 However, the quantum efficiency of the TiO2-based photocatalyst is restricted because of its large band gap (∼3.2 eV) and consequently limited absorption of visible light. Several techniques including doping, metal decoration, and formation of metal oxide complexes and heterostructures13−18 have been employed to achieve improved photocatalytic activity by hindering the charge recombination process with improved charge-transfer kinetics and photoactive to visible light.
Bismuth ferrite possessing the ferroelectric and ferromagnetic property simultaneously has drawn much attention recently in solar applications because of the bulk photovoltaic effect where the photocurrent can flow uniformly throughout the material without the formation of an interface.19 In a ferroelectric material, the photocurrent arises because of depolarization of the electric field, which can separate the photogenerated charged carriers and consequently restrict the electron–hole recombination loss as in conventional semiconductors. Bismuth ferrite shows potential photocatalytic activity toward the degradation of organic contaminants and PEC water splitting because of its narrow band gap of ∼2.1–2.7 eV.1,20−22 The narrow band gap favors the extension of light absorption region up to 750 nm and charge carrier separation.23 In particular, it has three crystalline phases: BiFeO3 (perovskite), Bi2Fe4O9 (sillimanite), and Bi25Fe2O39 (sillenite). The sillimanite and sillenite phases are paramagnetic and superparamagnetic, respectively, and extensively studied for their application toward the decomposition of organic contaminants with feasible catalyst separation and recovery.1,22,24 Although BiFeO3 (BFO) is considered as the most promising multiferroic material at room temperature, its single phase synthesis is quite challenging.25−28
The photocatalytic performance of BFO is scanty and needs attention toward the development of a multifunctional material. Some recent studies show that the catalytic performance of BFO can be improved by forming a heterojunction with the aim of suppression of charge recombination.29,30 For instance, Li et al.31 reported that the BFO/TiO2 heterojunction could enhance the photocatalytic activity and quantum efficiency than bare BFO because of the enhancement of the quantum efficiency by separating the electrons and holes effectively and degrade Congo red under visible-light illumination. Recently, Kong et al.23 reported that the BFO–(Bi/Fe)2O3 heterojunction is 2.5 times more active than BFO toward visible-light decomposition of gaseous toluene under similar test conditions. The superior activity is due to the reduced recombination probability, the increased lifetime of the charge carriers, and a superior interfacial charge transfer to adsorbed organic molecules. There is further scope for the improvement of the charge migration with inhibited charge recombination of BFO by suitably choosing a supporting material.
The high surface area, excellent electrical conductivity, and high charge carrier mobility in graphene make it an efficient and suitable candidate as an electron acceptor to mitigate the recombination of photogenerated electrons and holes during the photocatalytic reaction. For instance, Soltani et al.32 reported improved decomposition of bisphenol A under visible light by the BFO/reduced graphene oxide (RGO) composite. Also, Xian et al.33 reported the graphene-assisted photocatalytic activity enhancement of Bi2Fe4O9 (sillimanite) nanoparticles. On the other hand, Sun et al.24 studied the degradation of methylene blue under visible-light irradiation in Bi25FeO40 (sillenite)–graphene composite. Li et al.34 found out that the photodegradation of Congo red under visible light is 6 times higher in graphene-supported BFO than in BFO alone. In the context of water splitting, Joshi et al.35 studied the half-cell performance of BFO nanocubes and observed a low photocurrent density of 5.2 μA·cm–2 at 1 V (vs saturated caromel electrode) for O2 evaluation. Similarly, Gao et al.36 reported that BFO nanowires were unable to produce H2 either from pure water or from Pt/CH3OH/H2O solution under visible-light irradiation and UV irradiation. The poor PEC water-splitting performance in BFO is due to excessive electron–hole recombination, reduced charge transport, large particle aggregation, and poor water oxidation kinetics.
Therefore, further improvement in the performance is desired for practical applications of BFO for water splitting. Toward this end, suitable heterojunction between BFO and RGO is established by the uniform dispersion of BFO nanoparticles onto the RGO sheet, which not only prevents particle agglomeration but suppresses the electron–hole recombination and also favors facile charge transport through a suitable band alignment. Also, the photogenerated electrons can be readily transferred through the graphene which acts as an electron acceptor; thus, more photogenerated electrons and holes are available for the photocatalytic reactions. A photochemical reaction scheme is further proposed toward water splitting for BFO, which is not reported earlier.
Herein, a facile chemical route has been adopted for decorating the RGO sheet with BFO nanoparticles for PEC water splitting. The RGO–BFO nanocomposite is obtained by reducing the exfoliated graphene oxide (GO) in the presence of BFO nanoparticles. The catalytic degradation of Rhodamine B (RhB) under visible-light illumination exhibited improved charge-transport properties, leading to a remarkable enhancement in visible-light response. The electrochemical measurements suggest that the RGO–BFO nanocomposite gives better performance than BFO nanoparticles toward STH generation and hole injection efficiency in visible light. The improved performance is discussed on the basis of physical characteristics of the RGO–BFO nanocomposite, generation of charge carriers, extension of light absorption region, density functional theory (DFT) calculations, and suppression of charge carrier recombination.
Results and Discussion
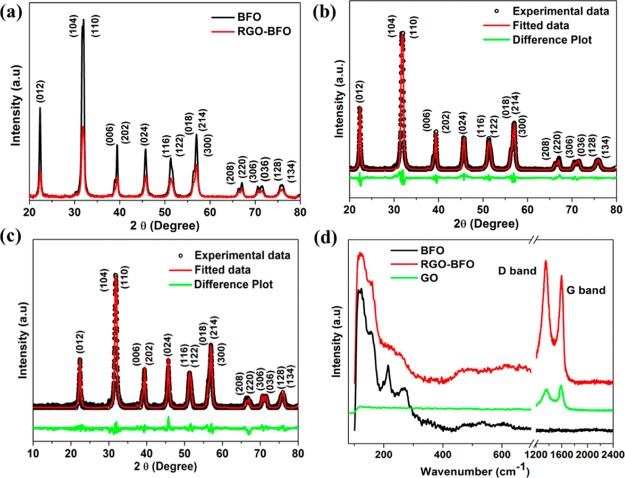
The X-ray diffraction (XRD) pattern of BFO calcined at different temperatures is shown in Figure S1 (Supporting Information). It is observed that the samples calcined at 500 and 600 °C contain different phases (Bi2Fe4O9 and Bi25Fe2O39) than BFO. However, the sample calcined at 400 °C is in pure BFO phase and considered for the composite formation with RGO. Figure 1a shows the XRD pattern of BFO calcined at 400 °C and the RGO–BFO composite. The pattern reveals a well-crystalline rhombohedral phase with a space group R3c (JCPDS no. 86-1518). The intensity of diffraction peaks decreases in RGO–BFO than in BFO nanoparticles confirming the composite formation. The detailed structural analysis is done using the Rietveld refinement method with the help of Maud software. The structural parameters (lattice parameter, atomic coordinates, and occupancy) and microstructural parameters (crystallite size and lattice strain) are estimated by analyzing the respective XRD pattern. The Rietveld refined XRD pattern of BFO and RGO–BFO is shown in Figure 1b,c, respectively. The difference between the observed and refined XRD pattern is shown by the lower green line. The refinement is done using the trigonal space group R3c with lattice constants a = 0.55876 nm, b = 0.55876 nm, and c = 1.3867 nm. The line broadening is fitted by refining the structural and microstructural pattern, and the background of each pattern is fitted with a four-degree polynomial. The line broadening and size–strain model are chosen to be Popa LB and Popa rules during the refinement. The refinement of the structural parameters is continued till the convergence is reached with the goodness of fit ∼1, which ascertain excellent fitting quality. The pseudo-Voigt (pV) X-ray line shape and the Gaussian microstrain distribution are the normalized Fourier transform of the pV function used for profile fitting to estimate the crystallite size and lattice strain. The bond length and bond angle are estimated using the Mercury 3.1 with the help of Rietveld refined parameters and rhombohedral cage of BFO (Figure S2a,b, Supporting Information). The different refinement parameters are enlisted in Table S1 (Supporting Information). The estimated values of the lattice parameter, microstrain, crystallite size, bond length, and bond angle for RGO–BFO are comparable to that for BFO. The small difference arises because of the coordination of lattice oxygen with RGO, which locally distorts the lattice of BFO and plays a significant role in optical and electrochemical properties. The Raman scattering is considered as a valuable and important technique to study the local structure of BFO and the RGO–BFO composite. The Raman spectra of BFO nanoparticles and the RGO–BFO composite are shown in Figure 1d. The Raman active modes of BFO with the rhombohedral structure and R3c space group are obtained using the irreducible space group, ΓRaman, R3c = 4A1 + 9E.37 The A1 modes are polarized along the z-axis, and the doubly degenerate E modes are polarized in the x–y plane. The computed frequencies of the transverse optic and longitudinal optic modes of A1 and E symmetry are provided in the Supporting Information (Table S2). The modes up to 167 cm–1 are due to Bi atoms and Fe atoms that are mainly involved in bands between 168 and 261 cm–1 and also due to some higher frequency bands, while oxygen motion is involved in bands above 262 cm–1.38 Thus, the modes located above 200 cm–1 are due to the internal vibration of FeO6 octahedral. In the present study, 11 peaks due to 4A1 + 7E modes are observed for the BFO nanoparticle. Similar kind of observation is reported by Yuan et al. for BFO with 10 Raman modes.39 However, in the case of RGO–BFO, only eight peaks due to 2A1 + 6E modes are observed. We could not observe all the Raman modes of rhombohedral BFO (R3c) in the RGO–BFO sample. The suppression of Raman modes is ascribed to the influence of oxygen stoichiometry and change in oxygen bonding.40 The D band and the G band for GO are located at 1350 and 1580 cm–1, respectively.41 Clearly, the D/G intensity ratio of RGO in RGO–BFO (1.2) is higher than that of GO (0.95) because of restoration and decrease in the average size of sp2-hybridized carbon during the reduction reaction.42 In our case, the Raman modes for D and G bands for RGO–BFO are positioned at 1352 and 1596 cm–1, respectively. The observed blue shift confirms the reduction of GO to RGO.43
Figure 1.
(a) XRD pattern of BFO and RGO–BFO, (b) Rietveld refined pattern of BFO, (c) Rietveld refined pattern of RGO–BFO, and (d) Raman spectra of BFO and RGO–BFO.
Figure 2a shows the bright field transmission electron microscopy (TEM) image of BFO. The particles are identical in shape with a slight deviation from the spherical symmetry. The particle size and standard deviation are estimated from log-normal distribution function as given in eq 1, and they are presented in Figure 2b.
| 1 |
where μ is the particle size and σ is the standard deviation. The high-resolution TEM (HRTEM) image of BFO nanoparticles is shown in Figure S3 (Supporting Information). The (101) and (110) diffraction planes match with the BFO phase (JCPDS no. 86-1815). The selected area electron diffraction (SAED) pattern is shown in Figure S4 (Supporting Information) with the distinct rings, suggesting the polycrystalline nature of the sample. The rings are indexed, which match with BFO. Figure 2c shows the TEM image of the RGO–BFO composite. The BFO nanoparticles are uniformly distributed and are entrenched within the thin layer of RGO. It is clearly seen in Figure 2c that the BFO nanoparticles do not lose contact with RGO even after the rigorous ultrasonication during TEM sample preparation, confirming the excellent attachment between BFO and RGO. The thin graphene sheet and BFO nanoparticles are semitransparent to the electron beam. Such an architecture is advantageous because it favors easy and facile charge transfer through the graphene sheet during the PEC process.
Figure 2.
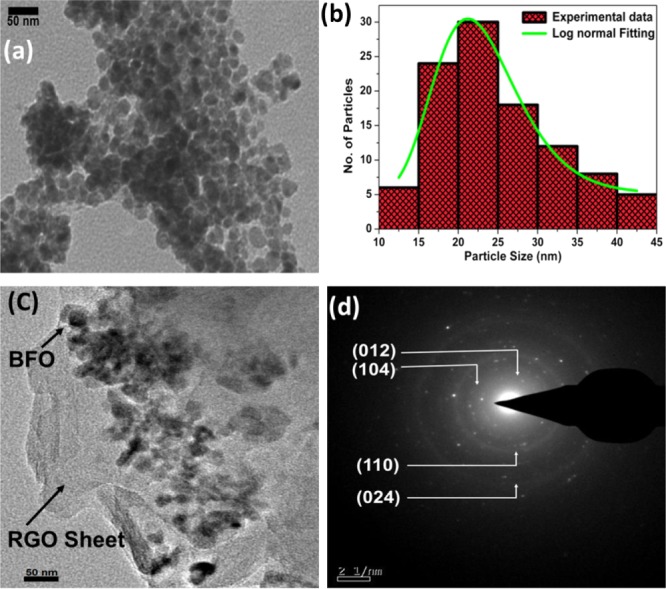
(a) TEM image of BFO, (b) particle size histogram calculated from (a), (c) TEM image of RGO–BFO, and (d) SAED pattern of RGO–BFO.
The particle size of BFO within the composite is similar to that of pure BFO sample, suggesting that no aggregation has taken place. Also, wrinkles are observed on the RGO sheet, confirming the ultrathin layer of the RGO sheet. The SAED pattern of RGO–BFO is shown in Figure 2d. The pattern matches with BFO and corroborates with the XRD study.
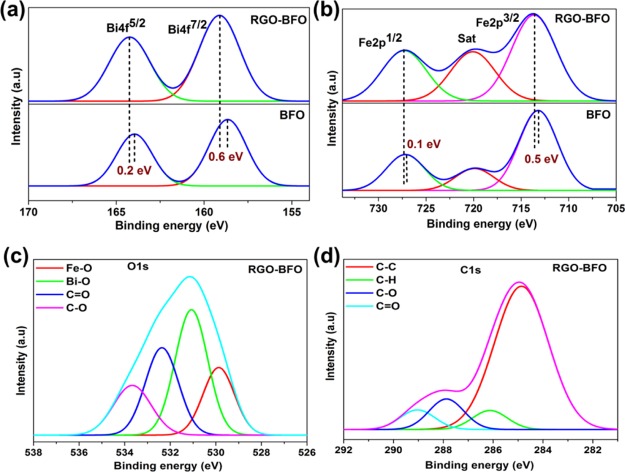
The chemical state of the elements of the as-prepared BFO and RGO–BFO measured by X-ray photoelectron spectroscopy (XPS) is given in Figure 3a,d. The strong signal from the Bi 4f core-level spectrum with maxima corresponding to Bi 4f5/2 and Bi 4f7/2 is positioned at 163.5 and 158.1 eV, respectively, in BFO and at 163.7 and 158.7 eV, respectively, in RGO–BFO, as shown in Figure 3a. There is no trace of metallic Bi0 4f core level and Bi2+ 4f core level, indicating the presence of only the Bi3+ state. As compared to BFO, the Bi 4f5/2 and Bi 4f7/2 peaks for RGO–BFO are shifted by 0.2 and 0.6 eV, respectively, toward higher energy state. The XPS signal from the Fe 2p core-level spectra in BFO and RGO–BFO is presented in Figure 3b.
Figure 3.
XPS spectra of (a) Bi 4f electron of BFO and RGO–BFO, (b) Fe 2p electron of BFO and RGO–BFO, (c) O 1s core-level electron of RGO–BFO, and (d) C 1s core-level electron of RGO–BFO.
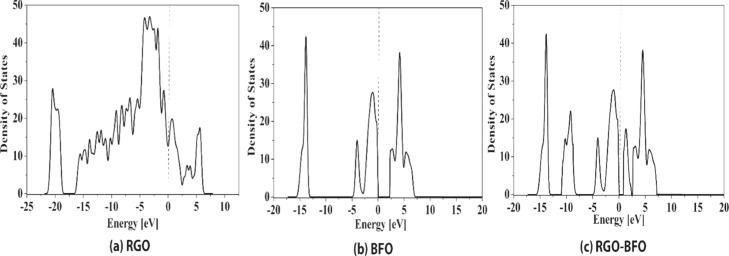
The peaks at binding energies 713.2 and 727.1 eV for BFO and 713.6 and 727.2 eV for RGO–BFO represent Fe 2p3/2 and Fe 2p1/2 of Fe3+, respectively, arising from the spin–orbit interaction. Furthermore, the position of the satellite peak in the Fe 2p spectra is in good agreement with the Fe3+ oxidation state in BFO.44 Also, the Fe 2p1/2 and Fe 2p3/2 peaks for RGO–BFO are shifted by 0.1 and 0.5 eV, respectively. The red shift suggests a certain electronic interaction between BFO nanoparticles and the RGO sheet.45 The binding energy of O 1s in BFO nanoparticles emerges at 530.2 and 531.2 eV corresponding to the lattice oxygen of Fe–O and Bi–O bonds, respectively, shown in Figure S5 (Supporting Information). The O 1s spectra of RGO–BFO are deconvoluted into four signature peaks corresponding to Fe–O, Bi–O, C=O, and C–O, as shown in Figure 3c. The Fe–O and Bi–O bonds are positioned at 529.9 and 530.8 eV, respectively. The lattice oxygen bonds of metals are slightly decreased toward lower binding energy in RGO–BFO compared to that in BFO, which might be due to the electronic interaction between the RGO sheet and the BFO nanoparticle and formation of Fe–O–C and Bi–O–C bonds, which in turn confirm the high degree of attachment between BFO and the RGO sheet. The binding energy components positioned at 532.3 eV (C=O) and 533.6 eV (C–O) are ascribed to the residual oxygen-containing groups in RGO.46 The C 1s peak of RGO–BFO is deconvoluted into four peaks, as shown in Figure 3d. The four peaks are ascribed to the nonoxygenated C–C bond, hydroxyl C–H bond, epoxy C–O bond, and C=O bond positioned at 284.8, 286.1, 287.8, and 289 eV, respectively.32 The strong C 1s peak (284.8 eV) is related to graphitic carbon in graphene and the weaker peaks arise from the oxygenated species, confirming that a certain degree of deoxygenation process accompanies the reduction of GO.47 Further confirmation of the role of RGO on BFO nanoparticles is conferred from UV–vis absorption spectra (Figure 4a). The room-temperature optical absorption spectra in the range 250–800 nm for BFO and RGO–BFO are shown in Figure 4a. The absorption spectra show that broad and strong spectra in the 500–600 nm range are ascribed to the band gap absorption. As the BFO nanoparticles are anchored onto the RGO sheet, a red shift is observed in the RGO–BFO composite, suggesting a decrease in band gap energy. The optical band gap energy from the absorption spectra is calculated using the Tauc relation, given as αhν = A(hν – Eg)n, where h is Planck’s constant, α is the absorption coefficient, Eg is the optical energy gap, and A is the constant, for direct transitions n = 1/2. The extrapolation of the straight line to (αhν)2 = 0 axis in Figure S6 (Supporting Information) gives Eg. The band gaps for BFO and RGO–BFO are found to be 2.25 and 1.85 eV, respectively, and are in agreement with the previous report on BFO.48 The decrease in band gap supports certain electronic interaction between BFO nanoparticles and the RGO sheet. The RGO contributes to the tuning of the band gap in the RGO–BFO nanocomposite. The room-temperature photoluminescence (PL) emission spectra (excitation wavelength 514 nm) of BFO and RGO–BFO are shown in Figure 4b. The PL spectra of BFO show a strong emission, suggesting a high electron–hole recombination rate, whereas in RGO–BFO, the weak emission spectra indicate the slow rate of electron–hole recombination. Further, the geometrically optimized lattice structure of pure RGO, BFO, and combined RGO–BFO is illustrated in Figure 5. After the geometry relaxation of RGO–BFO, a slight lattice distortion was observed (as shown in Figure 5c), which is also observed from the XRD study. The result indicates the existence of a strong interaction between RGO and BFO. The equilibrium interlayer distance between the two slabs of RGO and BFO is 3.347 Å, which is in close agreement with the earlier reported distance of 2.790 Å.49 In order to understand the electronic properties of the composite structure of RGO–BFO, the total density of states (DOSs) are calculated for each individual structure (RGO and BFO) as well as the combined structure of RGO–BFO (Figure 6). A Fermi level is chosen as the reference state of energy. The DOS of the RGO lattice, illustrated in Figure 6a, suggests an overlap of valence band (VB) and conduction band (CB), which leads to a zero band gap in pure RGO, similar to previous reports.50,51 Moitra et al.49 reported that all contributions in RGO arise from C 2s and C 2p states. They further observed that for pure BFO, the VB is constituted of O 2p and Fe 3d states, whereas the CB is constituted of Bi 6p states. The hybridization between Fe 3d and O 2p states is attributed to the overlap of these states. The calculated band gap is 2.5 eV (Figure 2b) for BFO, which is consistent with the experimentally measured optical band gap (2.25 eV). As the BFO lattice structure is composited with the RGO superlattice, new bands appear in the gap region near the Fermi level (Figure 6c) originating from C 2p states of graphene. The appearance of the new bands leading to the reduction of the calculated band gap of RGO–BFO to 1.5 eV is due to the hybridization between C 2p states of graphene and O 2p and Fe 3d states of BFO,49 which is also consistent with the experimental results (1.85 eV). The result clearly indicates the effect of RGO on the electronic properties of BFO. Therefore, on the basis of these calculations, we can observe an improved electronic conductivity and an electrocatalytic activity of RGO–BFO for the electrochemical reduction of H2O.
Figure 4.
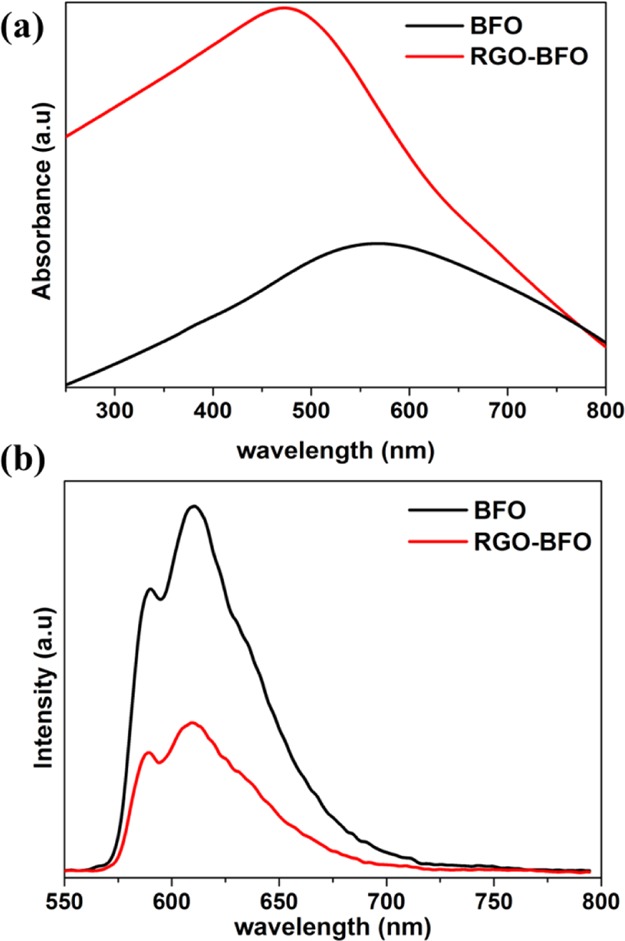
(a) UV–vis spectra and (b) PL spectra of BFO and RGO–BFO.
Figure 5.
Geometrically relaxed lattice structure of (a) RGO, (b) unit cell of BFO, and (c) combined RGO–BFO.
Figure 6.
Total DOS of (a) RGO, (b) BFO, and (c) combined RGO–BFO structure. The dotted line indicates the Fermi level referenced to zero energy states.
The photocatalytic performance of BFO and RGO–BFO evaluated by the decomposition of RhB under visible-light illumination is shown in Figure S7a (Supporting Information). The degradation rate of RhB is 4% even after the illumination of 120 min without the catalyst, indicating an excellent stability of RhB. However, the degradation rate of RhB reaches up to 10% for RGO, 56% for BFO, and 91% for RGO–BFO after illumination of 120 min as shown in Figure S7b (Supporting Information), which is consistent with previous reports. For instance, Guo et al.29 reported 94% degradation of RhB after illumination of 120 min in 10 wt % Gd-doped BFO. The complete degradation of bisphenol A and 78% degradation of total organic carbon are achieved in the RGO–BFO composite.32 Further, 75 and 71% degradation of Congo red is reported in the RGO–BFO hybrid system under visible-light illumination of 120 min with the rate constant varying from 0.96 × 10⁻² to 1.8 × 10⁻² min–1.34,52
The degradation rate of RhB is estimated by the pseudo-first-order
rate kinetics, which can be described from equations  and
and  , where C0 is
the initial concentration of RhB after stirring the solution for 60
min, Ct is the RhB concentration
at illumination time t, and kobs is the observed pseudo-order rate constant. The linear
relationship between ln(C0/Ct) versus illumination time (t) is shown in Figure S7c (Supporting Information). The observed rate constant for RGO–BFO
(1.86 × 10⁻² min–1) is higher
than that for BFO (7.18 × 10⁻³ min–1) and similar to others34,52 confirming superior
photoactivity of RGO–BFO.
As the BFO nanoparticles are embedded within the RGO sheet, the adsorption of RhB can be preceded through the surface of BFO nanoparticles or via the surface of the RGO sheet. However, the latter is much more favorable because of the presence of giant π-conjugational plane in RGO, which interacts strongly with the RhB molecule through π–π stacking with a face-to-face orientation.53,54 The enhanced photocatalytic activity in RGO–BFO is explained on the basis of charge transfer between BFO, RGO, RhB, and excited RhB (RhB*). The band edge positions of RGO–BFO are shown in Figure S7d (Supporting Information). The RGO is an excellent electron mediator facilitating the electron transfer between RhB* and BFO. RhB* can efficiently transfer the electron to the RGO plane at a much faster rate than BFO. However, because of the electron recombination between the transferred electron and surface-adsorbed RhB+, the degradation rate of RhB over the RGO surface is delayed (shown by a dashed arrow). As the BFO nanoparticles are embedded into the RGO sheet, the excited electron moves to the CB of BFO from RGO prior to recombination. The electrons on the surface of BFO can also be trapped by various oxygenated species, thus delaying the recombination further and enhancing the photocatalytic activity toward the degradation of RhB. The performance of different BFO catalysts toward the degradation of various contaminants is enlisted in Table S3 (Supporting Information).
The complete degradation of the RhB dye is associated with the decolorization of the dye as well as mineralization of the organic compound of the dye. In order to get a deep insight about the mineralization of the dye, the irradiated sample with regular time interval is analyzed by the chemical oxygen demand (COD) measurement shown in Figure S8 (Supporting Information). The study demonstrates that 95% of the COD value is reduced after 120 min visible-light illumination for the RGO–BFO composite, whereas it is about 45% for BFO and 21% in the absence of any catalyst. The residual 5% COD value is within the acceptable limit of COD governed by world health organization (WHO). The study extends the dye degradation efficiency of the RGO–BFO composite without the formation of any harmful element during the degradation process. The performance of RGO–BFO in the present study shows superior activity toward the degradation of RhB in terms of low catalyst concentration and high degradation rate.
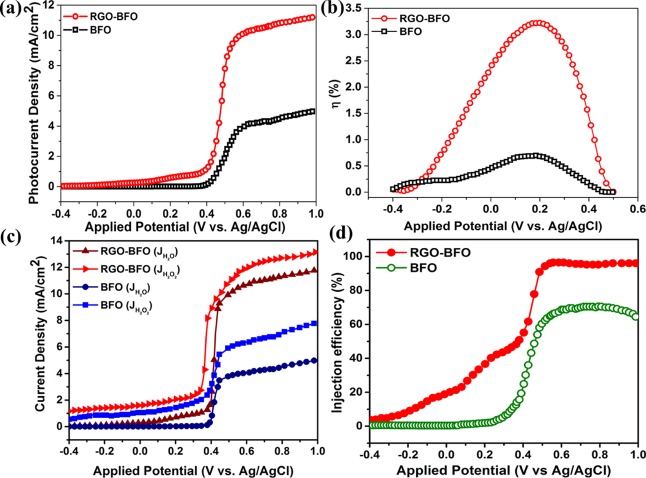
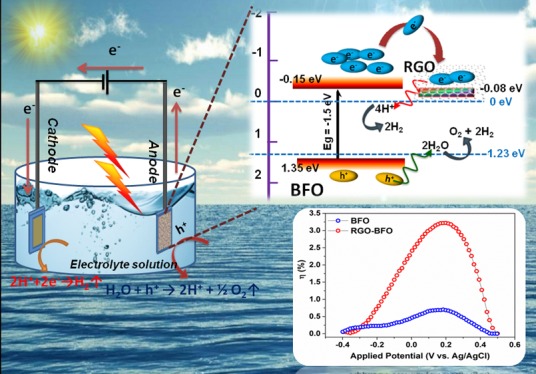
The main emphasis of the present study is to establish the effectiveness of the BFO–RGO composite photoanode toward water splitting in the KOH electrolyte. The PEC water-splitting performance of the BFO nanoparticle and RGO–BFO nanocomposite is evaluated by measuring the linear sweep voltammetry (LSV) under dark and visible-light illumination conditions with a xenon lamp of intensity 100 mW·cm–2. The current density obtained under illuminated condition is significantly higher than that under dark condition for both BFO and RGO–BFO. The photocurrent density is calculated by subtracting the dark current from the light current and divided by the electrode area and plotted against the applied potential as shown in Figure 7a. The PEC performance of the RGO–BFO composite shows significant improvement as compared to the BFO nanoparticles in terms of lower onset potential and higher photocurrent density. The photocurrent onset potential of BFO is found to be 0.41 V (vs Ag/AgCl), which is shifted slightly toward lower potential (0.35 V (vs Ag/AgCl)) in the case of RGO–BFO. The photocurrent density for RGO–BFO is 10.2 mA·cm–2 at the applied potential of 0.6 V (vs Ag/AgCl), which is much higher than that for BFO. The higher photocurrent density is attributed to the interfacial charge transfer with inhibited electron–hole recombination, which improves the water-splitting efficiency effectively. Further, the STH conversion efficiency for the water-splitting reaction under the visible-light irradiation of 100 mW·cm–2 is calculated using eq 2(55)
| 2 |
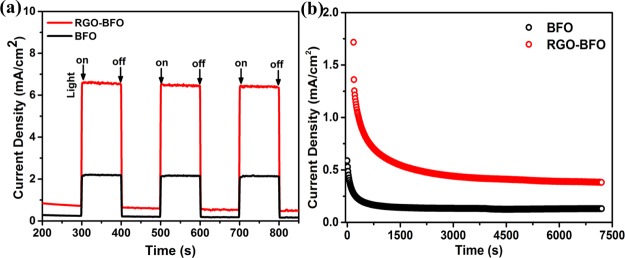
where Jp is the photocurrent density (mA·cm–2) at the applied bias, I0 is the incident light intensity of 100 mW cm–2, and Vapp is the applied potential to the PEC cell with reference to standard hydrogen electrode (vs SHE) potential. Again, Vapp = Vmea – Vaoc, where Vmea is the electrode potential (vs SHE) of the working electrode at which the photocurrent is measured under illumination and Vaoc is the electrode potential (vs SHE) at open-circuit condition under the same illumination conditions in the KOH electrolyte. The variation of η (%) has been plotted with the applied potential (V vs Ag/AgCl) as shown in Figure 7b. The maximum values of the STH efficiency are ∼3.3 and 0.75% at 0.21 V (vs Ag/AgCl) for the RGO–BFO composite and BFO nanoparticles, respectively. The performance of various catalysts toward the PEC water splitting is enlisted in Table S4 (Supporting Information). For instance, Singh et al.56 reported 2.87% STH efficiency in the BiVO4/TiO2 heterostructure. The STH efficiencies of 0.55% and 0.17% are observed for CaFe2O4–TaON57 and Fe2O3/RGO/BiV1–xMoxO4, respectively.58 Bhandary et al.59 reported 0.85% STH efficiency in α-Fe2O3–NiMnOx, whereas Chen et al.60 reported 0.08% STH efficiency in Ti/Fe2O3. Recently, we have reported significantly improved STH of 3.08% in the ternary composite of RGO–MoS2-supported NiCo2O4.61 In light of above observations, it endows with great evidence that RGO–BFO is an excellent candidate for PEC water splitting with excellent STH efficiency. The pronounced photocatalytic activity implies that the presence of the RGO sheet plays a crucial role in enhancing the electrocatalytic performance of the RGO–BFO composite. Further, the strong hybridization between C 2p states of graphene and O 2p and Fe 3d states of BFO significantly increases the electrical conductivity of RGO–BFO.62 The rationale of hybridizing BFO nanoparticles with the RGO sheet lies in the high charge carrier mobility of RGO. The enhancement in photocurrent density and STH conversion efficiency is explained on the basis of suppression of photogenerated electron–hole pair recombination. The chemical and electronic coupling between BFO and the RGO sheet as supported from XRD, XPS, and DFT studies plays a crucial role in the suppression of charge carrier recombination. The charge-transfer process is studied by measuring the charge injection efficiency at the electrode/electrolyte interfaces, estimated from the hole-scavenger measurements which regulate the ratio of the holes at the electrode/electrolyte interface injected into the electrolyte without electron–hole recombination.63,64 The charge injection efficiency is estimated by adding H2O2 as the hole scavenger in the electrolyte and calculated from the relation ηinj = jph (H2O)/jph (H2O2), where jph (H2O) and jph (H2O2) are the light-illuminated current densities without and with hole scavengers, respectively. The LSV curve in 1 M KOH and with and without H2O2 is shown in Figure 7c. The injection efficiency for RGO–BFO is 98% at 0.6 V (vs Ag/AgCl) (Figure 7d), suggesting inhibited charge recombination at the interfaces which accelerate the water oxidation kinetics and improves the PEC activity, whereas the injection efficiency for BFO is 68% at 0.6 V (vs Ag/AgCl) (Figure 7d), indicating slow kinetics of oxygen evolution and poor PEC activity as compared to RGO–BFO. The photocurrent response of BFO and RGO–BFO is recorded under light on/off condition periodically at 100 s interval at the applied bias of 0.21 V (vs Ag/AgCl), as shown in Figure 8a. The photocurrent density of RGO–BFO is much higher than that of BFO and is highly reproducible under light on/off condition demonstrating excellent stability. The stability of BFO and RGO–BFO under light illumination is further studied by the chronoamperometry (CA) measurement. The measurement is done at an applied potential of 0.21 V (vs Ag/AgCl), as shown in Figure 8b. Initially, the photocurrent density shows a higher value for both the catalysts, but after a few seconds, it attains a steady value and becomes stable during the remaining part of the measurement. Consequently, the higher and stable photocurrent density with long-term stability makes RGO–BFO a promising photocatalyst toward PEC water splitting.
Figure 7.
(a) Variation of photocurrent density with applied potential, (b) photoconversion efficiency of BFO and RGO–BFO, (c) photocurrent density vs applied potential with and without hole scavengers, and (d) charge injection efficiency with the applied potential for BFO and RGO–BFO. CA measurement at an applied voltage of 0.21 V (vs Ag/AgCl).
Figure 8.
(a) Photocurrent response of BFO and RGO–BFO under light on/off conditions and (b) CA measurement of BFO and RGO–BFO.
Figure 9 schematically depicts the possible reaction mechanism responsible for the enhanced photoelectrocatalytic activity in the RGO–BFO composite. The CB and VB potentials at the point of zero charge are estimated from the DFT study using eqs 3a and 3b, as given in the following:
| 3a |
| 3b |
where ECB and EVB are the CB and VB edge potential, respectively. X is the electronegativity of the semiconductor, which is the geometric mean of the electronegativity of the constituent atoms. Ee is the energy of free electrons on the hydrogen scale (4.5 eV), and Eg is the band gap energy of the semiconductor. When BFO is irradiated by light with sufficient energy (>2.5 eV), the photogenerated electrons (e–) at the lower energy state would get excited and jump over to the higher energy state keeping the photogenerated holes (h+) at the lower energy state. Due to the short lifetime of the photogenerated electrons at higher energy state, it comes down to the lower energy state and recombine with the photogenerated holes quickly, which results in fewer participation of electrons and holes in the photoelectrocatalytic reaction, thereby reducing the overall efficiency of BFO. However, when the BFO nanoparticles are embedded within the RGO sheet, the electronic interaction between BFO and RGO (XRD and XPS study) causes a shift in the CB edge, which decreases the band gap of RGO–BFO compared to BFO (UV–vis spectra, DFT study), facilitating the generation of excitons at lower energy. Further, the favorable pathway for the transport of photoinduced electrons from the CB of BFO to RGO increases the charge carrier concentration by hindering the recombination significantly as supported by the PL study.
Figure 9.
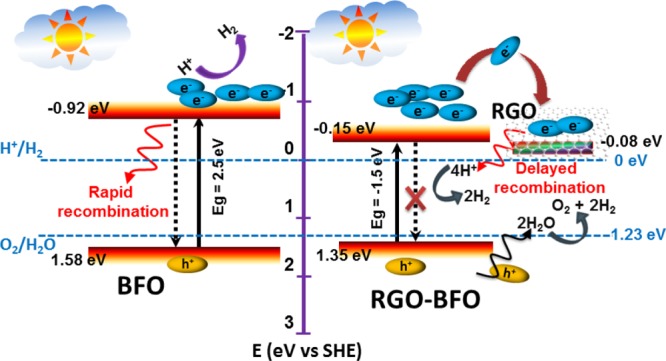
Schematic representation of the proposed mechanism of photocatalysis of BFO and RGO–BFO.
The flat band potential, VFB, of BFO and RGO–BFO is estimated by the Mott–Schottky (MS) measurement using eq 4(65,66)
| 4 |
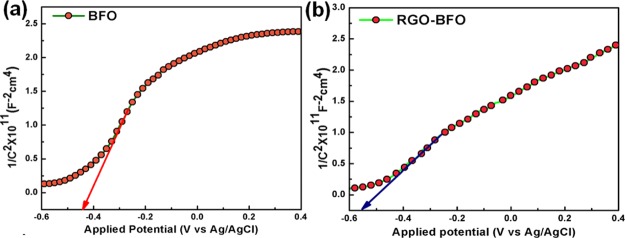
where ε is the dielectric constant, ε0 is the permittivity of the vacuum, ND is the donor density, Vapp is the applied potential, and kT/q is a constant at room temperature. The intercept of the linear plot at 1/C2 = 0 gives the flat band potential. Figure 10a,b shows the MS plot for BFO and RGO–BFO, respectively. The positive slope revealed that both the samples possess n-type conductivity. The VFB estimated from eq 4 is −0.56 V (vs Ag/AgCl) for RGO–BFO and −0.43 V (vs Ag/AgCl) for BFO.
Figure 10.
MS plot for (a) BFO and (b) RGO–BFO measured in 1 M KOH solution.
In RGO–BFO, the VFB (−0.56 V (vs Ag/AgCl)) shifted toward more negative potential than that of BFO (−0.43 V (vs Ag/AgCl)). In a recent study on BiVO4, Singh et al.67 reported improved electrocatalytic activity by creating interband states in BiVO4 and obtained more negative VFB. The flat band potential shifting in the case of RGO–BFO is quite impressive with respect to the charge-transfer kinetics. When BFO (n type) and RGO–BFO (n-type) come in contact with the redox electrolyte, which has a redox Fermi level lying below the Fermi level of both BFO and RGO–BFO, the photoinduced electron diffuses through the oxidized species of the electrolyte until the equilibrium is reached. The transfer of mobile charge carrier or the trapping of charge carriers at surface states at the interface leads to the formation of a space-charge-limited (SCL) region. The SCL region formed is called the depletion layer, and the bands bend upward toward the surface. The band bending arises because of the equilibration of two Fermi levels and is determined by the separation between the Fermi levels of RGO and the RGO–BFO catalyst and the electrolyte, as shown in Figure S9 (Supporting Information). The CB edge and VB edge potential of both the catalysts suggests larger band bending with the increase in SCL region in RGO–BFO than that in BFO. The increase in the SCL region width and hence more negative value of VFB effectively increase the charge carrier concentration that is separated and, therefore, has the potential to increase the photoelectrocatalytic activity, leading to higher STH conversion efficiency. The impedance spectra (Nyquist plot) for BFO and RGO–BFO are shown in Figure 11. The RGO–BFO composite has lower interfacial charge-transfer resistance than BFO nanoparticles, suggesting a faster electron-transfer kinetics favorable to enhanced charge carrier separation at the interface, leading to better PEC efficiency.
Figure 11.
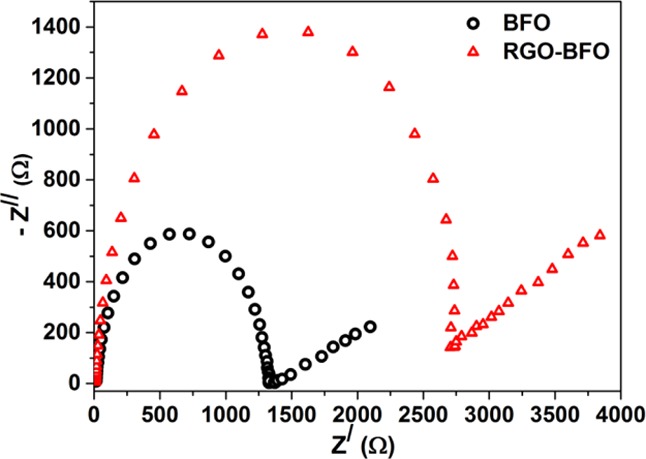
Electrochemical impedance spectroscopy (EIS) spectra of BFO and RGO–BFO.
Conclusions
A two-step chemical route is employed to synthesize BFO nanoparticles decorated onto the RGO sheet with a well-crystallized rhombohedral phase for BFO nanoparticles having an average diameter of 22.5 nm, which is established from the XRD and TEM study. The suppression of few Raman modes with the intensity ratio of D and G bands (>1) reveals the change in oxygen bonding and reduction of GO in the RGO–BFO composite. The electronic interaction between BFO and RGO is guided through the formation of Fe–O–C and Bi–O–C bonds as observed from the XPS study, which leads to the modification in band edge positions, and a subsequent decrease in the band gap of RGO–BFO than that of BFO, which is further confirmed from UV–vis and DFT studies. The modified band structure exhibits slow electron–hole recombination as reflected in the PL study and Nyquist plot. The photocatalytic degradation of RhB dye (94%) under the illumination of 120 min with a rate constant of 1.86 × 10⁻² min–1, which is 3.8 times faster than that of bare BFO, further established the efficiency of the RGO–BFO photocatalyst. The COD measurement confirmed mineralization of the organic dye in presence of the RGO–BFO photocatalyst. The remarkable improvement in the PEC performance of the RGO–BFO composite is observed in terms of photocurrent density (10.2 mA·cm–2), STH (3.3%), and hole injection efficiency (98%) at 1 V (vs Ag/AgCl). The modified band edge position of BFO in the presence of highly conducting RGO sheet favors excellent charge transport, suppresses the recombination, and leads to the higher photocatalytic activity and excellent stability in the RGO–BFO composite toward photoelectrocatalytic water splitting compared to that available in the literature.
Experimental Section
Sample Preparation
BFO nanoparticles were prepared according to the modified Pechini method.68 Typically, an equimolar (0.015 M) amount of bismuth nitrate pentahydrate and iron nitrate nonahydrate was added successively to 30 mL ethylene glycol (EG) under vigorous stirring. The mixture became transparent upon evaporation of excess EG at 80 °C. Then, few drops of HNO3 (69%) was added to the above solution to maintain at pH ≈ 1. Tartaric acid of 0.03 M was added to the solution as a complexing agent. The solution was heated at 130 °C to obtain the polyester precursor powder. The dry powder was calcined at 400, 500, and 600 °C for 1 h to obtain the desired phase.
In order to introduce the BFO nanoparticles into the RGO sheet, 40 mg of BFO nanoparticle and 40 mg of GO, prepared according to modified Hummer’s method, were mixed with 100 mL ultrapure water under ultrasonic irradiation (30 ± 3 kHz) in a bath for 40 h at 40 °C. One milliliter of hydrazine hydrate was added to the solution as the reducing agent. The final solution was dried on a hot plate at 70 °C for 10 h and collected by centrifugation. Finally, the sample was dried overnight at 50 °C.
Material Characterization
The formation of the BFO phase and the RGO–BFO composite was confirmed by the XRD study. The X-ray scan of the samples was recorded by a Rigaku Miniflex 600 X-ray diffractometer using Cu Kα (λ = 1.5418 Å) radiation operated at 40 mA and 40 kV at a scanning rate of 0.02° s–1 in the 2θ range of 10°–80°. The HRTEM study was done to estimate the particle size and shape, crystallinity, and attachment of BFO to RGO. The TEM images were taken using an FEI-Technai-G20 instrument at an accelerating voltage of 200 kV. The sample for the TEM study was prepared by grinding with an agate mortar and dispersing ultrasonically in water in order to ensure maximum dispersion of the samples. One drop of the dispersion was cast on a 300-mesh Cu grid, coated with a lacy carbon film to avoid agglomeration of the samples on the grid. The sample was then dried overnight at room temperature prior to HRTEM measurement. To study the local structure within the sample, Raman analysis was done on an inVia Raman microscope under excitation by 514 nm argon ion laser pulse from 100 to 1800 cm–1. To understand the optical behavior of the samples, the measurements were carried out using a UV–visible spectrophotometer (PerkinElmer Lambda 35) and a PL spectrophotometer (Hitachi fluorescence spectrophotometer (F-2500)) in the wavelength range 250–800 nm. An XPS study was carried out to determine the various oxidation states of BFO and RGO–BFO. A Thermo VG Scientific Theta Probe (VG Scientific ESCALAB 250) with an Al Kα target and 1486.6 eV energy at 15 kW power was used for recording the XPS data.
Photocatalytic Test
The photocatalytic performance was evaluated by the degradation of RhB in aqueous solution under visible-light irradiation using a 500 W Xe lamp. Hundred milliliters of RhB (5 mg/L) solution was added to a flask containing 30 mg of the photocatalyst. The reaction temperature was kept at room temperature in an ice bath to inhibit the thermal catalytic effect. After a desired period of exposure to visible light, a small quantity of the solution was taken out, and the concentration of RhB was determined by measuring the absorbance at 553 nm using a UV–vis spectrophotometer. The sample solution was centrifuged at 4000 rpm·min–1 for 10 min to separate the BFO and RGO–BFO powder from the solution prior to the UV–vis spectrophotometer measurement. All the solutions were mixed homogeneously through magnetic stirring in dark for 120 min prior to photocatalytic measurements to achieve the adsorption–desorption equilibrium between the photocatalyst and RhB. The above experiments were repeated for dark response. COD was measured by using a Uniphos COD analyzer. The sample was prepared by taking potassium dichromate with H2SO4 as an oxidizer, and the test solution (2 mL) was added to it. The final solution was digested for 2 h at 150 °C and kept for a while to attain the room temperature, and the COD value was measured.
Electrochemical Characterization
For the electrochemical measurement of BFO and RGO–BFO activity, the photocatalyst slurry was prepared by dispersing 5 mg of catalysts in Nafion (5 wt %)/ethanol solution. The slurry was subjected to vigorous ultrasonication for 30 min to obtain a homogeneous mixture. The dispersed slurry was cast onto the indium tin oxide substrate. An Ohmic electrical contact was made using a silver paste and a copper wire. The exposed area was fixed to 1 cm2 by covering it with a nontransparent and nonconducting epoxy resin. A platinum plate was used as the counter electrode, Ag/AgCl (sat KCl) was used as the reference electrode, and 1 M KOH was used as the electrolyte. The electrochemical measurements, current–voltage (I–V) characteristics, MS, EIS, and CA were carried out in a three-electrode PEC cell. The measurement was controlled using the CIMPS-2 (controlled intensity modulated photospectroscopy) system of Zennium Electrochemical Workstation (X-Pot Potentiostat). The LSV measurement was carried out under dark and visible-light illumination, where illumination was made using a 150 W xenon lamp fitted with a filter that cuts light of wavelengths ≤380 nm (380–800 nm) and having an output intensity of 100 mW·cm–2. The MS measurements were carried out under dark condition. The EIS measurement was carried out in the frequency range of 100 MHz to 100 kHz with an ac signal amplitude of 10 mV under open bias condition. The PEC stability of the samples was performed by the CA measurement in 1 M KOH under visible-light irradiation.
Computational Methodology
Ab initio calculations based on DFT were performed to obtain the electronic density of states (DOSs) of BFO, RGO, and BFO–RGO combined structure. Calculations were performed using DMol3 module of BIOVIA Material Studio. For the geometry optimization of BFO, RGO, and BFO–RGO structures, the generalized gradient approximation was used as an exchange correlation functional, which is parameterized by Perdew, Burke, and Ernzerhof. All calculations have been performed using unrestricted spin polarization. The atomic orbitals were modeled using double numerical pulse d-functions (DND) basis set of version 4.4 with an orbital cutoff of 5.8 Å. Monkhorst–Pack k-points with a grid of 3 × 3 × 3 were used to perform the integration in the first Brillouin zone to calculate the DOSs of BFO, RGO, and BFO–RGO. The geometry optimizations were well-converged with the convergence criteria for total energy, maximum force, maximum displacement, and self-consistent field density of 2.7 × 10⁻⁵ eV, 0.054 eV/Å, 0.005 Å, and 10–6, respectively. In this study, BFO with a rhombohedral perovskite-type structure having a space group of R3c and reduced graphene superlattice were used to calculate the band gap and electronic DOSs. The tolerance to band energy was used up to 10–5 eV.
Acknowledgments
The authors would like to acknowledge the financial support of Department of Science and Technology (DST) and facility supports from the Nanoscale Research Facility, IIT, Delhi and National Taiwan University of Science and Technology (NTUST). A.M. (PDF/2016/003476) and S.C. (PDF/2015/000025) are thankful to Science and Engineering Research Board (SERB) for providing NPDF.
Supporting Information Available
The Supporting Information is available free of charge on the ACS Publications website at DOI: 10.1021/acsomega.8b00708.
XRD pattern of BFO calcined at 400, 500, and 600 °C; rhombohedral cage of BFO and RGO–BFO;HRTEM image of BFO; SAED pattern of BFO; O 1s core-level electron of BFO; Tauc plot for determining the band gap of BFO and RGO–BFO; degradation of UV–vis spectra of RhB over RGO–BFO; photocatalytic degradation efficiency of RhB without and with RGO–BFO; pseudo-first-order rate constant for the photodecomposition; energy diagram of RhB, RGO, and BFO; percentage degradation of the RhB dye in terms of COD values with time for different RGO and RGO–BFO; schematic diagram of band bending for BFO and RGO–BFO in 1 M KOH electrolyte; Rietveld refinement parameters of BFO and RGO–BFO; various Raman modes observed in BFO; performance comparison of different catalysts including RGO–BFO for the degradation of various organic contaminants; and performance comparison of various catalysts including RGO–BFO for PEC water splitting (PDF)
The authors declare no competing financial interest.
Supplementary Material
References
- Hu Z.-T.; Chen Z.; Goei R.; Wu W.; Lim T.-T. Magnetically Recyclable Bi/Fe-Based Hierarchical Nanostructures via Self-Assembly for Environmental Decontamination. Nanoscale 2016, 8, 12736–12746. 10.1039/c6nr03677e. [DOI] [PubMed] [Google Scholar]
- Kaur M.; Yadav K. L.; Uniyal P. Multiferroic and Optical Studies on the Effects of Ba 2 + Ions in BiFeO 3 Nanoparticles. J. Mater. Sci.: Mater. Electron. 2016, 27, 4475–4482. 10.1007/s10854-016-4320-0. [DOI] [Google Scholar]
- Mukherjee A.; Basu S.. Direct Hydrocarbon Low-Temperature Fuel Cell; Wiley-VCH, 2017. [Google Scholar]
- Shahrokhian S.; Rezaee S. Fabrication of Trimetallic Pt–Pd–Co Porous Nanostructures on Reduced Graphene Oxide by Galvanic Replacement: Application to Electrocatalytic Oxidation of Ethylene Glycol. Electroanalysis 2017, 29, 2591–2601. 10.1002/elan.201700355. [DOI] [Google Scholar]
- Kumari N.; Tiwari P. K.; Ali Haider M.; Basu S. Electrochemical Performance of Infiltrated Cu-GDC and Cu-PDC Cathode for CO2 Electrolysis in a Solid Oxide Cell.. ECS Trans. 2017, 78, 3329–3337. 10.1149/07801.3329ecst. [DOI] [Google Scholar]
- Xu H.; Song P.; Wang J.; Shiraishi Y.; Du Y.; Liu Q. Visible-Light-Driven 3D Dendritic PtAu@Pt Core–Shell Photocatalyst toward Liquid Fuel Electrooxidation. ACS Sustainable Chem. Eng. 2018, 6, 7159–7167. 10.1021/acssuschemeng.8b01228. [DOI] [Google Scholar]
- Xu H.; Song P.; Yan B.; Wang J.; Guo J.; Du Y. Surface-Plasmon-Enhanced Photo-Electrocatalytic Ethylene Glycol Oxidation Based on Highly Open AuAg Nanobowls. ACS Sustainable Chem. Eng. 2018, 6, 4138–4146. 10.1021/acssuschemeng.7b04560. [DOI] [Google Scholar]
- Xu H.; Song P.; Wang J.; Gao F.; Zhang Y.; Guo J.; Du Y.; Di J. Visible-Light-Improved Catalytic Performance for Methanol Oxidation Based on Plasmonic PtAu Dendrites. ChemElectroChem 2018, 5, 1191–1196. 10.1002/celc.201701345. [DOI] [Google Scholar]
- Zhu M.; Kim S.; Mao L.; Fujitsuka M.; Zhang J.; Wang X.; Majima T. Metal-Free Photocatalyst for H2Evolution in Visible to Near-Infrared Region: Black Phosphorus/Graphitic Carbon Nitride. J. Am. Chem. Soc. 2017, 139, 13234–13242. 10.1021/jacs.7b08416. [DOI] [PubMed] [Google Scholar]
- Zhu M.; Cai X.; Fujitsuka M.; Zhang M.; Majima T. Au/La2Ti2O7 Nanostructures Sensitized with Black Phosphorus for Plasmon-Enhanced Photocatalytic Hydrogen Production in Visible and Near-Infrared Light. Angew. Chem. 2017, 56, 2064–2068. 10.1002/anie.201612315. [DOI] [PubMed] [Google Scholar]
- Mukherjee A.; Chakrabarty S.; Su W.-N.; Basu S. Nanostructured Nickel Ferrite Embedded in Reduced Graphene Oxide for Electrocatalytic Hydrogen Evolution Reaction. Mater. Today Energy 2018, 8, 118–124. 10.1016/j.mtener.2018.03.004. [DOI] [Google Scholar]
- Kush P.; Deori K.; Kumar A.; Deka S. Efficient Hydrogen/Oxygen Evolution and Photocatalytic Dye Degradation and Reduction of Aqueous Cr(vi) by Surfactant Free Hydrophilic Cu2ZnSnS4 Nanoparticles. J. Mater. Chem. A 2015, 3, 8098–8106. 10.1039/c4ta06551d. [DOI] [Google Scholar]
- Ni M.; Leung M. K. H.; Leung D. Y. C.; Sumathy K. A Review and Recent Developments in Photocatalytic Water-Splitting Using TiO 2 for Hydrogen Production. Renewable Sustainable Energy Rev. 2007, 11, 401–425. 10.1016/j.rser.2005.01.009. [DOI] [Google Scholar]
- Vaiano V.; Sacco O.; Sannino D.; Ciambelli P. Photocatalytic Removal of Spiramycin from Wastewater under Visible Light with N-Doped TiO 2 Photocatalysts. Chem. Eng. J. 2015, 261, 3–8. 10.1016/j.cej.2014.02.071. [DOI] [Google Scholar]
- Mahalakshmi S.; Ragavendran V. Optical and Structural Studies of BaTiO 3 and SrTio 3. J. Nanosci. Nanotechnol. 2014, 2, 735–738. [Google Scholar]
- An J.; Zhu L.; Wang N.; Song Z.; Yang Z.; Du D.; Tang H. Photo-Fenton like Degradation of Tetrabromobisphenol A with Graphene A BiFeO 3 Composite as a Catalyst. Chem. Eng. J. 2013, 219, 225–237. 10.1016/j.cej.2013.01.013. [DOI] [Google Scholar]
- Neppolian B.; Kim Y.; Ashokkumar M.; Yamashita H.; Choi H. Preparation and Properties of Visible Light Responsive ZrTiO 4/Bi 2 O 3 Photocatalysts for 4-Chlorophenol Decomposition. J. Hazard. Mater. 2010, 182, 557–562. 10.1016/j.jhazmat.2010.06.069. [DOI] [PubMed] [Google Scholar]
- Guan M.-L.; Ma D.-K.; Hu S.-W.; Chen Y.-J.; Huang S.-M. From Hollow Olive-Shaped BiVO 4 to n - p Core - Shell BiVO 4 @ Bi 2 O 3 Microspheres: Controlled Synthesis and Enhanced Visible-Light-Responsive Photocatalytic Properties. Inorg. Chem. 2011, 50, 800–805. 10.1021/ic101961z. [DOI] [PubMed] [Google Scholar]
- Alexe M.; Hesse D. Tip-Enhanced Photovoltaic Effects in Bismuth Ferrite. Nat. Commun. 2011, 2, 256. 10.1038/ncomms1261. [DOI] [Google Scholar]
- Gao F.; Chen X. Y.; Yin K. B.; Dong S.; Ren Z. F.; Yuan F.; Yu T.; Zou Z. G. Visible-Light Photocatalytic Properties of Weak Magnetic BiFeO3 Nanoparticles. Adv. Mater. 2007, 19, 2889–2892. 10.1002/adma.200602377. [DOI] [Google Scholar]
- Catalan P.; Scott J. F. Physics and Applications of Bismuth Ferrite. Adv. Mater. 2009, 21, 2463–2485. 10.1002/adma.200802849. [DOI] [Google Scholar]
- Zhang X.; Lv J.; Bourgeois L.; Cui J.; Wu Y. Formation and Photocatalytic Properties of Bismuth Ferrite Submicrocrystals with Tunable Morphologies. New J. Chem. 2011, 35, 937–941. 10.1039/c1nj00008j. [DOI] [Google Scholar]
- Kong J.; Rui Z.; Wang X.; Ji H.; Tong Y. Visible-Light Decomposition of Gaseous Toluene over BiFeO 3 −(Bi/Fe) 2 O 3 Heterojunctions with Enhanced Performance. Chem. Eng. J. 2016, 302, 552–559. 10.1016/j.cej.2016.05.100. [DOI] [Google Scholar]
- Sun A.; Chen H.; Song C.; Jiang F.; Wang X.; Fu Y. Magnetic Bi25FeO40-Graphene Catalyst and Its High Visible-Light Photocatalytic Performance. RSC Adv. 2013, 3, 4332–4340. 10.1039/c3ra22626c. [DOI] [Google Scholar]
- Kumar M. M.; Palkar V. R.; Srinivas K.; Suryanarayana S. V. Ferroelectricity in a Pure Ceramic Ferroelectricity in a Pure BiFeO 3 Ceramic. Appl. Phys. Lett. 2000, 76, 2764. 10.1063/1.126468. [DOI] [Google Scholar]
- Maître A.; François M.; Gachon J. C. Experimental Study of the Bi2O3 -Fe2O3 Pseudo-Binary System. J. Phase Equilib. Diffus. 2004, 25, 59–67. 10.1007/s11669-004-0171-0. [DOI] [Google Scholar]
- Moreau J. M.; Michel C.; Gerson R.; James W. J. Ferroelectric BiFeO3 X-Ray and Neutron Diffraction Study. J. Phys. Chem. Solids 1971, 32, 1315–1320. 10.1016/s0022-3697(71)80189-0. [DOI] [Google Scholar]
- Mukherjee A.; Basu S.; Manna P. K.; Yusuf S. M.; Pal M. Giant Magnetodielectric and Enhanced Multiferroic Properties of Sm Doped Bismuth Ferrite Nanoparticles. J. Mater. Chem. C 2014, 2, 5885–5891. 10.1039/c4tc00591k. [DOI] [Google Scholar]
- Guo R.; Fang L.; Dong W.; Zheng F.; Shen M. Enhanced Photocatalytic Activity and Ferromagnetism in Gd Doped BiFeO 3 Nanoparticles. J. Phys. Chem. C 2010, 114, 21390–21396. 10.1021/jp104660a. [DOI] [Google Scholar]
- Zhang Z.; Wang W.; Wang L.; Sun S. Enhancement of Visible-Light Photocatalysis by Coupling with Narrow-Band-Gap Semiconductor: A Case Study on Bi 2 S 3/Bi 2 WO 6. ACS Appl. Mater. Interfaces 2012, 4, 593–597. 10.1021/am2017199. [DOI] [PubMed] [Google Scholar]
- Li S.; Lin Y.-H.; Zhang B.-P.; Li J.-F.; Nan C.-W. BiFeO 3/TiO 2 Core-Shell Structured Nanocomposites as Visible-Active Photocatalysts and Their Optical Response Mechanism. J. Appl. Phys. 2009, 105, 054310. 10.1063/1.3091286. [DOI] [Google Scholar]
- Soltani T.; Lee B.-K. Sono-Synthesis of Nanocrystallized BiFeO 3/Reduced Graphene Oxide Composites for Visible Photocatalytic Degradation Improvement of Bisphenol A. Chem. Eng. J. 2016, 306, 204–213. 10.1016/j.cej.2016.07.051. [DOI] [Google Scholar]
- Xian T.; Yang H.; Di L. J.; Dai J. F. Graphene-Assisted Enhancement of Photocatalytic Activity of Bismuth Ferrite Nanoparticles. Res. Chem. Intermed. 2015, 41, 433–441. 10.1007/s11164-013-1204-2. [DOI] [Google Scholar]
- Li Z.; Shen Y.; Yang C.; Lei Y.; Guan Y.; Lin Y.; Liu D.; Nan C.-W. Significant Enhancement in the Visible Light Photocatalytic Properties of BiFeO3–graphene Nanohybrids. J. Mater. Chem. A 2013, 1, 823–829. 10.1039/c2ta00141a. [DOI] [Google Scholar]
- Joshi U. A.; Jang J. S.; Borse P. H.; Lee J. S. Microwave Synthesis of Single-Crystalline Perovskite BiFeO3 Nanocubes for Photoelectrode and Photocatalytic Applications. Appl. Phys. Lett. 2008, 92, 242106. 10.1063/1.2946486. [DOI] [Google Scholar]
- Gao F.; Yuan Y.; Wang K. F.; Chen X. Y.; Chen F.; Liu J.-M.; Ren Z. F. Preparation and Photoabsorption Characterization BiFeO 3 Nanowires. Appl. Phys. Lett. 2006, 89, 102506. 10.1063/1.2345825. [DOI] [Google Scholar]
- Haumont R.; Kreisel J.; Bouvier P.; Hippert F. Phonon Anomalies and the Ferroelectric Phase Transition in Multiferroic BiFeO 3. Phys. Rev. B: Condens. Matter Mater. Phys. 2006, 73, 132101. 10.1103/physrevb.73.132101. [DOI] [Google Scholar]
- Hermet P.; Goffinet M.; Kreisel J.; Ghosez P. Raman and Infrared Spectra of Multiferroic Bismuth Ferrite from First Principles. Phys. Rev. B: Condens. Matter Mater. Phys. 2007, 75, 220102. 10.1103/physrevb.75.220102. [DOI] [Google Scholar]
- Yuan G. L.; Or S. W.; Chanz H. L. W.; Liu Z. G. Reduced Ferroelectric Coercivity in Multiferroic Bi0.825Nd0.175FeO3 Thin Film. J. Appl. Phys. 2007, 101, 024106. 10.1063/1.2423228. [DOI] [Google Scholar]
- Kothari D.; Reddy V. R.; Sathe V. G.; Gupta A.; Banerjee A.; Awasthi A. M. Raman Scattering Study of Polycrystalline Magnetoelectric BiFeO 3. J. Magn. Magn. Mater. 2008, 320, 548–552. 10.1016/j.jmmm.2007.07.016. [DOI] [Google Scholar]
- Fu X.; Bei F.; Wang X.; O’Brien S.; Lombardi J. R. Excitation Profile of Surface-Enhanced Raman Scattering in Graphene–Metal Nanoparticle Based Derivatives. Nanoscale 2010, 2, 1461–1466. 10.1039/c0nr00135j. [DOI] [PubMed] [Google Scholar]
- Ren Y.; Nan F.; You L.; Zhou Y.; Wang Y.; Wang J.; Su X.; Shen M.; Fang L. Enhanced Photoelectrochemical Performance in Reduced Graphene Oxide/BiFeO3 Heterostructures. Small 2017, 13, 1603457. 10.1002/smll.201603457. [DOI] [PubMed] [Google Scholar]
- Moitra D.; Ghosh B. K.; Chandel M.; Ghosh N. N. Synthesis of a BiFeO3 Nanowire-Reduced Graphene Oxide Based Magnetically Separable Nanocatalyst and Its Versatile Catalytic Activity towards Multiple Organic Reactions. RSC Adv. 2016, 6, 97941–97952. 10.1039/c6ra22077k. [DOI] [Google Scholar]
- Quickel T. E.; Schelhas L. T.; Farrell R. A.; Petkov N.; Le V. H.; Tolbert S. H. Mesoporous Bismuth Ferrite with Amplified Magnetoelectric Coupling and Electric Field-Induced Ferrimagnetism. Nat. Commun. 2015, 6, 6562. 10.1038/ncomms7562. [DOI] [PubMed] [Google Scholar]
- Zhao J.; Yang Y.; Dong X.; Ma Q.; Yu W.; Wang J. Electrospinning Construction of Bi2WO6/RGO Composite Nanofibers with Significantly Enhanced Photocatalytic Water Splitting Activity. RSC Adv. 2016, 6, 64741–64748. 10.1039/c6ra09720k. [DOI] [Google Scholar]
- Luo Y.; Luo J.; Zhou W.; Qi X.; Zhang H. Controlled Synthesis of Hierarchical Graphene-Wrapped TiO2@Co3O4 Coaxial Nanobelt Arrays for High-Performance Lithium Storage. J. Mater. Chem. A 2013, 1, 273–281. 10.1039/c2ta00064d. [DOI] [Google Scholar]
- Sun Y.; Hu X.; Luo W.; Huang Y. Self-Assembled Hierarchical MoO 2/Graphene Nanoarchitectures and Their Application as a High-Performance Anode Material for Lithium-Ion. ACS Nano 2011, 5, 7100–7107. 10.1021/nn201802c. [DOI] [PubMed] [Google Scholar]
- Mukherjee A.; Hossain S. M.; Pal M.; Basu S. Effect of Y-Doping on Optical Properties of Multiferroics BiFeO3 Nanoparticles. Appl. Nanosci. 2012, 2, 305–310. 10.1007/s13204-012-0114-8. [DOI] [Google Scholar]
- Moitra D.; Dhole S.; Ghosh B. K.; Chandel M.; Jani R. K.; Patra M. K.; Vadera S. R.; Ghosh N. N. Synthesis and Microwave Absorption Properties of BiFeO 3 Nanowire-RGO Nanocomposite and First-Principles Calculations for Insight of Electromagnetic Properties and Electronic Structures. J. Phys. Chem. C 2017, 121, 21290–21304. 10.1021/acs.jpcc.7b02836. [DOI] [Google Scholar]
- Duan Y.; Liu J.; Zhang Y.; Wang T. First-Principles Calculations of Graphene-Based Polyaniline Nano-Hybrids for Insight of Electromagnetic Properties and Electronic Structures. RSC Adv. 2016, 6, 73915–73923. 10.1039/c6ra17080c. [DOI] [Google Scholar]
- Seger B.; Kamat P. V. Electrocatalytically Active Graphene-Platinum Nanocomposites. Role of 2-D Carbon Support in PEM Fuel Cells. J. Phys. Chem. C 2009, 113, 7990–7995. 10.1021/jp900360k. [DOI] [Google Scholar]
- Li Z.; Shen Y.; Guan Y.; Hu Y.; Lin Y.; Nan C.-W. Bandgap Engineering and Enhanced Interface Coupling of Graphene–BiFeO3 Nanocomposites as Efficient Photocatalysts under Visible Light. J. Mater. Chem. A 2014, 2, 1967–1973. 10.1039/c3ta14269h. [DOI] [Google Scholar]
- Zhang J.; Xiong Z.; Zhao X. S. Graphene–metal–oxide Composites for the Degradation of Dyes under Visible Light Irradiation. J. Mater. Chem. 2011, 21, 3634–3640. 10.1039/c0jm03827j. [DOI] [Google Scholar]
- Karthik P.; Vinoth R.; Zhang P.; Choi W.; Balaraman E.; Neppolian B. Π–π Interaction Between Metal–Organic Framework and Reduced Graphene Oxide for Visible-Light Photocatalytic H 2 Production. ACS Appl. Energy Mater. 2018, 1, 1913–1923. 10.1021/acsaem.7b00245. [DOI] [Google Scholar]
- Rajeshwar K. Hydrogen Generation at Irradiated Oxide Semiconductor–Solution Interfaces. J. Appl. Electrochem. 2007, 37, 765–787. 10.1007/s10800-007-9333-1. [DOI] [Google Scholar]
- Singh A. P.; Kodan N.; Mehta B. R.; Held A.; Mayrhofer L.; Moseler M. Band Edge Engineering in BiVO4/TiO2 Heterostructure: Enhanced Photoelectrochemical Performance through Improved Charge Transfer. ACS Catal. 2016, 6, 5311–5318. 10.1021/acscatal.6b00956. [DOI] [Google Scholar]
- Kim E. S.; Nishimura N.; Magesh G.; Kim J. Y.; Jang J.-W.; Jun H.; Kubota J.; Domen K.; Lee J. S. Fabrication of CaFe2O4/TaON Heterojunction Photoanode for Photoelectrochemical Water Oxidation. J. Am. Chem. Soc. 2013, 135, 5375–5383. 10.1021/ja308723w. [DOI] [PubMed] [Google Scholar]
- Hou Y.; Zuo F.; Dagg A.; Feng P. Visible Light-Driven a-Fe2O3 Nanorod/Graphene/BiV1- XMoxO4 Core/Shell Heterojunction Array for Efficient Photoelectrochemical Water Splitting. Nano Lett. 2012, 12, 6464–6473. 10.1021/nl303961c. [DOI] [PubMed] [Google Scholar]
- Bhandary N.; Singh A. P.; Ingole P. P.; Basu S. Enhanced Photoelectrochemical Performance of Electrodeposited Hematite Films Decorated with Nanostructured NiMnOX.. RSC Adv. 2016, 6, 35239–35247. 10.1039/c6ra03984g. [DOI] [Google Scholar]
- Chen Y.-J.; Chen L.-Y. The Study of Carrier Transfer Mechanism for Nanostructural Hematite Photoanode for Solar Water Splitting. Appl. Energy 2016, 164, 924–933. 10.1016/j.apenergy.2015.08.105. [DOI] [Google Scholar]
- Chakrabarty S.; Mukherjee A.; Basu S. RGO-MoS 2 Supported NiCo 2 O 4 Catalyst toward Solar Water Splitting and Dye Degradation. ACS Sustainable Chem. Eng. 2018, 6, 5238–5247. 10.1021/acssuschemeng.7b04757. [DOI] [Google Scholar]
- Moitra D.; Anand C.; Ghosh B. K.; Chandel M.; Ghosh N. N. One-Dimensional BiFeO 3 Nanowire-Reduced Graphene Oxide Nanocomposite as Excellent Supercapacitor Electrode Material. ACS Appl. Energy Mater. 2018, 1, 464–474. 10.1021/acsaem.7b00097. [DOI] [Google Scholar]
- Cheng B.-Y.; Yang J.-S.; Cho H.-W.; Wu J.-J. Fabrication of an Efficient BiVO 4 −TiO 2 Heterojunction Photoanode for Photoelectrochemical Water Oxidation. ACS Appl. Mater. Interfaces 2016, 8, 20032–20039. 10.1021/acsami.6b05489. [DOI] [PubMed] [Google Scholar]
- Fan W.; Li C.; Bai H.; Zhao Y.; Luo B.; Li Y.; Ge Y.; Shi W.; Li H. An in Situ Photoelectroreduction Approach to Fabricate Bi/BiOCl Heterostructure Photocathodes: Understanding the Role of Bi Metal for Solar Water Splitting. J. Mater. Chem. A 2017, 5, 4894–4903. 10.1039/c6ta11059b. [DOI] [Google Scholar]
- Liu Y.; Yu Y.-X.; Zhang W.-D. Photoelectrochemical Properties of Ni-Doped Fe 2 O 3 Thin Films Prepared by Electrodeposition. Electrochim. Acta 2012, 59, 121–127. 10.1016/j.electacta.2011.10.051. [DOI] [Google Scholar]
- Belhadi A.; Boumaza S.; Trari M. Photoassisted Hydrogen Production under Visible Light over NiO/ZnO Hetero-System. Appl. Energy 2011, 88, 4490–4495. 10.1016/j.apenergy.2011.05.044. [DOI] [Google Scholar]
- Singh A. P.; Kodan N.; Dey A.; Krishnamurthy S.; Mehta B. R. ScienceDirect Improvement in the Structural, Optical, Electronic and Photoelectrochemical Properties of Hydrogen Treated Bismuth Vanadate Thin Films. Int. J. Hydrogen Energy 2015, 40, 4311–4319. 10.1016/j.ijhydene.2015.01.085. [DOI] [Google Scholar]
- Mukherjee A.; Basu S.; Manna P. K.; Yusuf S. M.; Pal M. Enhancement of Multiferroic Properties of Nanocrystalline BiFeO3 Powder by Gd-Doping. J. Alloys Compd. 2014, 598, 142–150. 10.1016/j.jallcom.2014.01.245. [DOI] [Google Scholar]
Associated Data
This section collects any data citations, data availability statements, or supplementary materials included in this article.


