

Phylogenetic analysis is used to identify transmission chains, but no software is available for the automated partition of large phylogenies. Prosperiet al. apply a new search algorithm to identify transmission clusters within the phylogeny of HIV-1gene sequences linking molecular and epidemiological data.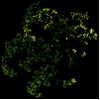
Supplementary information
The online version of this article (doi:10.1038/ncomms1325) contains supplementary material, which is available to authorized users.
Subject terms: Phylogeny, Viral transmission, Medical research
Abstract
Understanding the determinants of virus transmission is a fundamental step for effective design of screening and intervention strategies to control viral epidemics. Phylogenetic analysis can be a valid approach for the identification of transmission chains, and very-large data sets can be analysed through parallel computation. Here we propose and validate a new methodology for the partition of large-scale phylogenies and the inference of transmission clusters. This approach, on the basis of a depth-first search algorithm, conjugates the evaluation of node reliability, tree topology and patristic distance analysis. The method has been applied to identify transmission clusters of a phylogeny of 11,541 human immunodeficiency virus-1 subtype B pol gene sequences from a large Italian cohort. Molecular transmission chains were characterized by means of different clinical/demographic factors, such as the interaction between male homosexuals and male heterosexuals. Our method takes an advantage of a flexible notion of transmission cluster and can become a general framework to analyse other epidemics.
Supplementary information
The online version of this article (doi:10.1038/ncomms1325) contains supplementary material, which is available to authorized users.
Introduction
The spread of type-1 human immunodeficiency virus (HIV-1) infection is influenced by a long duration of the asymptomatic stage, a high viral evolutionary and replication rate, as well as population movements, social behaviour and geopolitical factors such as infrastructure development and accessibility1,2. Phylogenetic analysis can be used to investigate HIV-1 transmission events, although the long period of infectivity, coupled with often non-uniform spatial and temporal sampling, can limit its efficiency in tracing the infection chains3,4,5.
Several epidemiological factors, for example the mode of HIV-1 transmission or the disease stage, might be associated to different transmission lineages. Antiretroviral therapy (ART) usually suppresses HIV-1 replication, reducing the probability of virus transmission6,7,8. Drug-resistant strains can be selected by ART exposure, and transmitted from patients failing ART or from drug-naive patients already carrying a drug-resistant virus9,10. Given the decreasing prevalence of virological failures among HIV-1-infected patients and of viraemic patients carrying drug resistance over time11, a greater proportion of transmitted resistance may be derived from ART-naive subjects12,13,14.
Transmission clusters among HIV-1-infected patients have been inferred and analysed across various study cohorts, including the United Kingdom15,16,17,18, Switzerland19,20, Canada21 and the Netherlands22. Nowadays, parallel computation techniques permit the estimation of highly resolved phylogenies for large populations20. However, the partition of phylogenetic trees23,24 is a challenging task and there is not yet an established automated consensus methodology to identify transmission clusters, particularly when considering large-scale phylogenies. Furthermore, the definition of a transmission cluster itself is not standardized15,16,17,18,19,20,21,22. Transmission clusters have been associated to sub-trees of phylogenies containing sequences from at least x distinct subjects15,16,17,18,19,20,21,22 (from a minimum of two patients to more than ten patients) with a sub-tree reliability of ≥ y% (usually bootstrap support or posterior probability, ranging from 80 to 99%21,18). Geographical constraints, that is, ≥ z% of sequences from the same country in a cluster (usually z ≥ 80%), have been also introduced20. Often, unrelated viral strains from different countries are added as controls, and clusters are identified by visually inspecting an initial tree or by re-estimating smaller trees after reducing the original data set15,17. Cluster selection based on absolute genetic15,17 and patristic18,21 distance values has also been used.
This work proposes a new approach for the automated partition of large phylogenies, by introducing a flexible (yet statistically robust) definition of a transmission cluster, which fits also the previously introduced definitions. The method is then applied for identifying transmission clusters within the HIV-1 subtype B epidemic in Italy. Data were drawn from the Antiretroviral Resistance Cohort Analysis (ARCA), a national observational cohort of HIV-1-infected patients (http://www.hivarca.net) followed up at 105 clinical centres. At the time of this study, data from >20,000 patients and >23,000 HIV-1 pol gene sequences were available. A phylogeny on the Italian HIV-1 subtype B isolates was estimated by parallel computation and, after applying the new partition method, clustering was linked with patients' demographic and clinical information. As a result, several factors associated with transmission chains were identified, suggesting strategies to monitor the epidemic. The methodology proposed here provides a general and robust framework for analysing large-scale phylogenies that can be applied in investigating the molecular epidemiology and the intra-host evolutionary patterns of a broad range of pathogens.
Results
Automated partition of phylogenetic trees
The definition of transmission cluster introduced here requires a rooted phylogeny and assumes that two or more patients belong to a potential transmission cluster if their viral sequences are monophyletic and more closely related than those from two randomly selected individuals. The meaning of 'more closely related' refers to the comparison with a distance threshold formally defined as follows.
Given a rooted phylogeny, the distribution of all patristic distances between pairs of taxa (whole-tree distribution) and the distribution of all pairwise patristic distances within any sub-tree (sub-tree distribution) are defined. Then, a specific sub-tree is classified as a transmission cluster if the median value of its distance distribution is below a t-percentile threshold (which needs to be properly tuned, see below) of the whole-tree distribution.
As complimentary constraints, a sub-tree is considered to be eligible as transmission cluster only if it contains sequences from ≥2 subjects and has a reliability ≥90%. It is important to notice that both the threshold (either t-percentile of the whole-tree distribution or a specific cutoff value) and the other constraints can easily be modified so that they conform to previously introduced definitions.
To extract clusters from a phylogeny, a depth-first algorithm was used, which is a general strategy for traversing a graph or a tree. In brief, after calculating the whole-tree distance distribution, the depth-first (Fig. 1) starts from a root node and moves into a sub-tree, checking its reliability, number of leaves and calculating the sub-tree distribution. If the clustering conditions are not met, the algorithm goes deeper into another child sub-tree, otherwise it stops, and the leaves of the current sub-tree are placed in a cluster. Then the search restarts from the most recent sub-tree that has not been visited. If a leaf is reached, no clusters are identified for that path.
Figure 1. Automated partition of a phylogenetic tree.

Graphical example of a depth-first tree search for automated phylogenetic tree partition. The method considers nodes/sub-trees with a reliability ≥ 90% and ≥ 2 distinct patients, recognizing a sub-tree as a cluster when the median sub-tree pairwise patristic distance is below a percentile threshold of the whole-tree patristic distance distribution (let it be the 10th percentile). (a) An example of a phylogenetic tree, where each patient/sequence is identified by a letter (A–Z) and each tree node has an associated value of reliability (which might be bootstrap support). (b) Histogram of the whole-tree patristic distance distribution. The vertical black line corresponds to the 10th percentile distance threshold. The partition method identifies three clusters (yellow, red and green) and discards the grey sub-tree.
To analyse the effect of the threshold t, two independent data sets of different sample sizes (n=127 and n=1,204 sequences) were used, comprising HIV-1 subtype B pol sequences obtained either from patients belonging to epidemiologically confirmed transmission clusters (plus a set of control sequences) or by visually selecting the transmission chains from the phylogenetic tree. Our method yielded rates of agreement with the epidemiologically confirmed/visually determined transmission events up to 93%. The optimal threshold interval ranged from the 10th to the 35th percentile, with a corresponding absolute distance range of 0.04–0.08 nucleotide substitutions per site (Supplementary Fig. S1). Additional sensitivity analyses were conducted by comparing cluster sizes, cluster numbers, distance and branch length distribution of the study and the validation sets, and by comparing against randomly generated trees (Methods).
Application of the partition method to HIV-1 phylogeny
A total of 11,541 HIV-1 subtype B pol sequences from 7,350 patients were included in the analysis, plus two outgroups (subtype C and J). Multiple sequence alignment and maximum-likelihood phylogeny, excluding drug-resistance mutation sites, were carried out using parallel computation. Figure 2 shows the phylogenetic tree, whereas Figure 3 depicts the median and interquartile (IQR) values of branch lengths from a parent node to the child and of number of nodes across the tree levels, starting from the root. Branch lengths and node levels showed a minimal inverse correlation (r=−0.023, P<0.0001). There was also a low but statistically significant correlation between the calendar dates of the leaves and the root-to-tip distances (r=0.25, P<0.0001, Supplementary Fig. S2), confirmed on a multivariable analysis (Supplementary Table S1).
Figure 2. Phylogeny of Italian HIV-1 subtype B pol isolates.

Maximum-likelihood phylogenetic tree of 11,541 HIV-1 subtype B pol gene sequences from the Italian ARCA cohort. Tree is rooted on subtype J and depicted using three-dimensional hyperbolic geometry. Nodes and leaves are highlighted by yellow points.
Figure 3. Tree topology.

Topological analysis of a maximum-likelihood phylogenetic tree composed of 11,541 HIV-1 subtype B pol sequences from the Italian ARCA cohort, rooted on subtype J. Median (interquartile range) branch length (blue) and number of nodes (red) for each tree level are depicted.
By applying our partition method, the number of clusters retrieved using three distinct absolute distance thresholds of 0.04, 0.07 and 0.08 nucleotide substitutions per site (corresponding to the 1st, 15th and 30th percentile thresholds) were 842, 587 and 292, respectively. For each threshold, each cluster had a median (IQR) number of 3 (2–6), 4 (2–9), and 4 (2–10) distinct patients, respectively (Supplementary Fig. S3). The proportion of clustered isolates was 41.71, 73.44 and 92.23%. Of note, at the 30th percentile threshold, about a half of the sequences were placed in two distinct clusters (n=5,785 and n=1,538), both exceeding in size the number of un-clustered isolates (n=897). At thresholds below the 30th percentile, the maximum cluster size was always inferior to the number of un-clustered isolates (Supplementary Fig. S4). Thus, the 30th percentile threshold behaved as a break-point: all subsequent analyses yielded similar results across lower thresholds, whereas the same did not always held when considering both thresholds above and below the break-point. The partitions retrieved at different thresholds exhibited a mild rate of agreement, with a peak at the 15th percentile threshold (Supplementary Fig. S5). Notably, two previously published cases25,26 of drug-resistance transmission from ART-naive to ART-naive patients in ARCA were correctly identified at any of the thresholds considered.
Transmission clusters and factors associated with clustering
The phylogeny partition was linked to the patients' epidemiological and clinical information. Descriptive statistics of the study population is shown in Table 1.
Table 1.
Study population.
| Variables | n | % | ||
|---|---|---|---|---|
| Sequences | 11,541 | 100 | ||
| Patients | 7,350 | 63.69 | ||
| Patients with known seroconversion date | 258 | 3.51 | ||
| Patients with known date of first HIV-1 positive test | 2,720 | 37.01 | ||
| Country area | ||||
| Central Italy | 3,274 | 44.54 | ||
| Northern Italy | 3,528 | 48.00 | ||
| Southern Italy | 443 | 6.03 | ||
| Unknown | 105 | 1.43 | ||
| Mode of HIV-1 transmission | ||||
| Injecting drug user | 1,418 | 19.29 | ||
| Heterosexual | 1,439 | 19.58 | ||
| Male homosexual | 1,313 | 17.86 | ||
| Other/unknown | 3,180 | 43.27 | ||
| Gender | ||||
| Female | 1,677 | 22.82 | ||
| Male | 5,111 | 69.54 | ||
| Unknown | 562 | 7.65 | ||
| Country of birth | ||||
| Italy | 4,210 | 57.28 | ||
| Other countries | 229 | 3.12 | ||
| Unknown | 2,911 | 39.60 | ||
| All sequences (number of patients) | ||||
| ART-naive | 1,287 (1,116) | 11.15 (15.18) | ||
| ART-experienced | 6,962 (3,603) | 60.32 (49.02) | ||
| Unknown ART status | 3,292 (2,631) | 28.52 (35.80) | ||
| Presence of at least one resistance mutation for a specific drug class (one sequence per patient) | Considering mixtures of resistant mutants and wild types at specific positions | Not considering mixtures of resistant mutants and wild types at specific positions | ||
| Any class | ||||
| ART-naive | 246 | 22.04% | 164 | 14.69% |
| ART-experienced | 2,911 | 80.79% | 2,657 | 73.74% |
| NRTI | ||||
| ART-naive | 125 | 11.20% | 109 | 9.77% |
| ART-experienced | 2,712 | 75.27% | 2,512 | 69.72% |
| NNRTI | ||||
| ART-naive | 145 | 12.99% | 76 | 6.81% |
| ART-experienced | 1,485 | 41.21% | 1,147 | 31.83% |
| PI | ||||
| ART-naive | 69 | 6.18% | 55 | 4.93% |
| ART-experienced | 1,312 | 36.41% | 1,135 | 31.50% |
| Numerical markers | Median | IQR | ||
| Sequence year | 2004 | 2002–2007 | ||
| Number of sequences per patient | 1 | 1–2 | ||
| HIV-1 RNA Log 10 copies per ml | ||||
| ART-naive | 4.64 | 4.04–5.23 | ||
| ART-experienced | 3.98 | 3.32–4.65 | ||
| CD4+ T cells per mm 3 | ||||
| ART-naive | 361 | 196–556 | ||
| ART-experienced | 334 | 191–504 | ||
| Age (years) | ||||
| ART-naive | 37 | 31–44 | ||
| ART-experienced | 41 | 37–46 | ||
| Time passed from the first HIV+ test (years) | ||||
| ART-naive | 0 | 0–1 | ||
| ART-experienced | 10 | 6–15 | ||
ART, antiretroviral therapy; IQR, interquartile range; NNRTI, non-nucleoside reverse transcriptase inhibitors; NRTI, nucleoside/nucleotide reverse transcriptase inhibitors; PI, protease inhibitors.
Characteristics of subtype B HIV-1 infected patients enrolled in the Italian ARCA cohort.
Table 2 describes the composition of clusters when considering the threshold distance of 0.07 (15th percentile, highest rate of agreement). Sequences without epidemiological information were ignored, and only the earliest available sequence per patient was considered. Each cluster was evaluated checking if it was composed exclusively either by a single or by a mixture of different demographic factors. The estimated proportions were then compared against those that would be expected by chance after randomly shuffling the cluster indices. We found an excess in the proportion of clusters composed solely by patients living in the Northern Italy (31 versus 17%, P<0.0001), by those living in the Central Italy (25 versus 16%, P=0.0008), by male homosexuals (27 versus 16%, P<0.0001), by male homosexuals and heterosexuals together (20 versus 10%, P<0.0001), by patients infected recently (within three years from the first HIV-1 positive test, 35 versus 19%, P<0.0001), by ART-naive patients without any drug-resistance mutation (15 versus 6%, P<0.0001), by patients with high HIV-1 RNA load (above 10,000 copies per ml, 43 versus 34%, P=0.02), by patients carrying at least one resistance mutation to nucleoside/nucleotide reverse transcriptase inhibitors (NRTI) and protease inhibitors (PI) (26 versus 19%, P=0.007; 10 versus 6%, P=0.02, respectively). Conversely, we observed a proportion significantly lower than expected for clusters comprising male homosexuals and injecting drug users (IDUs) together (3 versus 9%, P<0.0001), male homosexuals and heterosexuals and IDU together (11 versus 25%, P<0.0001), and patients living in the Northern Italy and in the Central Italy (27 versus 42%, P<0.0001). Notably, although the proportions of clusters composed by patients either naive or carrying any drug-resistance mutation were exceeding those expected by chance, along with the mixtures of ART-exposed/ART-naive and patients with/without resistance, there was no excess in the proportion of naive patients carrying any drug-resistance mutation (2 versus 2%, P=0.898). Similar results were obtained by considering thresholds up to the 30th percentile (data not shown).
Table 2.
Demographic factors in transmission clusters.
| Factor strata | Clusters | Random | Adjusted P value | ||
|---|---|---|---|---|---|
| n | % | n | % | ||
| Country area of residence | |||||
| Northern Italy | 183 | 31.28 | 96 | 17.30 | <0.0001 |
| Central Italy | 146 | 24.96 | 90 | 16.22 | 0.0009 |
| Southern Italy | 8 | 1.37 | 7 | 1.26 | 0.8985 |
| Northern and Central Italy | 158 | 27.01 | 230 | 41.44 | <0.0001 |
| Northern and Southern Italy | 19 | 3.25 | 13 | 2.34 | 0.4504 |
| Central and Southern Italy | 9 | 1.54 | 12 | 2.16 | 0.5302 |
| Northern, Central and Southern Italy | 62 | 10.60 | 107 | 19.28 | 0.0001 |
| Mode of HIV transmission | |||||
| Male homosexual | 135 | 27.05 | 77 | 15.88 | <0.0001 |
| Heterosexual | 93 | 18.64 | 72 | 14.85 | 0.1794 |
| IDU | 56 | 11.22 | 79 | 16.29 | 0.0415 |
| Male homosexual and heterosexual | 99 | 19.84 | 48 | 9.90 | <0.0001 |
| Male homosexual and IDU | 13 | 2.61 | 46 | 9.48 | <0.0001 |
| Heterosexual and IDU | 50 | 10.02 | 42 | 8.66 | 0.5564 |
| Male homosexual, heterosexual and IDU | 53 | 10.62 | 121 | 24.95 | <0.0001 |
| ART status | |||||
| Naive | 99 | 19.08 | 48 | 9.78 | 0.0001 |
| Experienced | 227 | 43.74 | 231 | 47.05 | 0.3921 |
| Naive and experienced | 193 | 37.19 | 212 | 43.18 | 0.0883 |
| Presence of at least one resistance mutation to NRTI | |||||
| Yes | 153 | 26.15 | 102 | 18.65 | 0.0069 |
| No | 156 | 26.67 | 87 | 15.90 | <0.0001 |
| Yes and no | 276 | 47.18 | 358 | 65.45 | <0.0001 |
| Presence of at least one resistance mutation to NNRTI | |||||
| Yes | 67 | 11.45 | 58 | 10.34 | 0.5998 |
| No | 243 | 41.54 | 183 | 32.62 | 0.0051 |
| Yes and no | 275 | 47.01 | 320 | 57.04 | 0.0020 |
| Presence of at least one resistance mutation to PI | |||||
| Yes | 61 | 10.43 | 34 | 6.09 | 0.0181 |
| No | 300 | 51.28 | 225 | 40.32 | 0.0007 |
| Yes and no | 224 | 38.29 | 299 | 53.58 | <0.0001 |
| Presence of at least one drug-resistance mutation to any ARV class | |||||
| Yes | 188 | 32.14 | 161 | 28.50 | 0.2574 |
| No | 119 | 20.34 | 58 | 10.27 | <0.0001 |
| Yes and no | 278 | 47.52 | 346 | 61.24 | <0.0001 |
| Years passed from the first HIV-1 positive test | |||||
| Below 3 | 143 | 34.71 | 76 | 18.86 | <0.0001 |
| Between 3 and 9 | 53 | 12.86 | 48 | 11.91 | 0.7235 |
| Between 9 and 14 | 33 | 8.01 | 49 | 12.16 | 0.0851 |
| Above 14 | 26 | 6.31 | 37 | 9.18 | 0.1964 |
| Mixtures with ≥2 factors | 157 | 38.11 | 193 | 47.89 | 0.0121 |
| HIV-1 RNA load (copies per ml) | |||||
| Below 1,000 | 19 | 3.85 | 28 | 6.38 | 0.1300 |
| Between 1,000 and 10,000 | 55 | 11.16 | 61 | 13.90 | 0.2834 |
| Above 10,000 | 212 | 43.00 | 151 | 34.40 | 0.0169 |
| Mixtures with ≥2 factors | 207 | 41.99 | 199 | 45.33 | 0.4017 |
| Mode of HIV transmission and gender | |||||
| Male homosexual | 130 | 26.69 | 76 | 15.90 | 0.0001 |
| Male heterosexual and homosexual | 66 | 13.55 | 19 | 3.97 | <0.0001 |
| Male heterosexual | 45 | 9.24 | 40 | 8.37 | 0.6846 |
| Male IDU | 36 | 7.39 | 48 | 10.04 | 0.2173 |
| Female and male heterosexual | 22 | 4.52 | 10 | 2.09 | 0.0649 |
| Female and male heterosexual, male homosexual | 21 | 4.31 | 8 | 1.67 | 0.0338 |
| Other mixtures | 167 | 34.29 | 277 | 57.95 | <0.0001 |
| ART status and presence of at least one drug-resistance mutation to any ARV class | |||||
| Naive and no-resistance | 78 | 15.00 | 30 | 5.93 | <0.0001 |
| Naive and resistance | 12 | 2.31 | 11 | 2.17 | 0.8985 |
| Naive, treated and no-resistance | 28 | 5.38 | 11 | 2.17 | 0.0169 |
| Naive, treated and resistance | 22 | 4.23 | 24 | 4.74 | 0.7247 |
| Other mixtures | 380 | 73.08 | 430 | 84.98 | <0.0001 |
ART, antiretroviral therapy; ARV, antiretroviral; IDU, injecting drug user; NNRTI, non-nucleoside reverse transcriptase inhibitors; NRTI, nucleoside/nucleotide reverse transcriptase inhibitors; PI, protease inhibitors.
Clusters compositions by different demographic factors, using a clustering threshold of 0.07 nucleotide substitutions per site. Observed proportions have been compared with a data randomization.
In Table 3, we report the results from a multivariable analysis conducted calculating the odds of being/not-being included in a transmission cluster, for the thresholds at the 1st, 15th and 30th percentile. At any of the thresholds considered, a higher HIV-1 RNA and a higher CD4+ count were associated with clustering, along with a more recent infection and a younger age. On the contrary, the presence of at least one drug-resistance mutation to NRTI and PI was not associated with clustering. The mode of HIV transmission was the factor that exhibited opposite behaviours by varying the threshold: at low thresholds male homosexuals and heterosexuals tended to cluster more than IDU, whereas the contrary held at higher thresholds. This might be explained by the fact that IDU have a larger pool of contacts as compared with homosexuals/heterosexuals and thus are more likely to be included in larger transmission chains characterized by greater genetic diversity27.
Table 3.
Factors associated with transmission clustering.
| Factor/threshold | 1st Percentile (0.04 ns s−1) | 15th Percentile (0.07 ns s−1) | 30th Percentile (0.08 ns s−1) | ||||||
|---|---|---|---|---|---|---|---|---|---|
| OR | 95% CI | P value | OR | 95% CI | P value | OR | 95% CI | P value | |
| Calendar year of genotyping (per more recent) | 1.04 | (1.01–1.06) | 0.0011 | 0.98 | (0.96–1) | 0.1163 | 0.98 | (0.95–1.01) | 0.2626 |
| Italian country area of residence (ref. Central) | |||||||||
| Northern | 0.52 | (0.46–0.6) | <0.0001 | 0.73 | (0.63–0.85) | <0.0001 | 1.09 | (0.85–1.39) | 0.4936 |
| Southern | 0.58 | (0.45–0.75) | <0.0001 | 0.78 | (0.6–1.01) | 0.0578 | 1.07 | (0.68–1.68) | 0.7860 |
| Unknown | 0.86 | (0.56–1.34) | 0.5151 | 1.05 | (0.63–1.76) | 0.8583 | 0.65 | (0.32–1.32) | 0.2341 |
| Mode of HIV-1 transmission (ref. IDU) | |||||||||
| Heterosexual | 1.64 | (1.29–2.09) | <0.0001 | 1.08 | (0.86–1.36) | 0.4993 | 0.27 | (0.17–0.44) | <0.0001 |
| Male homosexual | 1.58 | (1.24–2.01) | 0.0002 | 1.05 | (0.82–1.33) | 0.7112 | 0.16 | (0.1–0.25) | <0.0001 |
| Other/unknown | 1.52 | (1.19–1.94) | 0.0007 | 1.05 | (0.84–1.32) | 0.6658 | 0.33 | (0.21–0.52) | <0.0001 |
| Gender (ref. female) | |||||||||
| Male | 1.88 | (1.56–2.26) | <0.0001 | 1.00 | (0.83–1.19) | 0.9564 | 0.54 | (0.4–0.73) | <0.0001 |
| Unknown | 2.27 | (1.73–2.97) | <0.0001 | 1.08 | (0.82–1.42) | 0.5801 | 0.52 | (0.32–0.83) | 0.0058 |
| Country of birth (ref. Italy) | |||||||||
| Other than Italy | 0.64 | (0.45–0.91) | 0.0142 | 0.53 | (0.37–0.75) | 0.0004 | 0.28 | (0.18–0.43) | <0.0001 |
| Unknown | 1.03 | (0.86–1.23) | 0.7390 | 1.13 | (0.93–1.36) | 0.2096 | 1.12 | (0.82–1.53) | 0.4867 |
| Age (ref. >46 years old) | |||||||||
| ≤36 | 1.49 | (1.23–1.81) | <0.0001 | 1.20 | (0.98–1.47) | 0.0790 | 1.49 | (1.1–2.04) | 0.0111 |
| >36 and ≤41 | 1.06 | (0.88–1.26) | 0.5617 | 1.00 | (0.83–1.21) | 0.9656 | 1.70 | (1.26–2.29) | 0.0006 |
| >41 and ≤46 | 0.99 | (0.84–1.18) | 0.9366 | 1.00 | (0.84–1.19) | 0.9965 | 1.44 | (1.1–1.9) | 0.0082 |
| Unknown | 1.02 | (0.82–1.26) | 0.8910 | 1.10 | (0.87–1.38) | 0.4303 | 1.50 | (1.01–2.21) | 0.0424 |
| ART status (ref. ART-naive) | |||||||||
| ART-experienced | 0.68 | (0.56–0.84) | 0.0003 | 1.08 | (0.85–1.37) | 0.5361 | 1.18 | (0.82–1.7) | 0.3708 |
| Unknown | 0.72 | (0.59–0.89) | 0.0020 | 1.04 | (0.82–1.31) | 0.7447 | 0.93 | (0.65–1.32) | 0.6677 |
| Time from first HIV+ test (ref. >14 years) | |||||||||
| ≤3 years | 2.56 | (1.87–3.51) | <0.0001 | 1.78 | (1.3–2.45) | 0.0004 | 1.33 | (0.75–2.36) | 0.3261 |
| >3 and ≤9 years | 1.70 | (1.27–2.26) | 0.0003 | 1.14 | (0.87–1.5) | 0.3524 | 0.87 | (0.52–1.45) | 0.6022 |
| >9 and ≤14 years | 1.30 | (1–1.7) | 0.0537 | 1.18 | (0.93–1.51) | 0.1804 | 0.99 | (0.62–1.57) | 0.9519 |
| Unknown | 1.38 | (1.04–1.81) | 0.0232 | 0.90 | (0.7–1.17) | 0.4394 | 0.77 | (0.47–1.24) | 0.2809 |
| Presence of at least one drug-resistance mutation* | |||||||||
| NRTI | 0.68 | (0.6–0.78) | <0.0001 | 0.72 | (0.62–0.82) | <0.0001 | 0.99 | (0.8–1.24) | 0.9378 |
| NNRTI | 0.93 | (0.83–1.04) | 0.2271 | 0.99 | (0.88–1.12) | 0.8875 | 0.95 | (0.78–1.16) | 0.6196 |
| PI | 0.93 | (0.82–1.07) | 0.3092 | 0.80 | (0.7–0.92) | 0.0012 | 0.77 | (0.61–0.97) | 0.0274 |
| HIV-1 RNA per one Log10 copies per ml higher | 1.08 | (1.01–1.15) | 0.0344 | 1.01 | (0.94–1.09) | 0.7574 | 1.04 | (0.92–1.17) | 0.5722 |
| CD4+ count per 50 cells/mm3 higher | 1.03 | (1.01–1.04) | 0.0002 | 1.02 | (1.01–1.04) | 0.0057 | 1.03 | (1–1.06) | 0.0616 |
ART, antiretroviral therapy; CI, confidence interval; IDU, injecting drug user; NNRTI, non-nucleoside reverse transcriptase inhibitors; NRTI, nucleoside/tide reverse transcriptase inhibitors; ns s−1, nucleotide substitutions per site; OR, odds-ratio; PI, protease inhibitors.
*Mixtures of wild-type and resistant mutants are classified as resistant
Adjusted OR of transmission clustering evidence (clustered versus un-clustered isolates) from fitting a multivariable logistic generalized-estimating-equations model, by considering different percentile thresholds.
Discussion
A new methodology for the partition of large-scale phylogenies and the inference of transmission clusters was introduced. This approach conjugates the evaluation of node reliability, tree topology and patristic distance analysis. Previous approaches have lacked, in general, not only a standardized definition of a transmission cluster, but also a formal algorithmic procedure for the detection of reliable transmission clusters within a phylogeny. In the studies by Lewis et al.15 and Hughes et al.,17 clusters were identified on large data sets using a fixed threshold on genetic distances, and then confirmed by phylogenetic trees constructed afterwards. Another approach was the CTree algorithm24, originally applied to viral sub-typing, which does not account for node reliability and is not applicable to large data sets in its current implementation. Other available methods have used different cluster selection schemes by performing nested phylogenetic analyses, and/or adding criteria for geographical consistency15,16,17,18,19,20,21,22, but in most cases the assessment of transmission clusters is still subject to a visual tree inspection. The definition of a transmission cluster proposed here is general and can be tuned to accommodate any of the previous definitions. The method can be of interest for epidemiologists because obtained partitions could be used in multi-level modelling.
The depth-first approach was applied to a large study population, composed of viral sequences of HIV-1-infected patients followed up at the Italian clinics, with the aim to gain knowledge about viral transmission clusters and their associated factors. The transmission clusters detected in our study population were preferentially composed either by male homosexuals only or by male homosexuals and heterosexuals together. As male homosexuals (and presumably male bisexuals) are a primary source of the cluster composition, this could be considered for designing targeted population screenings and interventions. On the other hand, there was a negative association between male homosexuals/heterosexuals and IDU. We found that ART-naive patients cluster both with other ART-naive and with ART-experienced patients, in various configurations with respect to the carriage of drug-resistance mutation. Although the direction of the transmission cannot easily be inferred, the proportion of clusters composed exclusively by ART-naive patients carrying at least one drug-resistance mutation in our population study (so presumably transmitting the resistance to each other) was ≈2%, a low proportion, comparable to a previous estimation in the United Kingdom16. A substantial responsibility of drug-resistance transmission is still carried by the ART-experienced population, suggesting that any decrease in the prevalence of drug-resistance in the ART-experienced population could translate into a reduction of the proportion of new infections with drug-resistant virus.
Multivariable analysis revealed several factors independently associated with the transmission clustering, including a higher HIV-1 RNA load and CD4+ count, but not the presence of drug-resistance. These results partially agree with those reported from the Swiss cohort study19, in which the strongest predictor of clustering was the detection of drug-resistance, along with HIV-1 RNA load and CD4+ count. However, that study population was composed by newly diagnosed individuals.
The association of a recent HIV-1 positive test with transmission clustering could be simply due to the fact that in these individuals the intra-host viral evolution is at an early stage and thus it is easier to trace the possible transmission source. Another possibility, however, is that some newly infected patients might not be aware of being infected, and therefore continue to engage in risky sexual behaviours. Recently, infected and untreated patients are also more likely to have higher viral loads, resulting in higher probability of transmission6. Thus, efforts to expand HIV-1 testing programmes should be a successful strategy to reduce the rates of HIV-1 transmission. Concomitantly, the association of higher HIV-1 RNA loads and CD4+ counts with transmission clustering emphasizes the need of early diagnoses and suggests how early treatment may be useful in reducing HIV-1 transmission events.
This work has some limitations. First, epidemiological conclusions may change slightly or dramatically depending on the choice of the threshold. By evaluating the algorithm on different data sets, and using different definitions of a transmission cluster, the optimal threshold spanned a large range, from 0.04 to 0.08 nucleotide substitutions per site, whereas previous studies used more stringent criteria (either 0.015 or 0.031)18,21. Ideally, a transmission chain, at least in the context of a single subtype phylogeny of HIV-1 isolates, should be defined by an absolute threshold. At the moment, the lack of epidemiologically confirmed data precludes such a precise estimation. Nonetheless, the present method offers a rational validation strategy to identify an appropriate cutoff, depending on the specific data set under investigation and on the (strict or loose) definition of a transmission cluster. Second, complete demographic and clinical information were missing for a relevant proportion of patients enrolled in ARCA. A non-uniform sequence sampling has most likely occurred overtime. Most of the sequences included in our analysis were derived from ART-experienced patients tested at virological failure. Although repeated measures and convergent evolution due to treatments were accounted for, the analysis lacked a sample contribution from recently infected patients. Sampling could potentially distort results when analysing factors associated with transmission chains20. Finally, the partition method is fully dependent on the phylogenetic tree: if the tree is unreliable, then so is the cluster identification. The estimation of highly resolved and reliable phylogenies from large data sets is still a challenge and requires massively parallelized routines, especially for maximum likelihood or Bayesian tree inference. For this reason, the approach based on nested phylogenies might be still a preferable choice.
Some limitations of phylogenetic efficiency in detecting transmission chains3 could also be overcome by coupling phylogeny inference with models derived from the complex network theory28,29,30,31. For instance, a phylogeny could be used as a previous knowledge to infer sexual links when designing a social network model for HIV-1 infection.
The analysis of transmission clusters using the method discussed herein can easily be extended to non-B subtype HIV-1, whose circulation is increasing in the Italy and Europe32, as well as other viral epidemics, such as hepatitis B or C viruses (HBV/HCV), influenza and coronavirus infection. In particular, HCV is one of the fastest growing pandemics and its evolutionary rate, genetic heterogeneity and risk transmission factors are similar to HIV-1. Given the upcoming availability of HCV antivirals, surveillance of drug-resistance and analysis of transmission clusters using standardized algorithms are expected to be of outstanding interest in the near future. Finally, the algorithm described here can potentially be used in the study of intra-host phylogenies—especially for the characterization of infected cellular reservoirs and compartments in viruses such as HIV33,34,35,36 or simian immunodeficiency virus37—in terms of viral fitness, emergence of drug resistance and pathogenesis.
Methods
Study population
HIV-1 pol gene sequences (encompassing at least amino acidic positions 1–99 of protease and 1–250 of reverse transcriptase) of ART-naive and ART-experienced patients were extracted from ARCA, with sampling dates, plus corresponding information (where available) on patients' age, gender, country of origin, country area of residence, mode of HIV-1 transmission, date of first HIV-1-positive test, date of first ART, HIV-1 RNA load and CD4+ T cell count contemporary to the sampling date (between −30/+7 days for HIV-1 RNA, between −30/+30 days for CD4+).
Sequence analysis
Viral subtype was assigned by using the Rega subtyping tool (http://www.bioafrica.net/rega-genotype/html/subtypinghiv.html). All sequences classified as subtype B, excluding any putative recombinant form, were aligned using the parallel implementation of ClustalW38, and manually edited. Resistance to an antiretroviral class (nucleoside-tide/non-nucleoside/protease inhibitors) was defined as the presence of at least one major mutation conferring resistance to at least one drug belonging to that class according to the 2009 update of the International AIDS Society reference list (http://www.iasusa.org/resistance_mutations/mutations_figures.pdf). Deduced amino-acid mixtures including a major resistance mutation were considered as indicative of resistance, unless otherwise specified. Columns of the multiple alignment corresponding to codon positions associated to drug-resistance were removed.
Phylogenetic analysis
Maximum-likelihood phylogenetic analysis was performed on the alignment, adding HIV-1 subtypes J and C as outgroups. The parallel implementation of FastTree software39 was used, setting up a general-time-reversible model, with a 20-parameter gamma optimization, and a mix of nearest-neighbour interchanges and sub-tree/prune/regraft moves for tree topology search. Reliability of each tree split was calculated by a Shimodaira–Hasegawa test. To visualize the large tree as a whole, three-dimensional hyperbolic geometry software was used (http://www.caida.org/tools/visualization/walrus/).
Parallel ClustalW multiple alignment required ∼10 h on a two quad-core 64bit Intel Xeon X5550@2.66GHz, with Hyper-Threading technology, using a total of 16 processing units and 24GB DDR3 RAM. Parallel FastTree software run for ≈ 40 min.
Automated partition of phylogenies
After obtaining the maximum-likelihood phylogenetic tree, rooted on HIV-1 subtype J, tree topology was analysed with a depth-first visit40 by considering the number of sub-trees with a node reliability ≥ 90%, and an associated number of leaves with at least two distinct patients. At each step of the depth-first visit, a sub-tree was identified as a cluster if the median value of the sub-tree distance distribution was below a t-percentile threshold of the whole-tree distance distribution. If this condition was met in a node, the search at that node was stopped, ignoring the children nodes, passing to analyse other node siblings. The threshold t was evaluated and optimized over the range [5th, 50th] percentile of the whole-tree distance distribution, with a step of 0.05. Cluster partitions were compared by using the adjusted Rand index41.
Software implementation and computational complexity
Software has been implemented using the java (http://java.sun.com/) programming language, released as a free platform-independent standalone application, executable both from the command-line and with a graphical user interface (downloadable as a Supplementary Software 1 and 2, see Supplementary Note 1, Supplementary Data 1 and 2, and Supplementary Fig. S6). The software requires a phylogenetic tree input file in newick format. Three different options are available: (i) threshold-based partition algorithm, specifying a threshold value and a maximum number of distance comparisons; (ii) topological analysis, with median (IQR) values for branch length, reliability and number of nodes at each tree level; (iii) patristic distance calculator.
In the partition algorithm (i), the calculation of the branch length difference distribution for a tree with k leaves, requires k*(k-1)/2 pairwise comparisons, corresponding to 66.6 million for the ARCA phylogenetic tree. In the worst case, the depth-first search may require a number of accesses to the distance matrix, which is cubic in the number of entries. However, the implemented software has an efficient indexing routine that permit the exact calculation of a whole-tree distance matrix even for huge trees, at a price of a high random access memory usage. If the java virtual machine is initialized with at least 8 Gb of RAM, it is possible to compute exactly a full matrix for a tree with ≈10,000 leaves. Our routine for patristic distance calculation was validated by comparing it against the 'cophenetic' function of the 'ape' library in the R software (http://www.R-project.org).
Validation of partition method and threshold optimization
The depth-first visit procedure for the automated partition of a phylogenetic tree was evaluated by using two different independent data sets.
First, a maximum-likelihood phylogenetic tree was estimated (with the same alignment and tree fit procedures as previously described) by considering a set of group M subtype B HIV-1 pol sequences obtained from patients with a confirmed and known transmission history, plus a set of random control sequences from distinct patients of the same geographical area, and two outgroups (HIV-1 subtypes J and C). This data set was produced by querying the Los Alamos HIV repository (http://www.hiv.lanl.gov/content/index), in which 62 sequences from 35 patients were reported to be involved in five distinct transmission events. The number of control sequences was the same as that of sequences linked to the transmission events. Thus, a total of 127 sequences were considered in the subsequent phylogenetic analysis. The phylogenetic tree (Supplementary Fig. S7) was also visually inspected to confirm the epidemiological evidence of transmission clustering, as follows.
Identification of clusters was performed by examining leaves and nodes exhaustively. Only at a most recent common ancestor (MRCA) node with a reliability ≥ 90%, all the children leaves were iteratively grouped together, maximizing the cluster size, ensuring that any group included isolates from at least two distinct patients. In theory, if all nodes with a reliability of ≥ 90% were scored as transmission chains, then any highly supported epidemiological cluster with several nested highly supported transmission chains would also be considered as a transmission chain. However, if two potential transmission clusters happened to share a MRCA with a reliability value of ≥ 90%, but the two lineages departing from that MRCA exhibited long branch lengths, then they were considered as two independent transmission chains. Leaves that did not meet these criteria were left un-clustered.
All transmission events were identified as distinct clusters, although some of the control sequences were placed in one or more of the five transmission clusters and additional clusters were identified (n=12). The adjusted Rand index that compared the visual inspection of the phylogenetic tree against the epidemiological evidence was equal to 0.55. The depth-first procedure was executed optimizing the threshold t over a percentile interval range (5th, 50th) of the whole-tree distance distribution, with a step of 0.05, obtaining a maximum adjusted Rand index of 0.69 (11 clusters) at t=10th (0.04 nucleotide substitutions per site) percentile with respect to the epidemiological evidence and of 0.93 (10 clusters) at t=20th (0.062 nucleotide substitutions per site) percentile with respect to the visual clustering (Supplementary Fig. S1).
Successively, another maximum-likelihood phylogenetic tree was estimated on the whole set of group M subtype B HIV-1 pol sequences from the Los Alamos HIV repository, adding subtypes J and C as outgroups (n=1,204), and transmission clusters were inferred by means of a visual inspection. The highest adjusted Rand index between the depth-first method and the visual inspection was 0.88, corresponding to a threshold of 0.08 nucleotide substitutions per site, that is, the 35th percentile (Supplementary Fig. S1). As previously found20, the proportion of sequences that clustered together from the same country was significantly higher than expected by chance.
We also compared the distributions of patristic distances and branch lengths in the validation sets and in the ARCA data set. Although significantly different in the sample size, the larger tree of Los Alamos (n=1,204) and that of ARCA (n=11,541) showed a remarkably low absolute difference in the average patristic distance values, which was below 0.004 nucleotide substitutions per site. The same held when considering the average branch length, with an absolute difference of 0.018 (Supplementary Fig. S8).
As a final evaluation, we compared the distributions of cluster number and cluster sizes across different percentile thresholds by considering several subtype B HIV-1 trees estimated on data sub-samples, against randomly generated trees (at different birth rates). At all thresholds below the 45th percentile, both the average number of clusters and the cluster size of real trees were significantly different from the values obtained by a random tree set (Supplementary Figs S9 and S10).
Epidemiological analysis
Multivariable regression analysis was performed to identify prognostic factors of belonging to a transmission cluster (using a binomial link), and of root-to-tip distance (using linear regression). Generalized-estimating-equations models were used, using the 'geepack' library in the R software, with patient codes as identifiers. Covariate of interests were: sequence year (numeric), presence of for nucleoside-tide/non-nucleoside/protease inhibitor resistance mutations (binary), patient's area of residence (Northern/Southern/Central Italy or unknown), mode of HIV-1 transmission (heterosexual, male homosexual, IDU, other/unknown), gender (male/female/unknown), country of origin (Italian/non-Italian/unknown), age (categorized on the IQR range or unknown), ART status (ART-experienced/ART-naive/unknown), time passed from the first HIV-1 positive determination (categorized on the IQR range or unknown), HIV-1 RNA load and CD4+ cell count (numeric) at the time of genotyping.
Additional information
How to cite this article: Prosperi, M.C.F., et al. A novel methodology for large-scale phylogeny partition. Nat. Commun. 2:321 doi: 10.1038/ncomms1325 (2011).
Supplementary information
Supplementary Figures S1-S10, Supplementary Table S1 and Supplementary Note 1. (PDF 802 kb)
Large-scale phylogeny partition program software. (ZIP 99 kb)
MS Windows batch file for launching the software with the graphical user interface. (TXT 0 kb)
Sample data A. (TXT 3 kb)
Sample data B. (TXT 49 kb)
Acknowledgements
DynaNets acknowledges the financial support of this work from the Future and Emerging Technologies (FET) programme within the Seventh Framework Programme for Research of the European Commission, under the FET-Open grant #233847. This research is also part of CHAIN, which received funding from the European Community's Seventh Framework Programme FP7/2007-2013, under the grant agreement #223131. This work has been funded in part by the NIH-NINDS grant R01 NS063897-01A2. ARCA is supported by educational grants from Abbott, Boehringer-Ingelheim, Bristol-Myers Squibb, Gilead Sciences, GlaxoSmithKline, Janssen-Cilag Tibotec division. R.R.G. is funded by a T-32 National Cancer Institute (T-32 CA09126) award. We thank Dr Roberto Cauda for his effort in supporting this study.
The ARCA collaborative group:
Andrea Giacometti (Ancona—Clinica di Malattie Infettive), Luca Butini (Ancona—Immunologia Clinica), Romana del Gobbo (Ancona—Malattie Infettive), Stefano Menzo (Ancona—Virologia), Danilo Tacconi (Arezzo—Malattie Infettive), Giovanni Corbelli (Ascoli Piceno—Malattie Infettive), Stefania Zanussi (Aviano—Centro di Riferimento Oncologico), Laura Monno (Bari—Clinica Malattie Infettive Università), Grazia Punzi (Bari—Virologia), Franco Maggiolo (Bergamo—Malattie Infettive), Annapaola Callegaro (Bergamo—Microbiologia e Virologia), Leonardo Calza (Bologna—Malattie Infettive S. Orsola), Maria Carla Re (Bologna—UO Microbiologia, Lab. Retrovirus), Raffaele Pristerà (Bolzano—Malattie Infettive), Paola Turconi (Brescia—Fleming Labs), Antonella Mandas (Cagliari—Centro S.I.D.A., Policlinico Universitario), Sauro Tini (Citta' di Castello—Medicina Generale), Alessia Zoncada (Cremona—Malattie Infettive), Elisabetta Paolini (Cremona—Servizio Immunoematologia e Medcina Trasfusionale), Giorgio Amadio (Fermo—Malattie Infettive), Laura Sighinolfi (Ferrara—Malattie Infettive AOU S. Anna), Giuliano Zuccati (Firenze—Centro MTS), Massimo Morfini (Firenze—Ematologia Careggi), Roberto Manetti (Firenze—Immunoallergologia Careggi), Paola Corsi (Firenze—Malattie Infettive Careggi), Luisa Galli (Firenze—Malattie Infettive Pediatria Meyer), Massimo Di Pietro (Firenze—Malattie Infettive SM Annunziata), Filippo Bartalesi (Firenze—Malattie Infettive Università), Grazia Colao (Firenze—Virologia Careggi), Andrea Tosti (Foligno—Malattie Infettive/SERT), Antonio Di Biagio (Genova—Clinica Malattie Infettive AOU S. Martino), Maurizio Setti (Genova—Clinica Medica Immunologia), Bianca Bruzzone (Genova—Laboratorio di Igiene Ospedale S. Martino), Giovanni Penco (Genova—Malattie Infettive Ospedali Galliera), Michele Trezzi (Grosseto—Malattie Infettive), Anna Orani (Lecco—Malattie Infettive), Riccardo Pardelli (Livorno—Malattie Infettive), Michele De Gennaro (Lucca—Malattie Infettive), Alessandro Chiodera (Macerata—Malattie Infettive), Alfredo Scalzini (Mantova—Malattie Infettive Ospedale 'C. Poma'), Loredana Palvarini (Mantova—Virologia), Paolo Almi (Massa—Malattie Infettive), Giovanni Todaro (Messina—Malattie Infettive), Antonella d'Arminio Monforte (Milano—Clinica Malattie Infettive AO S. Paolo), Paola Cicconi (Milano—Clinica di Malattie Infettive Ospedale S. Paolo), Stefano Rusconi (Milano—Dipart. Scienze Cliniche, Sez. Malattie Infettive—Università degli Studi), Maria Rita Gismondo (Milano—Laboratorio Microbiologia Ospedale L. Sacco, Dipart. Scienze Cliniche, Sez. Malattie Infettive), Maria Rita Gismondo (Milano—Laboratorio Microbiologia Ospedale L. Sacco, Prima Divisione Malattie Infettive), Valeria Micheli (Milano—Laboratorio Microbiologia Ospedale L. Sacco, Seconda Divisione Malattie Infettive), Maria Luisa Biondi (Milano—Laboratorio di diagnostica molecolare infettivologica AO S. Paolo), Nicola Gianotti (Milano—Malattie Infettive San Raffaele), Amedeo Capetti (Milano—Prima Divisione Malattie Infettive Ospedale L. Sacco), Paola Meraviglia (Milano—Seconda Divisione Malattie Infettive Ospedale L. Sacco), Enzo Boeri (Milano—Virologia HSR), Cristina Mussini (Modena—Clinica Malattie Infettive), Monica Pecorari (Modena—Virologia), Alessandro Soria (Monza—Malattie Infettive), Laura Vecchi (Monza—UO Microbiologia AO S. Gerardo), Maurizio Santirocchi (Narni—SERT), Diego Brustia (Novara—Malattie Infettive AO Maggiore), Paolo Ravanini (Novara—Virologia), Federico Dal Bello (Padova—Virologia), Nino Romano (Palermo—Centro Riferimento AIDS Università), Salvatrice Mancuso (Palermo—Servizio Riferimento Regionale Diagnosi AIDS), Carlo Calzetti (Parma—Divisione Malattie Infettive ed Epatologia Azienda Ospedaliera), Renato Maserati (Pavia—Ambulatorio Clinica Malattie Infettive S. Matteo), Gaetano Filice (Pavia—Clinica Malattie Infettive e Tropicali), Fausto Baldanti (Pavia—Virologia S. Matteo), Daniela Francisci (Perugia—Malattie Infettive), Giustino Parruti (Pescara—Malattie Infettive), Ennio Polilli (Pescara—Virologia Pescara), Daria Sacchini (Piacenza—Malattie Infettive), Chiara Martinelli (Pisa—Malattie Infettive), Rita Consolini (Pisa—Pediatria I Università), Linda Vatteroni (Pisa—Virologia), Angela Vivarelli (Pistoia—Malattie Infettive), Daniele Dionisio (Pistoia—Virologia), Alessandro Nerli (Prato—Malattie Infettive), Lucia Lenzi (Prato—Virologia), Giacomo Magnani (Reggio Emilia—Malattie Infettive), Patrizia Ortolani (Rimini—Malattie Infettive Rimini), Massimo Andreoni (Roma—Cattedra Malattie Infettive Tor Vergata), Guido Palamara (Roma—IRCCS S. Gallicano), Caterina Fimiani (Roma—Immunologia Clinica Umberto I), Lucia Palmisano (Roma—Istituto Superiore di Sanità), Andrea De Luca (Roma—Istituto di Clinica Malattie Infettive, Università Cattolica), Giovanni Fadda (Roma—Istituto di Microbiologia, Università Cattolica), Vincenzo Vullo (Roma—Malattie Infettive e Tropicali La Sapienza—Umberto I), Ombretta Turriziani (Roma—Medicina Sperimentale e Patologia—Sezione Virologia—La Sapienza), Marco Montano (Roma—Virologia per Malattie Infettive Tor Vergata), Giovanni Cenderello (San Remo—Malattie Infettive), Angela Gonnelli (Siena—Malattie Infettive), Maurizio Zazzi (Siena—Virologia), Michele Palumbo (Terni—Malattie Infettive), Valeria Ghisetti (Torino—Laboratorio di Virologia, Ospedale Amedeo di Savoia), Stefano Bonora (Torino—Malattie Infettive Amedeo di Savoia), Palma Delle Foglie (Trento—Malattie Infettive), Cristina Rossi (Treviso—Malattie Infettive), Prof.Paolo Grossi (Varese—Clinica Malattie Infettive e Tropicali), Elena Seminari (Varese—Virologia), Federica Poletti (Verbania—Malattie Infettive Verbania), Vincenzo Mondino (Verbania—Virologia), Marina Malena (Verona—Centro di Medicina Preventiva-ULSS 20), Emanuela Lattuada (Verona—Malattie Infettive).
Author Contributions
Manuscript writing, epidemiological analysis, ideation of partition algorithm were done by M.C.F.P.; M.C., M.S., R.R.G. performed the phylogenetic analysis, theoretical support, manuscript review and editing; I.F. carried out installation and execution of parallel computation software for sequence alignment and phylogenetic analysis, implementation of partition algorithm and graphical user interface; F.S., M.P., V.B., S.Di G., B.B., A.C., A.V., S.R., M.C.R., M.R.G., L.S. contributed to data collection, clinical data collection, molecular sequencing, data monitoring, coordination with local centres participating the ARCA cohort, manuscript evaluation; M.Z. carried out molecular sequencing, manuscript editing; A.De L. designed the study, manuscript editing and project leading.
Competing interests
A.De L. received speakers' honoraria, served as consultant or participated in advisory boards for GlaxoSmithKline, Gilead, Bristol-Myers Squibb, Abbott Virology, Janssen-Cilag Tibotec, Siemens Diagnostics and Monogram Biosciences. S.R. has received research grants and has been involved in advisory boards or educational courses supported by the following companies: Abbott, Boehringer-Ingelheim, Bristol-Myers Squibb, Gilead, GlaxoSmithKline, ViiV Healthcare, Merck, and Janssen-Cilag. M.Z. has received research funding from Pfizer; served as a consultant for Abbott Molecular, Boehringer Ingelheim, Gilead Sciences and Janssen-Cilag; and served on speakers' bureaus for Abbott, Bristol-Myers Squibb, Merck, and Pfizer. The remaining authors declare no competing financial interests. B.B. has received funds for speaking, consultancy and travel from ViiV Healthcare, Gilead Sciences, Abbott Molecular, Janssen-Cilag and Siemens Health Care.
References
- 1.Perrin L, Kaiser L, Yerly S. Travel and the spread of HIV-1 genetic variants. Lancet Infect. Dis. 2003;3:22–27. doi: 10.1016/S1473-3099(03)00484-5. [DOI] [PubMed] [Google Scholar]
- 2.Gray RR, et al. Spatial phylodynamics of HIV-1 epidemic emergence in east Africa. AIDS. 2009;23:F9–F17. doi: 10.1097/QAD.0b013e32832faf61. [DOI] [PMC free article] [PubMed] [Google Scholar]
- 3.Resik S, et al. Limitations to contact tracing and phylogenetic analysis in establishing HIV type 1 transmission networks in Cuba. AIDS Res. Hum. Retroviruses. 2007;23:347–356. doi: 10.1089/aid.2006.0158. [DOI] [PubMed] [Google Scholar]
- 4.Brown AE, et al. Phylogenetic reconstruction of transmission events from individuals with acute HIV infection: toward more-rigorous epidemiological definitions. J. Infect. Dis. 2009;199:427–431. doi: 10.1086/596049. [DOI] [PubMed] [Google Scholar]
- 5.Hué S, Clewley JP, Cane PA, Pillay D. HIV-1 pol gene variation is sufficient for reconstruction of transmissions in the era of antiretroviral therapy. AIDS. 2004;18:719–728. doi: 10.1097/00002030-200403260-00002. [DOI] [PubMed] [Google Scholar]
- 6.Wilson DP, Law MG, Grulich AE, Cooper DA, Kaldor JM. Relation between HIV viral load and infectiousness: a model-based analysis. Lancet. 2008;372:314–320. doi: 10.1016/S0140-6736(08)61115-0. [DOI] [PubMed] [Google Scholar]
- 7.Marcelin AG, et al. Detection of HIV-1 RNA in seminal plasma samples from treated patients with undetectable HIV-1 RNA in blood plasma. AIDS. 2008;22:1677–1679. doi: 10.1097/QAD.0b013e32830abdc8. [DOI] [PubMed] [Google Scholar]
- 8.Attia S, Egger M, Mueller M, Zwahlen M, Low N. Sexual transmission of HIV according to viral load and antiretroviral therapy: systematic review and meta-analysis. AIDS. 2009;23:1397–1404. doi: 10.1097/QAD.0b013e32832b7dca. [DOI] [PubMed] [Google Scholar]
- 9.Wensing AM, et al. Prevalence of drug-resistant HIV-1 variants in untreated individuals in Europe: implications for clinical management. J. Infect. Dis. 2005;192:958–966. doi: 10.1086/432916. [DOI] [PubMed] [Google Scholar]
- 10.Pillay D, et al. The impact of transmitted drug resistance on the natural history of HIV infection and response to first-line therapy. AIDS. 2006;20:21–28. doi: 10.1097/01.aids.0000196172.35056.b7. [DOI] [PubMed] [Google Scholar]
- 11.Di Giambenedetto S, et al. Declining prevalence of HIV-1 drug resistance in treatment-failing patients: a clinical cohort study. Antivir. Ther. 2007;12:835–839. [PubMed] [Google Scholar]
- 12.Marks AJ, Pillay D, McLean AR. The effect of intrinsic stochasticity on transmitted HIV drug resistance patterns. J. Theor. Biol. 2010;262:1–13. doi: 10.1016/j.jtbi.2009.09.017. [DOI] [PubMed] [Google Scholar]
- 13.Brenner BG, et al. Transmission networks of drug resistance acquired in primary/early stage HIV infection. AIDS. 2008;22:2509–2515. doi: 10.1097/QAD.0b013e3283121c90. [DOI] [PMC free article] [PubMed] [Google Scholar]
- 14.Recordon-Pinson P, et al. HIV type-1 transmission dynamics in recent seroconverters: relationship with transmission of drug resistance and viral diversity. Antivir. Ther. 2009;14:551–556. [PubMed] [Google Scholar]
- 15.Lewis F, Hughes GJ, Rambaut A, Pozniak A, Leigh Brown AJ. Episodic sexual transmission of HIV revealed by molecular phylodynamics. PLoS Med. 2008;5:e50. doi: 10.1371/journal.pmed.0050050. [DOI] [PMC free article] [PubMed] [Google Scholar]
- 16.Hué S, Gifford RJ, Dunn D, Fernhill E, Pillay D. Demonstration of sustained drug-resistant human immunodeficiency virus type 1 lineages circulating among treatment-naïve individuals. J. Virol. 2009;83:2645–2654. doi: 10.1128/JVI.01556-08. [DOI] [PMC free article] [PubMed] [Google Scholar]
- 17.Hughes GJ, et al. Molecular phylodynamics of the heterosexual HIV epidemic in the United Kingdom. PLoS Pathog. 2009;5:e1000590. doi: 10.1371/journal.ppat.1000590. [DOI] [PMC free article] [PubMed] [Google Scholar]
- 18.Fisher M, et al. Determinants of HIV-1 transmission in men who have sex with men: a combined clinical, epidemiological and phylogenetic approach. AIDS. 2010;24:1739–1747. doi: 10.1097/QAD.0b013e32833ac9e6. [DOI] [PubMed] [Google Scholar]
- 19.Yerly S, et al. The impact of transmission clusters on primary drug resistance in newly diagnosed HIV-1 infection. AIDS. 2009;23:1415–1423. doi: 10.1097/QAD.0b013e32832d40ad. [DOI] [PubMed] [Google Scholar]
- 20.Kouyos RD, et al. Molecular epidemiology reveals long-term changes in HIV type 1 subtype B transmission in Switzerland. J. Infect. Dis. 2010;201:1488–1497. doi: 10.1086/651951. [DOI] [PubMed] [Google Scholar]
- 21.Ragonnet-Cronin M, et al. Longitudinal phylogenetic surveillance identifies distinct patterns of cluster dynamics. J. Acquir. Immune. Defic. Syndr. 2010;55:102–108. doi: 10.1097/QAI.0b013e3181e8c7b0. [DOI] [PubMed] [Google Scholar]
- 22.Bezemer D, et al. Transmission networks of HIV-1 among men having sex with men in the Netherlands. AIDS. 2010;24:271–282. doi: 10.1097/QAD.0b013e328333ddee. [DOI] [PubMed] [Google Scholar]
- 23.Wicker N, Perrin GR, Thierry JC, Poch O. Secator: a program for inferring protein subfamilies from phylogenetic trees. Mol. Biol. Evol. 2001;18:1435–1441. doi: 10.1093/oxfordjournals.molbev.a003929. [DOI] [PubMed] [Google Scholar]
- 24.Archer J, Robertson DL. CTree: comparison of clusters between phylogenetic trees made easy. Bioinformatics. 2007;23:2952–2953. doi: 10.1093/bioinformatics/btm410. [DOI] [PubMed] [Google Scholar]
- 25.Razzolini F, et al. Three-class-resistant human immunodeficiency virus type 1 variant in a drug-naive heterosexual couple. J. Clin. Microbiol. 2008;46:3856–3859. doi: 10.1128/JCM.01122-08. [DOI] [PMC free article] [PubMed] [Google Scholar]
- 26.Romano L, Venturi G, Vivarelli A, Galli L, Zazzi M. Detection of a drug-resistant human immunodeficiency virus variant in a newly infected heterosexual couple. Clin. Infect. Dis. 2002;34:116–117. doi: 10.1086/322521. [DOI] [PubMed] [Google Scholar]
- 27.Salemi M, et al. Different population dynamics of human T cell lymphotropic virus type II in intravenous drug users compared with endemically infected tribes. Proc. Natl Acad. Sci. USA. 1999;96:13253–13258. doi: 10.1073/pnas.96.23.13253. [DOI] [PMC free article] [PubMed] [Google Scholar]
- 28.Goodreau SM. Assessing the effects of human mixing patterns on HIV-1 interhost phylogenetics through social network simulation. Genetics. 2006;142:2033–2045. doi: 10.1534/genetics.103.024612. [DOI] [PMC free article] [PubMed] [Google Scholar]
- 29.Sloot PMA, Ivanov SV, Boukhanovsky AV, Van De Vijver DAMC, Boucher CAB. Stochastic simulation of HIV population dynamics through complex network modelling. Int. J. Comput. Math. 2008;85:1175–1187. doi: 10.1080/00207160701750583. [DOI] [Google Scholar]
- 30.Drumright LN, Frost SD. Sexual networks and the transmission of drug-resistant HIV. Curr. Opin. Infect. Dis. 2008;21:644–652. doi: 10.1097/QCO.0b013e328318977c. [DOI] [PubMed] [Google Scholar]
- 31.Smith RJ, Okano JT, Kahn JS, Bodine EN, Blower S. Evolutionary dynamics of complex networks of HIV drug-resistant strains: the case of San Francisco. Science. 2010;327:697–701. doi: 10.1126/science.1180556. [DOI] [PubMed] [Google Scholar]
- 32.Lai A, et al. Changing patterns in HIV-1 non-B clade prevalence and diversity in Italy over three decades. HIV Med. 2010;11:593–602. doi: 10.1111/j.1468-1293.2010.00832.x. [DOI] [PubMed] [Google Scholar]
- 33.Nickle DC, Shriner D, Mittler JE, Frenkel LM, Mullins JI. Importance and detection of virus reservoirs and compartments of HIV infection. Curr. Opin. Microbiol. 2003;6:410–416. doi: 10.1016/S1369-5274(03)00096-1. [DOI] [PubMed] [Google Scholar]
- 34.Salemi M, et al. Phylodynamic analysis of human immunodeficiency virus type 1 in distinct brain compartments provides a model for the neuropathogenesis of AIDS. J. Virol. 2005;79:11343–11352. doi: 10.1128/JVI.79.17.11343-11352.2005. [DOI] [PMC free article] [PubMed] [Google Scholar]
- 35.Salemi M, et al. Phylodynamics of HIV-1 in lymphoid and non-lymphoid tissues reveals a central role for the thymus in emergence of CXCR4-using quasispecies. PLoS One. 2007;2:e950. doi: 10.1371/journal.pone.0000950. [DOI] [PMC free article] [PubMed] [Google Scholar]
- 36.Gray RR, et al. Multiple independent lineages of HIV-1 persist in breast milk and plasma. AIDS. 2011;25:143–152. doi: 10.1097/QAD.0b013e328340fdaf. [DOI] [PMC free article] [PubMed] [Google Scholar]
- 37.Keele BF, et al. Low-dose rectal inoculation of rhesus macaques by SIVsmE660 or SIVmac251 recapitulates human mucosal infection by HIV-1. J. Exp. Med. 2009;206:1117–1134. doi: 10.1084/jem.20082831. [DOI] [PMC free article] [PubMed] [Google Scholar]
- 38.Li KB. ClustalW-MPI: ClustalW analysis using distributed and parallel computing. Bioinformatics. 2003;19:1585–1586. doi: 10.1093/bioinformatics/btg192. [DOI] [PubMed] [Google Scholar]
- 39.Price MN, Dehal PS, Arkin AP. FastTree 2—Approximately maximum-likelihood trees for large alignments. PLoS ONE. 2010;5:e9490. doi: 10.1371/journal.pone.0009490. [DOI] [PMC free article] [PubMed] [Google Scholar]
- 40.Knuth, D. E. The Art of Computer Programming 3rd edn, Vol 1 (Addison-Wesley, 1997).
- 41.Hubert L, Arabie P. Comparing partitions. J. Classif. 1985;2:193–218. doi: 10.1007/BF01908075. [DOI] [Google Scholar]
Associated Data
This section collects any data citations, data availability statements, or supplementary materials included in this article.
Supplementary Materials
Supplementary Figures S1-S10, Supplementary Table S1 and Supplementary Note 1. (PDF 802 kb)
Large-scale phylogeny partition program software. (ZIP 99 kb)
MS Windows batch file for launching the software with the graphical user interface. (TXT 0 kb)
Sample data A. (TXT 3 kb)
Sample data B. (TXT 49 kb)