

Abstract
Lipids from different classes sometimes can exhibit the same exact mass upon electrospray ionization; this presents an analytical challenge in lipidomics. In the negative ionization mode, for example, this can occur with phosphatidylcholines (PCs) and phosphatidylserines (PSs), making them indistinguishable in the absence of fragmentation data. PSs are found at low concentrations in biological samples, making MS/MS spectra difficult to obtain. Moreover, while PCs and PSs are distinguishable in the positive mode, PSs do not ionize as well as PCs, and their ionization is suppressed by the PCs. Here, we show that, in the negative ionization mode, substituting protiated LC-MS additives with their deuterated forms provides a way to distinguish PCs and PSs without chemical derivatization. The method described leverages the differential ionization mechanism of PCs and PSs. PCs are ionized via adduction with salts, whereas PSs ionize via hydrogen abstraction. Substituting the salts used for LC-MS with their deuterated form shifts the mass of PCs by the number of deuterium atoms in the salt, while the mass of PSs remains the same. This comparative shift enables their direct differentiation. We demonstrate that the use of deuterated formate shifts the mass of PCs and provides a direct method to distinguish PCs and PSs, even at biologically-relevant low concentrations. The utility of the method was established and validated in the simultaneous analysis of PCs and PSs in lipid extracts from isolated liver mitochondria in two different rat strains. Thirteen low concentration PSs were identified that would otherwise not have been distinguishable from low concentration PCs.
Graphical Abstract

Introduction
The ability of mass spectrometry to identify and to characterize lipids in complex biological mixtures can be limited by lipids that exhibit the same exact mass. Lipids that exhibit the same exact mass include lipids from within the same class that have the same number of carbon and double bonds, but differ by fatty acyl composition (e.g. phosphatidylethanolamines (PEs) PE(16:0/18:2) Vs. PE(16:1/18:1). Another example are lipids from different classes that, upon ionization, form ions that exhibit the same exact mass.1,2 Phosphatidylcholines (PCs) and phosphatidylserines (PSs), for example, form ions with the same exact mass in the negative mode. PSs ionize via hydrogen abstraction to form [M−H]− ions while PCs ionize via adduction with salts (mainly formate and acetate salts), to form [M+salt-H] − ions. For example, formate adducts of PCs form ions with the same exact mass as [M−H] − ion of PSs that have 3 more carbons and 1 less double bond than the PC (e.g., [PC(38:6) + Formate - H] − has the same mass as [PS (41:5) – H] − i.e. m/z 850.5604).1,3,4 Acetate adducts of PCs also form ions that have the same exact mass as PSs with 4 more carbons and one less double bond than the PC (e.g., [PC (34:1) +Acetate – H] − has the same mass as [PS (38:0) – H] −, i.e. m/z 818.5917).1,3,4 Tandem mass spectrometry (MS/MS and MSn experiments) provides the ability to distinguish these species.MS/MS experiments, however, often cannot be performed on low abundant lipids because the intensity of the parent mass is not high enough to induce fragmentation.1,3,5
Selective derivatization of functional groups, e.g., head group, can be used to distinguish lipids from different classes that exhibit the same exact mass. Derivatization involves a chemical reaction that introduces a specific mass shift to a compound of interest, and thus gives the ability to distinguish compounds with different groups that have the same exact mass.1,6 Since derivatization reactions are chemical reactions, they can also potentially form more than the products of interest, thus further complicating sample analysis, especially in the context of untargeted profiling analyses.7 An alternative to solution-based derivatization to distinguish isobaric lipids from different classes, are gas phase ion-ion transformations that take advantage of differential ionization of different classes of lipids. This has recently been demonstrated by McLuckey et.al to distinguish isobaric PCs and PEs which are indistinguishable in the positive ion mode.2 An alternative to derivatization is the substitution of protiated mobile phases with their deuterated forms to shift the mass of specific compounds.
As an example, the substitution of water (H2O) with D2O has been used extensively in the pharmaceutical industry to distinguish compounds that have the same exact mass, but differ by the number of labile hydrogens (e.g. –SH, -NH, -OH).8–10 These labile hydrogen atoms in the molecules of interest, readily exchange with the deuterium atoms in the mobile phase, thus shifting their masses and enabling their distinction. The use of isotopically-labelled mobile phase and additives is advantageous because they have the similar chemical characteristics to their protiated equivalents, including their analytical response (e.g., ionization efficiency) in MS. Due to the isotopically labeled compounds being heavier; they are easily monitored by mass spectrometry.8–10
The focus of our study is the analysis of low abundance lipids, specifically PSs and PCs that, due to their low concentration, cannot consistently yield MS/MS results. Here, we show that substituting protiated mobile phase additives with their deuterated forms can shift the masses of isobaric lipids that undergo distinct ionization mechanisms without chemically altering them. This method enables correct lipid identification. Specifically, we show that, due to the differential ionization of PCs and PSs in the negative mode, the use of deuterated salts (formate in this work) shifts the mass of PCs (which ionize via salt adduction) while keeping the mass of PSs (which ionize via hydrogen abstraction) the same, which in-turn enables their m/z differentiation. The deuterated formate (which contains one deuterium) shifts the mass of all PCs (and other lipids that ionize via formate adduction) by 1 mass unit while the mass of PS remains unchanged. We validated the method using a series of standards, and we also showed that we could simultaneously analyze PCs and PSs without affecting sensitivity. The method developed requires that samples are analyzed twice, once with protiated solvents and once with deuterated solvents for comparison of mass shifts. We further show the utility of the method in analyzing a liver mitochondrial pool from an obesity-prone (OP) and obesity-resistant (OR) rats that mimic early stage of pre-diabetic metabolic dysfunction. This analysis provides a way to simultaneously monitor low level PCs and PSs.
Materials and Methods
Chemicals and Reagents
LC-MS grade acetonitrile, isopropanol, methanol (MEOH) and HPLC grade dichloromethane (DCM), were obtained from ThermoFisher Scientific (Pittsburgh, PA). Ammonium formate (protiated) was purchased from Sigma-Aldrich (St. Louis, MO). Deuterated formic acid (98%) and deuterated ammonium formate (98%, <5% D2O) were purchased from Cambridge Isotopes Laboratories (Andover, MA). An egg yolk PC mixture was purchased from Sigma Aldrich (St. Louis, MO). All lipid standards were purchased from either Avanti Polar Lipids (Alabaster, AL) from Sigma-Aldrich (St. Louis, MO).
Preparation of Lipid Standards
Stock lipid standards at concentrations ranging from (1–10 mg/ml) were prepared by dissolving them in DCM:MeOH(2:1,v/v). The lipid standards were: 1,2 heptadecanoyl-sn-glycero-3-phosphoethaonolamine (PE 17:0/17:0),1,2-dipentadecanoyl-sn-glycero-3-phospho-(1'-sn-glycerol) (PG 15:0/15:0), 1,2-dioleoyl-sn-glycero-3-phospho-(1'-rac-glycerol)(PG(18:1/18:1),2-dioleoyl-sn-glycero-3-phosphocholine(PC18:1/18:1),1,2-diheptadecanoyl-sn-glycero-3-phosphocholine (PC 17:0/17:0),1,2-diheptadecanoyl-sn-glycero-3-phosphoserine(PS(17:0/17:0),1,2-dipalmitoyl-sn-glycero-3-phospho-L-serine (PS16:/16:0).
Diet Experiments and Rat Liver Mitochondrial Isolation
Mitochondrial Preparation and Lipid Extraction
Mitochondria were isolated from livers of 13 weeks old selectively bred polygenetic obesity prone (OP) and obesity resistant (OR) male rats (n = 22; 11 OP and 11 OR rats) fed with moderately high fat diet (32% of kcal from fat) for 9 weeks.11,12 OP rats closely mimic most clinical variables of human metabolic syndrome and obesity, and are used to study the early changes associated with pre-diabetic metabolic dysfunction. Mitochondria preparation and lipid extraction were as previously described.13–15 In brief: Immediately before extraction, each aliquot of mitochondria (containing 1 mg of protein) was dissolved in 40μL of dimethylsulfoxide (DMSO), and the membranes were disrupted by sonication. A mitochondrial pool sample was created by combining 10 μL from each sonicated mitochondria sample. The pooled sample was used for lipid identification and as quality control samples in lipidomics experiments. Lipid extraction was based on bi-phasic extraction using DCM: MEOH.
LC-MS Analysis
LC-MS analysis (in both the positive and negative modes) was as previously described.13,16 (details in supplemental section).
The following changes were made to the mobile phase: Lipids were either analyzed with mobile phases (both A and B) containing 10 mM protiated ammonium formate and 0.1% formic acid (as previously described) or 10 mM deuterated ammonium formate and 0.1% deuterated formic acid or 10 mM deuterated ammonium formate and 0.1% formic acid.
Direct Infusion of PC (17:0/17:0 and PS(17:0/17:0)
We confirmed the predicted effect of deuterium on PC and PS, a mixture of an equimolar concentration PC(17:0/17:0) and PS (17:0/17:0) by infusion into the MS. The infusion was done by teeing in via a splitter 250 μL/ml of 50:50 mobile phase A: mobile phase B and 2.5 μg/ml of standard mixture flowing at 10 μL/min for a total flow of 260 μL/min into the MS to mimic the LC flow rate. The mobile phases either contained protiated ammonium formate and formic acid or deuterated ammonium formate and deuterated formic acid.
Data Analysis
For chromatographic alignment and peak selection, raw data from the LC-MS profiling experiment in the liver mitochondrial samples from the OP and OR rats were analyzed using the MS label free differential analysis software package SIEVE v 2.1 (Thermo Fisher Scientific and Vast Scientific, Cambridge, MA). A mitochondrial pooled sample analyzed in the middle of the analysis sequence was used as a qualitative reference and for relative quantitation. For identification of PSs, a pooled mitochondrial extract was analyzed using both protiated and deuterated formate (separate injections). Statistical analysis of the identified PSs from the OP and OR mice was done using the non-parametric Mann-Whitney U-test.
Results and Discussion
PCs and PSs can be analyzed in both the positive and the negative ionization modes, but neither mode robustly enables correct identification of these lipids in biological matrices. In the negative mode, these two classes of lipids, which undergo different ionization mechanisms, exhibit the same exact mass upon ionization. As noted in the introduction, for example, formate adducts of PCs form ions with the same exact mass as [M−H] − ion of PSs that have 3 more carbons and 1 less double bond than the PC, and acetate adducts of PCs also form ions that have the same exact mass as PSs with 4 more carbons and one less double bond than the PC.1,3,4 In the positive mode, the two classes of lipids, which ionize to form [M+H]+ ions, would exhibit distinct masses. Thus, ideally, to distinguish them, PCs and PSs could be analyzed in positive mode. The analysis and detection of PSs in the positive is, however, complicated by: i) their lower ionization efficiency relative to that of PCs, and; ii) their lower concentration in biological samples relative to the PCs (e.g. in human plasma, PSs are at 7 nmol/ml and PCs are ~2000 nmol/ml.17 These two factors lead to the ion suppression of PSs by the more concentrated and better ionizing PCs. The use of LC separations does not mitigate this problem since these two classes of lipids elute in the same chromatographic region and are not easily separated.13,16,18
The complications of analysis of PSs in the positive mode are illustrated in Figure 1. This figure shows two chromatograms comparing the positive and negative mode analysis of an equimolar concentration of a PC and a PS standard. Because the fatty acyl (FFA) chain length and level of saturation has been shown to affect ionization efficiencies of lipids within the same class, 19,20 we used PC and the PS standards that have the same FFA chain composition so as to ensure that the difference observed in ionization efficiency is due to a difference in their head groups. In the positive mode (Figure 1A), the MS signal of the PS is ~40x lower than that of the PC (the ion count of the PC is 1.6E7, while that of the PS is 3.8E5), while in the negative mode (Figure 1B), the signal of PS is only ~3X lower than that of the PC (the ion count of the PC is 2E6, while that of the PS is 8.4E5). These results indicate that in complex samples, when both PS and PC are of interest, they are best analyzed in the negative mode. Furthermore, for those PCs and PSs which have sufficient abundance for MS/MS analysis, negative ion mode with MS/MS analysis enables the assignment of their FFA chains.17,21,22 For these two classes of lipids, even with the same exact mass, MS/MS analysis provides a way to distinguish them, since they would have different FFA chain composition. For low concentration lipids, however, the MS signal of the parent ion is not at a high enough intensity to yield MS/MS fragments, and these lipids are the focus of the work presented here.
Figure 1.
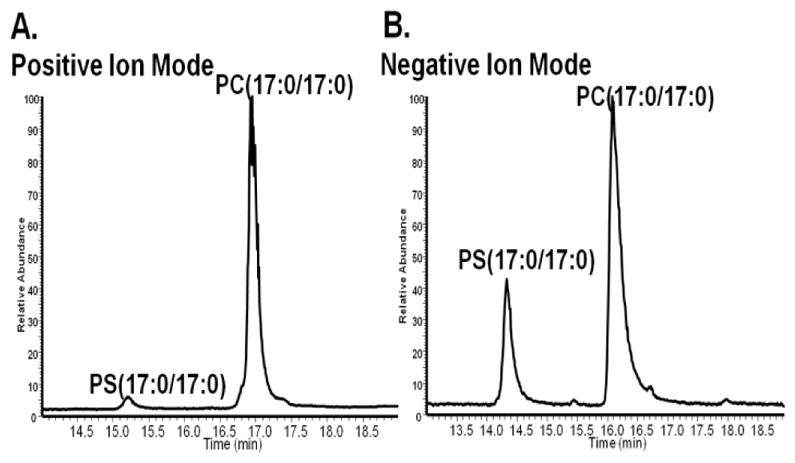
LC-MS chromatograms of an equimolar concentrations (32 μM) of PS (17:0/17:0) and PC (17:0/17:0). A: Positive mode analysis of PS (17:0/17:0) and PC (17:0/17:0) B: Negative ion mode analysis of PS(17:0/17:0) and PC (17:0/17:0).
We hypothesized that the use of deuterated salts would enable us to distinguish PCs from PSs on a lipidomics profiling platform. Specifically, the use of deuterated formate (or acetate) is predicted to shift the mass of PCs by the number of deuterium atoms in the salt (one or one to three, respectively). The schematic (Figure 2), shows the expected reaction behavior of an isobaric PC and PS when protiated or deuterated formate are used as the additives. Figure 2A shows the expected transformation of a PC (PC (36:1); (18:0/18:1)) after analysis with deuterated formate ( i.e. 1 Da mass shift), while Figure 2B shows the m/z of a PS (PS (39:0); PS (18:0/21:0), which has the same exact mass as the PC (36:1) but its m/z is not shifted in the presences of deuterated formate.
Figure 2.
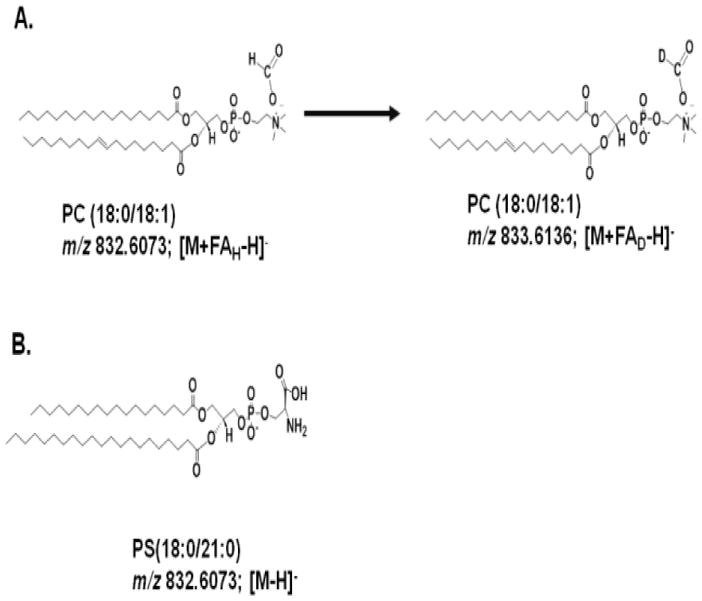
PC (36:1) and PS (39:0) exhibit the same exact mass upon negative mode ionization in the presence of formate. A: The proposed transformation of PC 36:1 after analysis with mobile phases that contain deuterated formate (FAD). B: The m/z of PS (39:0) is expected to remain the same after analysis with mobile phases that use either deuterated or protiated formate.
The experimental work presented here is in two parts. In the first part, we used lipid standards and a model complex sample to develop and to validate our method. This work included evaluating the effects of using deuterated formate on both the LC and the MS components. With respect to the LC, we evaluated whether deuteration led to retention time shifts relative to the retention time observed when protiated formate was used in the analysis of lipids. With respect to the MS, we evaluated whether any memory effects were observed when the solvents were switched back to using protiated formate and vice versa. In the second part of this study, the validated method was applied to the definitive identification of lower abundance PSs (in the presence of isobaric PCs) in a biological sample. In both parts of the study, the assignments of PCs and PSs were based on a comparison of mass spectra after analysis with protiated and deuterated solvents.
To test our hypothesis, we first assessed whether we could take advantage of the differential ionization of PCs and PSs to distinguish them in the negative mode. In this part of the study, we initially sought to confirm that we could shift the mass of PCs by substituting protiated formate with deuterated formate. For this analysis, a mixture of a PC standard [PC (17:0/17:0)] and a PS standard [PS (17:0/17:0)] was directly infused into the MS under two conditions: i) with the mobile phase containing protiated formate (FAH, Figure 3A), and; ii) with the mobile phase containing deuterated formate (FAD, Figure 3B) . In both spectra, m/z of PS (17:0/17:0) is observed as an [M−H] − ion and remains the same while that of PC(17:0/17:0) is shifted by 1 Da (difference in mass of a deuterium atom vs a hydrogen atom) when FAD is used in the mobile phase. These results prove our hypothesis that the use of FAD would shift the mass of PCs by 1 Da and thus distinguish them from PSs with the same mass.
Figure 3.
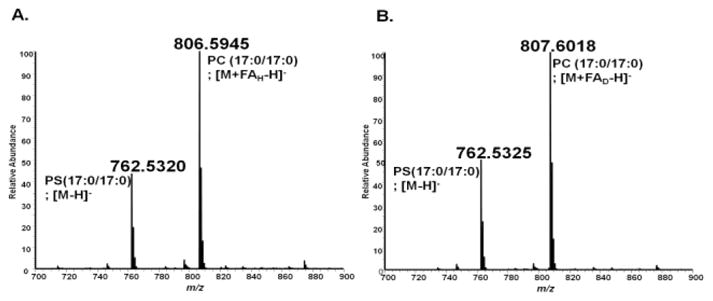
Direct infusion negative mode analysis of a mixture of PC (17:0/17:0) and PS (17:0/17:0). A: Analysis of the PC and PS mixture with solvent comprised of protiated ammonium formate (FAH). Both the M−H ion of the PS and the M+FA-H ion of the PC are observed. B: Analysis of the PC and the PS mixture with a solvent comprised of deuterated formate (FAD). The m/z of PS (17:0/17:0) remains the same ([M−H]-), but the m/z of PC(17:0/17:0) is shifted by 1 Da (the mass difference between a hydrogen and a deuterium atom) from 806.5945 to 807.6018. The instrument mass error is 5ppm.
Evaluation of the LC-MS method with deuterated salts
We now turned to evaluate the effect of switching between FAH and FAD on an LC-MS experiment. The LC-MS method used is a previously published method developed in our lab that we have been using for lipidomics profiling.13,16 We directly determined the effect that deuteration has on PCs in a complex sample analyzed by LC-MS. The complex sample used for this analysis is a commercially available egg yolk extract that is comprised of twelve PCs. The mixture was analyzed with mobile phases containing FAH and again with mobile phases containing FAD. The results of the LC-MS analysis were consistent with the direct infusion experiment and upon LC-MS analysis with FAD a mass shift of 1Da was observed for all the PCs in the egg extract mixture.
It is difficult to obtain 100% deuterated compounds, and there is always residual protiated form. The purity of the deuterated form ranges from 95% to 99.9%, purer forms are usually more expensive. The presence of the protiated form can lead to MS spectral complications because both forms, i.e. the deuterated and the protiated forms can potentially be observed. In our work, since we were interested in shifting the mass of PCs so we could distinguish them from isobaric PSs, the observation of protiated form of the PCs could potentially interfere with our data interpretation for co-eluting isobaric PCs and PSs. Using the PC egg-yolk mixture, we therefore assessed whether, in the context of the FAD (specifically, formate with reported ~98% deuteration) analysis conditions, the intensity of the protiated form of the PC would be high enough to interfere with our LC-MS analysis. A representative example of the ratio of the ion intensity of the protiated vs. the deuterated forms of a PC is shown in Figure 4. The figure shows a spectrum of PC (34:1), and it shows the ion count of the deuterated form and its residual protiated form. We found that, for all PCs in the egg yolk, the residual protiated form of the PCs was at ~0.5% when compared to the signal of the deuterated form. Notably, the lipid shown in Figure 4 is a high concentration PC; in the case of a lower concentration PC, the intensity of the protiated form might well fall below the limit of detection. We note that, if the mobile phase used for lipidomics analysis contains both a salt and an acidic additive, the acid should be also used in its deuterated form. Specifically, we have shown that, when our mobile phases contain both formate and formic acid, the use of deuterated formate together with protiated formic acid resulted in both the protiated and the deuterated forms of the PCs being observed. The signal of protiated form of the PC was found to be at ~50% of the signal of its deuterated form (Supplemental Figure 1).
Figure 4.

The residual protiated peak of a PC [PC(34:1)] is observed at 0.5% of the deuterated peak when LC-MS analysis is performed with >95% deuterated formate and deuterated formic acid.
We next showed that this approach did not lead to carry-over effects that could confound analysis. When switching between LC solvents with different chemical compositions, there is a possibility of observation of carry-over (memory effects) from one solvent system to the next. Memory effects can affect a method’s reproducibility, in-turn affecting data interpretation. With this in mind, we tested whether there was any memory effects on the MS when switching from deuterated to protiated solvents. This was needed to avoid the observation of both deuterated and protiated ions at an intensity that would interfere with spectral interpretation. Secondarily, we wanted to measure the amount of time it would take to equilibrate the system with either deuterated or protiated solvents. For this assessment, after analyzing samples in protiated solvents, the system (LC pumps, tubing and column) were flushed with 50:50 mobile phase A:B for 30 minutes, the column was then equilibrated at starting mobile phase for 15 minutes (10 column volumes) and the egg yolk PC mixture injected into the system. The experiment was repeated by switching from deuterated solvents to protiated solvent. The results (not shown), showed no memory effects when switching between deuterated and protiated solvents thus no precautions (e.g. cleaning the MS, switching columns) were required when analyzing samples with and without deuterated solvents.
We then showed that deuterated additives did not detrimentally affect retention time [RT] in our study. Previous studies have shown that substitution of protiated LC solvents with deuterated solvents can affect the RT of compounds of interest in some experimental paradigms23–25. A shift in RT is observed due to the deuterium isotope effect, which changes the interaction of different compounds with the stationary phase. The size and direction of any RT shift is dependent on the number of deuterium atoms in a molecule, with compounds with more deuterium atoms showing a larger shift. In most cases, deuterated compounds show less interaction with the stationary phase; in RPLC, they typically elute before the protiated compounds, but there are cases where the reverse has been observed25. A large RT shift can affect the data interpretation, especially if it also leads to a change in the retention order of lipids. This is especially important because our method relies on comparing data between separate analyses performed with protiated and with deuterated solvents. To determine any effect the substitution of deuterium had on our chromatography; we analyzed a mixture of seven phospholipids (PLs) with distinct ionization mechanisms. They included PG, PC, PE and PS (Figure 5). The two chromatograms shown indicated that the use of FAD did not significantly shift the RT of PCs and most importantly, it did not affect the retention order of PLs. Specifically, the RT difference between PG (18:1/18:1) and PC(18:1/18:1) in FAH is ~1.16 minutes, and it is ~1.17 minutes in FAD. The RT difference of PC (17:0/17:0) and PE (17:0/17:0) is 0.46 minutes in FAH and is 0.43 minutes in FAD. These results indicate that substituting FAH with FAD does not significantly affect the RT of PCs. This is probably due to having a single deuterium in the formate, which does not have a large effect on RTs.
Figure 5.

Comparison of retention times of lipid standards analyzed using either protiated or deuterated formate. A: The separation of a mixture of phospholipids with protiated additives (formate/formic acid). B: The separation of phospholipids with deuterated additives (formate/formic acid). The slight shift observed in retention time can be attributed to injection-to-injection variation.
Application in a Rat Liver Mitochondrial Lipid Extract
The method utilizing FAH and FAD was used to distinguish low level PSs from PCs in a pooled liver mitochondrial lipid extract. We then matched the identified PSs to the liver mitochondrial extracts from the individual OP and OR rats, and we assessed whether there were statistically significant differences between the OP and OR rats. The analysis of the mitochondrial pool with FAH and FAD shows the same chromatographic pattern (Figure 6). These results agree with those obtained with standards, whereby the same chromatography is obtained when samples are analyzed with FAH and FAD. This ensures that comparison between the two solvent systems is valid. The shift in RT is similar to what is observed due to day-to-day variations observed when mobile phases and/or columns are switched. The results also show that in FAD, the mass of all lipids that contain a choline moiety (i.e. sphingomyelins and PCs), which ionize via adduction with formate, are shifted by 1 mass unit (Figure 6B). These results further validate the results obtained with standards, showing that the overall method can be used in analysis of biological samples, and extending the potential utility of the method to the sphingomyelins.
Figure 6. LC-MS analysis of a liver mitochondrial pool with protiated and deuterated formate and formic acid.

A: The phospholipid (PL) and sphingolipid (SL) region of a mitochondrial pool analyzed with protiated additives (formate/formic acid). The retention time and m/z of some peaks are shown.
B: The PL and SL region of the same mitochondrial pool analyzed with deuterated additives (formate/formic acid). A mass shift of 1 Da is observed for all LC peaks that contain a choline moiety. Note that the data shown are raw chromatograms and no retention time alignment has been performed. The axes are presented shifted by ~ 30 seconds, and major peaks of interest are linked between panels A and B by arrows to highlight the conserved order of elution. The ion count of the most abundant phospholipid (PC (38:4) at RT 13.99 in deuterated formate was 1.2E7. The ion count of the most abundant PS (PS(38:4) at RT 12.77 was 8.4E4 and of the ion count of the least abundant PS, PS (38:7) at RT 11.29 was 4.6E2 (both in deuterated formate/formic acid).
The use of both FAH and FAD enabled us to distinguish isobaric PSs and PCs. This is exemplified in Figure 7, wherein two LC peaks in the mitochondrial extract that exhibit the same mass are definitively identified as a PS and a PC by using FAH and FAD. Notably, in FAH, the ion intensity of the parent ion for both peaks was not sufficient to enable MS/MS analysis. Figure 7A (Top Panel) shows two LC peaks (RT 10.85 and 12.78 minutes) that represent an extracted ion chromatogram (XIC) of m/z 782.4978. This mass (based on a database search), is either the [M−H] − ion of PS(36:4), or the [M+FA-H] − ion of PC(33:5). When the mitochondrial extract is re-analyzed with FAD (Figure 7B) and the same mass is extracted, only one LC peak (RT 11.27) is observed, an indication that this peak is PS (36:4). The XIC of second peak (RT 13.21), (i.e 783.5040), shows that the m/z of the second peak is shifted by one mass unit, an indication that the second LC peak is PC (33:5). In addition to distinguishing isobaric PC and PSs, the use of our method enabled us to definitively identify 13 low concentration PSs (Supplemental Table 1) that would otherwise have not been identified. We note that of these 13 PSs, only one (PS 38:4) was observed in both the positive and the negative ion modes. We also note that when using deuterated solvent to distinguish PCs from PSs, if a mass that could be a PS was observed and immediately after it was followed by an odd mass that differed by one mass unit, that mass was eliminated as a residual from the protiated form of the formate.
Figure 7.

Analysis of a liver mitochondrial extract with protiated additives (formate/formic acid) or deuterated additives (formate/formic acid) to distinguish isobaric PCs and PSs with the same exact mass. A: The extracted ion chromatogram (XIC) of m/z 782.4978 (+/− 5 ppm) in protiated formate/formic acid shows two peaks with that mass. B: The XIC of m/z 782.4978 (+/− 5ppm) shows a single peak which represents a PS. The mass of the second peak (XIC 783.5040 +/− 5 ppm) is shifted by 1 Da to 783.5026 -- an indication that it is a PC.
The above analysis enabled strain-specific (i.e. OP or OR) differences in PSs to be identified. We performed a Mann-Whitney U test on the four most abundant PSs (Figure 8) in the mitochondrial liver extract to establish differences between the OP and OR rats. The other PSs that had been identified in the pool fell below our determined level for quantitation. The results indicated that there were statistical differences in three of the four most abundant PSs, i.e. PS (40:7), PS (38:4) and PS (40:6) (Figure 8); all three were elevated in the metabolically protected strain. Specifically, PS (40:7) and PS (38:4) were 20% elevated in the OR rats when compared to OP rats while PS (40:6) was 90% elevated in OR rats when compared to the OP rats. This finding requires further validation to establish the biological relevance of these lipids in the early stages of pre-diabetic metabolic dysfunction.
Figure 8.
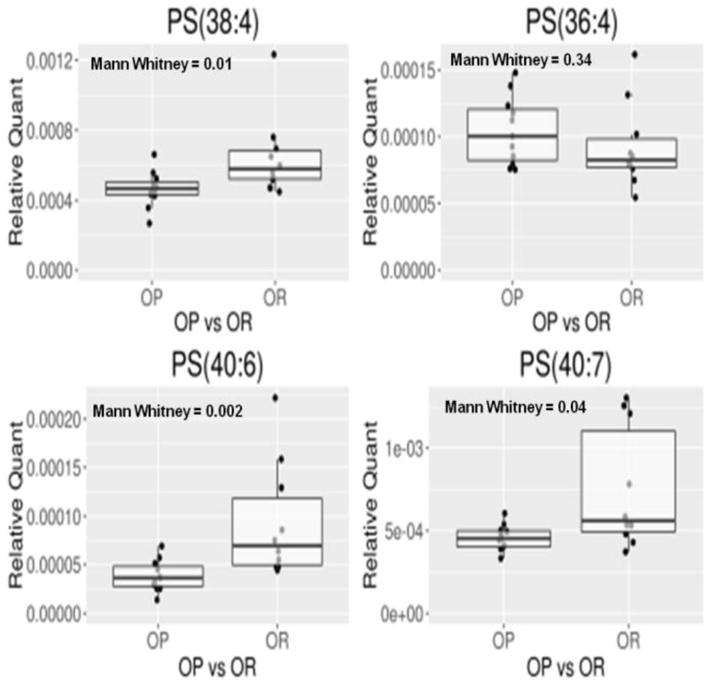
Comparison of the four most abundant PSs in rat liver mitochondria of obesity prone (OP) and obesity resistant (OR) rats. The raw data is normalized to the sum of the top hundred most intense ion to emphasize shifts of the relative abundance of these lipids.
In summary, we have developed a method that uses FAD to enable us to distinguish PCs and PSs by taking advantage of their distinct ionization mechanisms in negative ionization mode. A key difference for their ionization is that the head group of PCs contains a quaternary ammonium group that adducts with salts while PSs ionize by hydrogen abstraction from the phosphate group. The analysis of samples sequentially with FAH and FAD makes it possible to simultaneously analyze and distinguish PCs and PSs without preselecting one.
The method is robust in the analysis of complex mixtures, such as isolated liver mitochondria. The use of deuterated solvents, which have the same physico-chemical characteristics as their protiated counterparts, does not dramatically affect the chromatographic separation or the ionization of lipids, facilitating analysis of lipids between protiated and deuterated solvents. We have also shown that switching from FAH to FAD does not leave any memory effects and requires the same amount of equilibration time as regular analysis when FAH.
The cost of deuterated solvents can be considered a drawback. However, the method developed minimizes the cost because deuterated solvents only need to be used for structural confirmation in a single analytical run and not in large scale profiling experiments.
Conclusion
To our knowledge, this is the first method that shows the use of deuterated salts to distinguish between PCs and PSs in a single analysis. The method enables the observation of PSs in the presence of PCs in their native biological state without having to chemically transform them. The substitution of protiated solvents with deuterated solvents to distinguish isobaric lipids that undergo distinct ionization mechanisms is generally applicable not only in the field of lipidomics but also in other small molecule analysis. The method presented here improves the ability to identify and characterize lipids in-turn getting us closer to understanding the biological significance of specific lipids.
Supplementary Material
Acknowledgments
The work was supported by 1P01CA168530 (Loic Le Marchand, PI; BSK, Project Leader, Project 3) and the Nutrition Obesity Research Center at Harvard (NORCH) metabolomics and lipidomics core (Allan Walker PI, BSK) and a NORCH pilot feasibility project (IGS, PI) as part of NIH grant 5P30DK040561-20 (S.Grinspoon PI)
BSK is the inventor on general metabolomics-related IP that has been licensed to Metabolon via Weill Medical College of Cornell University and for which he receives royalty payments via Weill Medical College of Cornell University. He also consults for and has a small equity interest in the company. Metabolon offers biochemical profiling services and is developing molecular diagnostic assays detecting and monitoring disease. Metabolon has no rights or proprietary access to the research results presented and/or new IP generated under these grants/studies. BSK's interests were reviewed by the Brigham and Women's Hospital and Partners Healthcare in accordance with their institutional policy. Accordingly, upon review, the institution determined that BSK's financial interest in Metabolon does not create a significant financial conflict of interest (FCOI) with this research. The addition of this statement where appropriate was explicitly requested and approved by BWH.
Footnotes
The supplemental information is available on the ACS publication website.
Supplemental Materials and Methods, Lipid Extraction and LC-MS Analysis
Supplemental Figure 1, Comparison of PC analysis with deuterated formate (98% deuterated) and 0.1% protiated formic acid or with deuterated formate and deuterated formic acid (98% deuterated)
Supplemental Table 1, List of PSs observed in a liver mitochondrial lipid extract
References
- 1.Fhaner CJ, Liu S, Zhou X, Reid GE. Mass Spectrom (Tokyo) 2013;2:S0015. doi: 10.5702/massspectrometry.S0015. [DOI] [PMC free article] [PubMed] [Google Scholar]
- 2.Rojas-Betancourt S, Stutzman JR, Londry FA, Blanksby SJ, McLuckey SA. Anal Chem. 2015;87:11255–11262. doi: 10.1021/acs.analchem.5b02243. [DOI] [PMC free article] [PubMed] [Google Scholar]
- 3.Hsu FF, Turk J. J Am Soc Mass Spectrom. 2005;16:1510–1522. doi: 10.1016/j.jasms.2005.04.018. [DOI] [PubMed] [Google Scholar]
- 4.Han X, Gross RW. J Am Soc Mass Spectrom. 1995;6:1202–1210. doi: 10.1016/1044-0305(95)00568-4. [DOI] [PubMed] [Google Scholar]
- 5.Hsu FF, Turk J. J Chromatogr B Analyt Technol Biomed Life Sci. 2009;877:2673–2695. doi: 10.1016/j.jchromb.2009.02.033. [DOI] [PMC free article] [PubMed] [Google Scholar]
- 6.Fhaner CJ, Liu S, Ji H, Simpson RJ, Reid GE. Anal Chem. 2012;84:8917–8926. doi: 10.1021/ac302154g. [DOI] [PMC free article] [PubMed] [Google Scholar]
- 7.Halket JM, Waterman D, Przyborowska AM, Patel RK, Fraser PD, Bramley PM. J Exp Bot. 2005;56:219–243. doi: 10.1093/jxb/eri069. [DOI] [PubMed] [Google Scholar]
- 8.Lam W, Ramanathan R. J Am Soc Mass Spectrom. 2002;13:345–353. doi: 10.1016/S1044-0305(02)00346-X. [DOI] [PubMed] [Google Scholar]
- 9.Tolonen A, Turpeinen M, Uusitalo J, Pelkonen O. Eur J Pharm Sci. 2005;25:155–162. doi: 10.1016/j.ejps.2005.02.005. [DOI] [PubMed] [Google Scholar]
- 10.Olsen MA, Cummings PG, Kennedy-Gabb S, Wagner BM, Nicol GR, Munson B. Anal Chem. 2000;72:5070–5078. doi: 10.1021/ac000316p. [DOI] [PubMed] [Google Scholar]
- 11.Levin BE, Dunn-Meynell AA, Balkan B, Keesey RE. Am J Physiol. 1997;273:R725–730. doi: 10.1152/ajpregu.1997.273.2.R725. [DOI] [PubMed] [Google Scholar]
- 12.Madsen AN, Hansen G, Paulsen SJ, Lykkegaard K, Tang-Christensen M, Hansen HS, Levin BE, Larsen PJ, Knudsen LB, Fosgerau K, Vrang N. J Endocrinol. 2010;206:287–296. doi: 10.1677/JOE-10-0004. [DOI] [PubMed] [Google Scholar]
- 13.Bird SS, Marur VR, Sniatynski MJ, Greenberg HK, Kristal BS. Anal Chem. 2011;83:940–949. doi: 10.1021/ac102598u. [DOI] [PMC free article] [PubMed] [Google Scholar]
- 14.Bird SS, Marur VR, Stavrovskaya IG, Kristal BS. Metabolomics. 2013;9:67–83. doi: 10.1007/s11306-012-0400-1. [DOI] [PMC free article] [PubMed] [Google Scholar]
- 15.Bird SS, Stavrovskaya IG, Gathungu RM, Tousi F, Kristal BS. Methods Mol Biol. 2015;1264:441–452. doi: 10.1007/978-1-4939-2257-4_36. [DOI] [PMC free article] [PubMed] [Google Scholar]
- 16.Bird SS, Marur VR, Sniatynski MJ, Greenberg HK, Kristal BS. Anal Chem. 2011;83:6648–6657. doi: 10.1021/ac201195d. [DOI] [PMC free article] [PubMed] [Google Scholar]
- 17.Fahy E, Subramaniam S, Murphy RC, Nishijima M, Raetz CR, Shimizu T, Spener F, van Meer G, Wakelam MJ, Dennis EA. J Lipid Res. 2009;50(Suppl):S9–14. doi: 10.1194/jlr.R800095-JLR200. [DOI] [PMC free article] [PubMed] [Google Scholar]
- 18.Nzoughet JK, Gallart-Ayala H, Biancotto G, Hennig K, Dervilly-Pinel G, Le Bizec B. Metabolomics. 2015;11:1884–1895. [Google Scholar]
- 19.Koivusalo M, Haimi P, Heikinheimo L, Kostiainen R, Somerharju P. J Lipid Res. 2001;42:663–672. [PubMed] [Google Scholar]
- 20.Han X, Gross RW. Proc Natl Acad Sci U S A. 1994;91:10635–10639. doi: 10.1073/pnas.91.22.10635. [DOI] [PMC free article] [PubMed] [Google Scholar]
- 21.Schuhmann K, Almeida R, Baumert M, Herzog R, Bornstein SR, Shevchenko A. J Mass Spectrom. 2012;47:96–104. doi: 10.1002/jms.2031. [DOI] [PubMed] [Google Scholar]
- 22.Schuhmann K, Herzog R, Schwudke D, Metelmann-Strupat W, Bornstein SR, Shevchenko A. Anal Chem. 2011;83:5480–5487. doi: 10.1021/ac102505f. [DOI] [PubMed] [Google Scholar]
- 23.Iyer SS, Zhang ZP, Kellogg GE, Karnes HT. J Chromatogr Sci. 2004;42:383–387. doi: 10.1093/chromsci/42.7.383. [DOI] [PubMed] [Google Scholar]
- 24.Turowski M, Yamakawa N, Meller J, Kimata K, Ikegami T, Hosoya K, Tanaka N, Thornton ER. J Am Chem Soc. 2003;125:13836–13849. doi: 10.1021/ja036006g. [DOI] [PubMed] [Google Scholar]
- 25.Valleix A, Carrat S, Caussignac C, Leonce E, Tchapla A. J Chromatogr A. 2006;1116:109–126. doi: 10.1016/j.chroma.2006.03.078. [DOI] [PubMed] [Google Scholar]
Associated Data
This section collects any data citations, data availability statements, or supplementary materials included in this article.