

Abstract
There is growing interest concerning the ways in which the human body, both one’s own and that of others, is represented in the developing human brain. In two experiments with 7-month-old infants, we employed advances in infant magnetoencephalography (MEG) brain imaging to address novel questions concerning body representations in early development. Experiment 1 evaluated the spatiotemporal organization of infants’ brain responses to being touched. A punctate touch to infants’ hands and feet produced significant activation in the hand and foot areas of contralateral primary somatosensory cortex as well as in other parietal and frontal areas. Experiment 2 explored infant brain responses to visually perceiving another person’s hand or foot being touched. Results showed significant activation in early visual regions and also in regions thought to be involved in multisensory body and self–other processing. Furthermore, observed touch of the hand and foot activated the infant’s own primary somatosensory cortex, although less consistently than felt touch. These findings shed light on aspects of early social cognition, including action imitation, which may build, at least in part, on infant neural representations that map equivalences between the bodies of self and other.
1 | INTRODUCTION
Increasing attention is being given to the ways in which the body is represented in the human brain, both in terms of the perception of one’s own body and the perception of the bodies of others. One important source of information about neural representations of the body derives from studies examining brain responses to touch. This work has highlighted the presence of somatotopically organized representations of the body in primary somatosensory cortex (S1) (e.g., Kaas, 1997; Kaas, Jain, & Qi, 2002). A large literature with adult human and nonhuman primates has documented the properties of these “neural body maps” in S1, including demonstrations of experience-dependent plasticity (e.g., Buonomano & Merzenich, 1998; Elbert, Pantev, Wienbruch, Rockstroh, & Taub, 1995; Kaas, 1991).
Although a great deal is understood about neural body maps in adults, relatively little is known about their development in human infancy. Filling in this gap is important for two reasons. First, novel research on neural body maps in human infants has the potential to inform key questions about the functional specification and plasticity of cortical regions in relation to behavioral development (Gondo et al., 2001; Hahamy et al., 2017). Second, research on body maps in the somatosensory cortex of human infants can shed light on their role in facilitating connections between self and other in the first months of life, with potential implications for studying socialcognitive development and developmental disorders (Marshall & Meltzoff, 2015). A burgeoning literature with adults has examined the involvement of the somatosensory cortex in social perception (e.g., Gillmeister, Bowling, Rigato, & Banissy, 2017; Keysers, Kaas, & Gazzola, 2010; Lankinen et al., 2016), but far less work has been done with infants.
Research employing infant electroencephalography (EEG) and magnetoencephalography (MEG) has begun to shed light on how the developing human brain responds to touch (for reviews see, Nevalainen, Lauronen, & Pihko, 2014; Saby, Meltzoff, & Marshall, 2016). To date, most studies in this area have focused on tactile stimulation of the hand. In accord with brain studies of adults, a touch to the infant’s hand elicits responses that are strongest at sensors located over the lateral central region in the hemisphere contralateral to the stimulation (Pihko et al., 2004; Pihko, Nevalainen, Stephen, Okada, & Lauronen, 2009; Rigato, Begum Ali, van Velzen, & Bremner, 2014; Saby, Meltzoff, & Marshall, 2015).
Compared with studies involving only stimulation of hand, very few studies have examined infant brain responses to tactile stimulation of other body parts, which is essential for building a more complete picture of neural body maps in the developing brain. In one such study, Saby et al. (2015) examined EEG responses to a tactile stimulus delivered to four body parts (left and right hands and feet) in 7-month-old infants. A computer-controlled tap on the infant’s left or right hand elicited a larger response at the lateral electrode in the central region of the contralateral hemisphere (electrodes C4 and C3, respectively) than at the midline central electrode (Cz); and a tap to the left and right foot elicited a larger response at the midline central electrode than at the lateral central sites. A broadly similar topographic pattern was reported by Milh et al. (2007) in an EEG study of preterm newborns in which “gentle caressing” of infants’ hands and feet evoked delta-brush activity (a characteristic of preterm EEG that disappears around term age). However, inferences from this study are limited because it involved passive movement of the infant’s limbs, a small sample size, and visual inspection of the raw EEG signal rather than the quantitative analysis of somatosensory evoked responses.
The pattern of EEG responses obtained to stimulation of infants’ hands and feet is roughly consistent with what one would expect if there were a somatotopic organization in the infant somatosensory cortex. However, measurements derived from EEG scalp electrodes are based on a mixture of signals arising from the whole brain, and therefore provide only a rough indication of source locations. In the first of two experiments (Experiment 1) we capitalized on advances in infant MEG brain imaging to more closely examine, at the source level, both the spatial and temporal aspects of infant brain responses to felt touch. In the second experiment (Experiment 2), we applied these same advances to examine infant brain responses to observed touch, with the aim of shedding light on possible connections between infants’ representation of their own bodies and the perception of the bodies of others.
1.1 | Registering self–other bodily correspondences
A major area of interest in developmental science concerns the development of linkages between one’s own body and the bodies of others. Although these linkages play a role across the lifespan, they have particular significance in the first months and years of life. The ability to register correspondences between self and other is an important part of the capacity for interpersonal engagement in human infancy (Rochat, 2009). This capacity includes the imitation of others’ behaviors, skills, and mannerisms, which provides a mechanism for social learning and plays a role in the development of social cognition prior to spoken language (Meltzoff, 2013; Tomasello, 1999). It has been suggested that an initial step in infant imitation is establishing a “match” between the specific effector used by another person and the corresponding effector on one’s own body (Meltzoff & Moore, 1997). The current study is partly aimed at elucidating whether data from infant brain imaging can further illuminate this theoretical proposal.
Prior experimental work with infants has begun to explore neuroscience correlates of this matching process by investigating the modulation of the sensorimotor mu rhythm in the infant EEG during the observation of an adult achieving a goal by using her hand or her foot (Saby, Meltzoff, & Marshall, 2013). The infant mu rhythm exhibited a degree of somatotopy, such that observation of hand actions was associated with greater mu desynchronization at lateral central electrode sites, and observation of foot actions was associated with greater desynchronization at the midline central electrode. A similar somatotopic pattern of mu rhythm desynchronization has been documented during infants’ own production of hand and foot actions (de Klerk, Johnson, & Southgate, 2015; Marshall, Saby, & Meltzoff, 2013). These findings are consistent with a much larger infant EEG literature suggesting an involvement of the sensorimotor system in action perception (for reviews, see Cuevas, Cannon, Yoo, & Fox, 2014; Marshall & Meltzoff, 2014). However, the focus of this prior literature has been on infant goal-directed acts rather than specifically on neural responses to touch and somatosensory aspects of self–other connections, which are the focus of the current studies.
1.2 | Current experiments
Prior studies of infant responses to touch have not involved source localization of neural responses to multiple effectors (e.g., hands and feet) and have not tested responses to both felt touch and seeing others being touched in the absence of being touched oneself. To fill this gap, we designed two infant MEG experiments involving awake 7-month-old infants. Experiment 1 involved delivering precisely controlled tactile taps to infants’ hands and feet. The results of this study were expected to provide a much finer level of spatial and temporal detail on brain responses to tactile stimulation than has been possible in prior infant studies. In Experiment 2, the infants’ own bodies were not touched. Instead, infants visually observed an adult hand or foot being touched. Some EEG work with infants has begun to examine brain responses to somatosensory stimulation during the observation of touch to others (Rigato et al., 2017). In our second experiment we employed advanced source localization methods to examine infant cortical responses to the viewing of tactile stimulation of others, in the absence of touch to the infant’s body. The rationale for the second experiment is based on findings that when older children and adults see another person’s body being touched, there is activation of the observer’s own somatosensory cortex (e.g., Gillmeister et al., 2017; Keysers et al., 2010; Pihko, Nangini, Jousmäki, & Hari, 2010; Remijn et al., 2014). If traces of such activation could be detected in the infant brain, it would inform the theoretical proposition that infants can register correspondences between their own and other people’s bodies, with implications for the development of interpersonal connectedness and early social cognition.
The data were acquired with a whole-head MEG sensor array using advanced signal processing approaches including infant head movement tracking and compensation. Studying infants between 6 and 12 months of age allows sustained MEG data collection in awake infants, as demonstrated by studies of speech processing in the infant brain (Ferjan Ramírez, Ramírez, Clarke, Taulu, & Kuhl, 2017; Kuhl, Ramírez, Bosseler, Lin, & Imada, 2014; Zhao & Kuhl, 2016). In the current paper we conducted source localization using both single dipole fits and a distributed linear method that allowed us to identify a network of infant brain activity to felt and observed touch. We further applied state-of-the-art statistical methods including conjunction analyses (Benjamini & Heller, 2008) that are especially well suited to infants and other populations expected to have marked inter-subject variation in neural responses.
2 | EXPERIMENT 1: INFANT BRAIN RESPONSES TO FELT TOUCH
2.1 | Methods
2.1.1 | Participants
The participants were awake and alert 7-month-old infants tested in a narrow age window (32 weeks ± 14 days old). To further minimize inter-subject differences, three predetermined criteria were used for recruiting infants: (a) > 37 weeks gestational age, (b) typical birth weight (2.5–4.5 kg), and (c) no significant health or developmental problems. The infants were recruited through a central subject pool maintained at the University of Washington. Soon after birth, parents received a postcard asking about participation in infant research. Parents who returned the card indicating interest were entered into the computerized pool, and were subsequently contacted by individual laboratories to solicit participation. Families received a nominal gift for participating. Recruitment and experimental procedures were approved by the university Institutional Review Board (IRB), and parental informed consent was obtained.
A total of 30 infants began MEG testing. Of these, two were excluded due to technical issues and 7 were excluded for having fewer than 200 accepted trials. This left 21 infants who contributed analyzable data (Mage = 32.8 weeks, SD = 0.7, 16 males). For these 21 participants, 14 infants had a sufficient number of accepted trials (≥ 200) for only one effector (hand or foot), and seven other infants had a sufficient number of accepted trials for both effectors (hand and foot) (see Stimuli). Therefore, analyses are based on data from 14 infants in the hand condition and 14 infants in the foot condition.
2.1.2 | Stimuli
Tactile stimulation was applied to the dorsal surface of the infant’s right hand or right foot using an inflatable diaphragm (Figure 1A; MEG International Services, Coquitlam, BC, Canada), similar to one used in other MEG and EEG studies involving somatosensory stimulation (e.g., Pihko et al., 2009; Riquelme & Montoya, 2010; Saby et al., 2015). When the diaphragm was expanded, it resulted in a punctate “tap” on the hand or foot. Although the palm of the hand would (presumably) have greater sensitivity than the dorsal surface, the latter was used because pilot testing showed that the diaphragm could not be securely affixed to the palm—infants tended to open and close their hands around the diaphragm, loosening contact with the skin.
FIGURE 1.
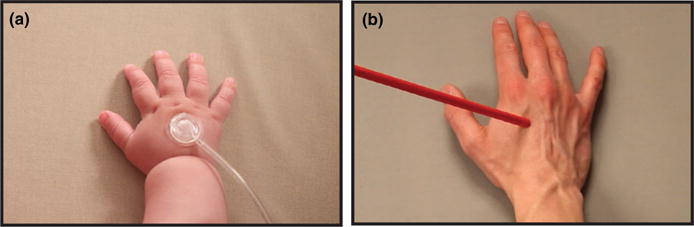
Experiment 1 examined infants’ response to felt touch. (a) Example photograph of tactile stimulator used in Experiment 1. Infants were stimulated on the right hand (or foot) by an inflatable diaphragm. Experiment 2 examined infants’ responses to observed touch. (b) Single video frame extracted from the visual stimulus shown to infants in Experiment 2 at the point when the rod contacted the hand. Infants watched a hand (or foot) being touched
The inflatable diaphragm was mounted in a plastic casing (10 mm diameter) and was attached to the midpoint of the dorsal surface of the hand and foot using an adhesive electrode collar reinforced with medical tape and covered with a tubular bandage. The diaphragm was inflated by a short burst of pressurized air delivered via polyurethane tubing (5 m length). Air delivery was controlled by E-Prime stimulus presentation software in combination with a pneumatic stimulator unit (James Long Company, Caroga Lake, NY) and a regulator that restricted airflow to 100 psi. For each tactile stimulus, a trigger generated by the E-Prime software caused a solenoid in the pneumatic stimulator to open for 10 ms. The airflow that produced an expansion of the diaphragm (attached to the infant’s hand or foot) began 20 ms following the trigger. The force delivered peaked at about 40 ms following the first diaphragm movement. The delay between the trigger and membrane expansion is accounted for in the analyses such that time zero corresponds to the onset of diaphragm movement at the skin surface. The pneumatic stimulator and regulator were housed in a soundproofed box located in a separate room, not in the magnetically shielded room (MSR), to ensure that any sounds produced by the stimulator were not audible to the infant. The burst of air originating in the separate room traveled through closed tubing that was capped on the infants’ end by the diaphragm that expanded a few mm to produce the “tap” on the skin. In pilot work we found that adults sitting in the seat and receiving taps did not report hearing noise associated with the apparatus.
Tactile stimulation was presented to the hand or foot with a stimulus-onset asynchrony (SOA) of 2000–2500 ms in a block of 480 trials (n = 7) or with an SOA of 1000–1500 ms in a block of 400 trials (n = 14). If the infant remained calm at the end of the first block, a second block with the other effector was immediately presented. Whether the hand or foot was presented first was counterbalanced across participants. During the MEG recording, infants watched an experimenter (who was inside the MSR) playing with toys. The infant’s parent was inside the MSR, seated behind the MEG out of the infant’s view.
2.1.3 | Experimental procedure
Prior to beginning the MEG scan, infants were seated in a customized high chair outside of the MSR, and a research assistant distracted the infant while the technician fitted a lightweight nylon cap containing five head position indicator (HPI) coils on the infant’s head. A three-dimensional Polhemus Fastrak digitizer (Colchester, VT, USA) was used to mark the locations of the five HPI coils relative to anatomical landmarks on each infant’s head (nasion and left and right pre-auricular points). Approximately one hundred additional points around the head were also digitized to determine each infant’s individual head shape to increase the accuracy of later data analysis. During recordings, the HPI coils were activated to generate signals that could be used to localize the position of the coils within the MEG helmet (dewar). This enabled us to continuously estimate the position and orientation of each infant’s head with respect to the MEG sensor array, which made it possible to reconstruct the magnetic fields offline as though they originated from a stationary head position. There was a variable amount of head movement made by different infants during the recording sessions. The head position-tracking procedure allowed for head movement compensation and rejection of epochs with excessive movement (see Epoch rejection and averaging, below).
Following digitization, infants were brought into the MSR and seated upright in an adjustable, padded infant seat under the MEG sensor array. The tactile stimulators were attached, and the adjustable seat was raised so that each individual infant’s head was at an optimal position in the MEG dewar. The MEG session lasted approximately 15 min, depending on how many trials were completed.
2.1.4 | MEG measurement
MEG data were collected using a whole-head MEG system (Elekta Oy, Helsinki, Finland) with 306 sensors (204 planar gradiometers and 102 magnetometers) located inside an MSR (IMEDCO, Noblesville, IN) at the University of Washington’s Institute for Learning & Brain Sciences. Signals were collected with a sampling rate of 1 kHz and bandpass filter settings of 0.03–330 Hz. The position of the infant’s head relative to the MEG sensor array was tracked continuously throughout the recording by extracting the signals emitted by five HPI coils fastened to the infant cap, which was taped to the head to avoid slippage during testing.
2.1.5 | MEG preprocessing
Acquisition of MEG data from awake infants poses challenges in terms of signal-to-noise ratio and movement-induced signal distortions. To address this, the raw MEG recordings underwent a series of standardized preprocessing steps to suppress noise from outside the MEG dewar and to compensate for the effects related to infants’ head movements during the recording. Similar procedures have been used in infant MEG studies of speech perception (Ferjan Ramírez et al., 2017; Kuhl et al., 2014). More specifically, the MEG data were preprocessed with temporal signal space separation (tSSS) (Taulu & Hari, 2009; Taulu & Simola, 2006) and head movement compensation (Taulu, Simola, & Kajola, 2005) transformed to the mean of each individual’s head position to minimize reconstruction noise. This head movement compensation method has been cross-validated in both adult and child studies (Medvedovsky, Taulu, Bikmullina, & Paetau, 2007; Wehner, Hämäläinen, Mody, & Ahlfors, 2008). For the exact low-resolution electromagnetic tomography (eLORETA) analyses, the data were then subjected to automatic cardiac artifact suppression with signal space projection (SSP) (Uusitalo & Ilmoniemi, 1997) and digital band-pass filtering (1–40 Hz). For sensor-level and equivalent current dipole (ECD) modeling, the data of all infants were transformed to the same head position (the mean of all infants) using a regularized version of movement compensation.
2.1.6 | Epoch rejection and averaging
The pre-processed data were epoched (−250 to 750 ms) relative to touch onset, and accepted epochs were averaged to obtain the event-related field (ERF) time series for each condition and participant. Epochs were rejected if they contained infant limb movement (see Behavioral annotation), if infant head position/orientation was unsatisfactory with respect to the MEG probe, or if the peak-to-peak amplitude was over 3 pT/cm (gradiometers) or 4 pT (magnetometers). The mean number of epochs retained after rejection for the hand and foot touch conditions were 331.5 (SD = 66.9) and 340.7 (SD = 82.2), respectively.
Behavioral annotation
Because limb movement is known to affect somatosensory evoked responses (Rushton, Rothwell, & Craggs, 1981), MEG sessions were video-recorded for the purposes of coding infant movement. During recording, an electronic trigger corresponding to stimulus onset was placed simultaneously on the video and the MEG records, allowing the two to be aligned offline. Videos were examined trial-by-trial using ELAN annotation software (Wittenberg, Krugman, Russel, Klassmann, & Sloetjes, 2006), and trials containing clearly discernable movements were marked and removed prior to analysis.
2.1.7 | Analyses
Source localization
Two inverse methods were used to estimate the sources of the measured magnetic fields: (a) equivalent current dipole (ECD) modeling (SI Methods, Section 1) and (b) exact low-resolution electromagnetic tomography (eLORETA), a distributed linear inverse method (Pascual-Marqui, 2007). SI Methods, Sections 2.1–2.3 contain details about the eLORETA source imaging and single-subject statistics. The results from eLORETA were expected to be compatible with and to extend the results of the ECD analyses.
Group analyses of eLORETA source estimates
The eLORETA time series consists of three waveforms per voxel corresponding to the amplitudes of the three dipole components in the x, y, and z directions as a function of time. Statistical mapping using Hotelling’s T2 tests of these waveforms provided p-maps for each individual subject (SI Methods, Section 2.3). Two types of group level analyses were applied to the p-maps: (a) subject consistency maps, which determine the number of subjects that surpassed a particular p-value threshold (SI Methods, Section 2.4), and (b) spatiotemporal subject partial conjunction (st-sPC) group analysis, an advanced and robust alternative to mixed/random effect analysis that determines the minimum number of subjects with significant activation under FDR control (Benjamini & Heller, 2008; Heller, Golland, Malach, & Benjamini, 2007), for details and motivation see S1 Methods, Section 2.5.
Software
Analyses were performed using in-house MATLAB software, except for: (a) tSSS and head movement compensation, which were carried out with MaxFilter (Elekta Oy, Helsinki, Finland), (b) ECD analyses, which was carried out with MNE (Gramfort et al., 2014), and (c) MRI cortical and subcortical segmentation, which was done with Freesurfer (Destrieux, Fischl, Dale, & Halgren, 2010).
2.2 | Results and discussion
Figure 2 shows the sensor-level grand average somatosensory evoked fields following hand and foot tactile stimulation. As predicted, the responses to hand tactile stimulation were apparent in more lateral sensors compared to those for foot tactile stimulation, which were concentrated around the midline. For both conditions, the grand average waveforms exhibited two large deflections within 400 ms of touch onset: An earlier peak around 100 ms followed by a later peak around 250 ms. Dipolar field patterns were observed during these early and late responses for both hand and foot tactile stimulation (see Figure S1).
FIGURE 2.
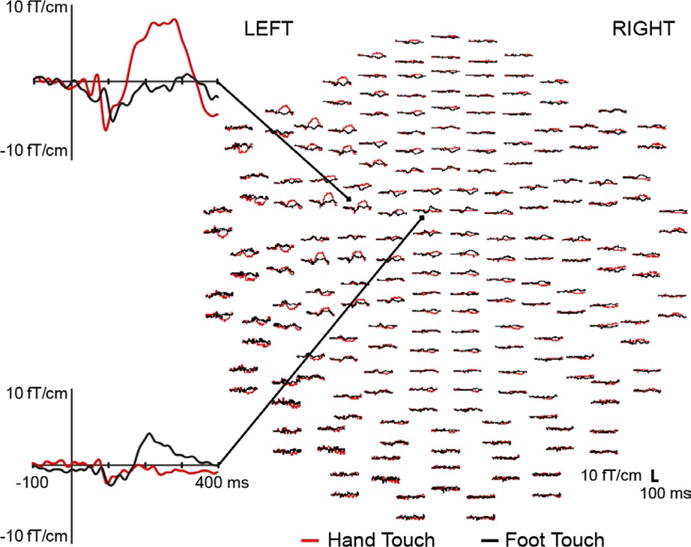
Whole-head view of gradiometers showing grand average waveforms for hand (red) and foot (black) tactile stimulus conditions in Experiment 1. An expanded view shows individual sensors proximal to the hand (top) and foot (bottom) areas of the contralateral somatosensory cortex. Waveforms are shown from −100 to 400 ms relative to touch onset. In presenting grand averages for visual inspection, it should be noted that there was variation in latencies across infants
The results of the ECD analyses are summarized in Table 1, which shows the localization results in the head coordinate system. Consistent with the prediction of a neural somatotopic organization, the source of the early hand response was more lateral (to the left) than the source of the early foot response (difference = 19 mm); for the late responses, the source of the hand response was also more lateral (difference = 20 mm). We tested the difference between the means for the hand and the foot conditions using a permutation test approach, which is increasingly being used in neuroscience (Ernst, 2004; Maris, 2012); it has minimal statistical assumptions and is appropriate for the type of data obtained in this experiment. We ran 10,000 random permutations of the observed data in a Monte Carlo simulation. The results showed a significant difference for both the early measurement, p = .024, and the late measurement, p = .0018.
TABLE 1.
Latency, coordinates, and goodness-of-fit (GOF) values of the dipoles for the early and late hand and foot responses
| Hand
|
Foot
|
|||
|---|---|---|---|---|
| M | SD | M | SD | |
| Early | ||||
|
| ||||
| Latency (ms) | 93 | (14) | 102 | (17) |
|
| ||||
| x (mm) | −31.4 | (16.1) | −12.8 | (21.6) |
|
| ||||
| y (mm) | 9.9 | (32.1) | 12.9 | (19.3) |
|
| ||||
| z (mm) | 60.2 | (17.2) | 68.8 | (19.9) |
|
| ||||
| GOF (%) | 82.7 | (11.9) | 89.6 | (7.4) |
|
| ||||
| Late | ||||
|
| ||||
| Latency (ms) | 259 | (50) | 236 | (52) |
|
| ||||
| x (mm) | −30.7 | (17.3) | −10.5 | (18.5) |
|
| ||||
| y (mm) | 15.6 | (20.5) | 17.0 | (11.7) |
|
| ||||
| z (mm) | 63.6 | (16.3) | 77.7 | (13.0) |
|
| ||||
| GOF (%) | 92.7 | (3.6) | 89.8 | (5.5) |
Note. All results shown as mean (SD). The x-axis runs from left to right (negative towards left), the y-axis from posterior to anterior, and the z-axis from inferior to superior. The origin was approximately at the middle point between two ears. Corresponding magnetic field patterns for the four latencies shown are provided in Supporting Information, Figure S1.
The eLORETA analyses yielded results compatible with those found with the ECD modeling. Current density estimates showed neural activity in hand and foot regions within contralateral S1 (BA3, 1, 2), and also in parietal (BA5, 7) and frontal (BA4, 6) areas. Statistical mapping of these current density estimates, using Hotelling’s T2 tests, provided single-subject p-maps. The maps revealed both inter-subject similarities and differences in their precise spatial distribution and latency. Two types of group-level analyses were applied to the p-maps.
First, we counted, at each voxel, the number of infants meeting a p < 10−6 threshold at any time point within the 0–400 ms window from touch onset. These subject consistency maps showed that 14/14 infants in the hand condition had activation of the contralateral S1 hand region in response to hand touch, and 13/14 infants in the foot condition had activation of the foot region in response to foot touch (Figure 3). Note that our approach does not restrict the analysis to predetermined regions of interest (ROIs). Rather the neural regions that were activated by touch of hand and foot automatically emerged from the spatial intersection where many subjects showed activity that passed the 10−6 threshold at the same voxel. Thus, these empirically determined regions or “hot spots” (Figure 3) naturally define the focus of activation in response to hand and foot touch without employing predetermined ROIs. The obtained spatial pattern of activated voxels accords with the hand and foot regions previously reported in MRI/fMRI studies (Arichi et al., 2010; Keysers et al., 2010; Ulmer, 2013; Williams et al., 2015), hence from this point on we employ the shorthand nomenclature of infant “hand and foot regions”.
FIGURE 3.
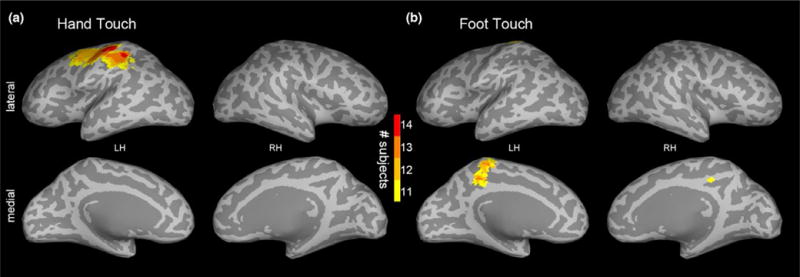
Experiment 1: (a) hand and (b) foot touch subject consistency maps showing, at each voxel, the number of infants (out of 14) meeting the p < 10−6 threshold at any time point within the 400 ms window following tactile stimulus onset. The maps are visualized with a lower bound of 11 subjects
The consistency maps provide informative and intuitive summaries of the single-subject statistics across a temporal window. Although the analyses used a conservative 10−6 threshold, they were not formally corrected for multiple hypotheses. Therefore, additional group analyses using spatiotemporal subject partial conjunction (st-sPC) mapping were undertaken to determine the minimum number of subjects with significant activation at each voxel and time point (millisecond) under false discovery rate (FDR) control (SI Methods, Section 2.5). Figure 4 shows the resulting st-sPC maps at four latencies.
FIGURE 4.
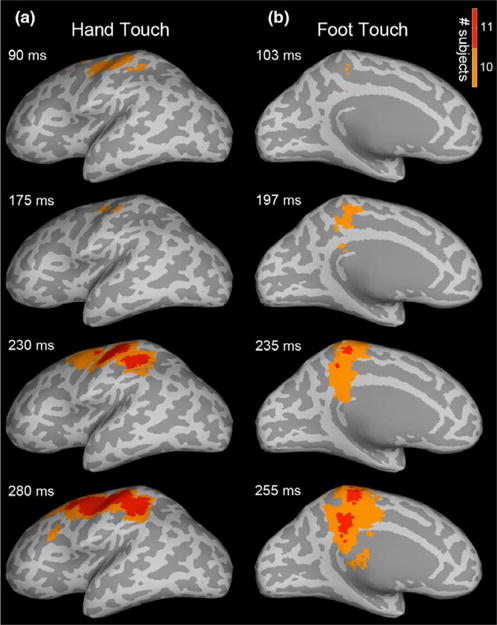
Experiment 1: Spatiotemporal subject partial conjunction (st-sPC) maps showing infant responses to tactile stimulation of hand (column a) and foot (column b). Maps are visualized on inflated cortical surfaces, displaying significant results for the two strongest hypotheses, H 10/140 and H 11/140 (i.e., at least 10 or 11 of the 14 subjects had a real effect, with FDR < 0.05), at example latencies after touch onset. Recurrent patterns of activation were observed in the contralateral S1 (BA3, 1, 2) hand and foot regions in response to hand and foot touch, respectively, and also in parietal (BA5, 7, IPS, IPL) and frontal (BA4, 6, SMA, IFS) areas. SI Movies 1 and 2 provide dynamic visualizations of these st-sPC maps
As shown, 11/14 infants in the hand condition had significant activation in the expected contralateral S1 (BA3, 1, 2) hand region in response to hand touch; and similarly, infants in the foot condition had significant activation in the contralateral foot region in response to foot touch. We also found significant activation in contralateral BA5, 7, intraparietal sulcus (IPS), inferior parietal lobule (IPL), supplementary motor area (SMA) and inferior frontal sulcus (IFS). Earlier S1 activity, prior to 90 ms, was also significant, but for a smaller subset of infants (SI, Figure S2). Note that the partial conjunction analyses, performed at every millisecond post-stimulus, were robustly corrected for multiple hypotheses across time and space. Using this approach, even a partial conjunction value of one means that at least one subject had a significant effect not attributable to chance, which allows the rejection of the “global null hypothesis” that no subject had a significant effect (Friston, Penny, & Glaser, 2005; Nichols, Brett, Andersson, Wager, & Poline, 2005). This conjunction approach is very useful in neuroscience studies using participants who are expected to have large inter-subject variation, such as infants. Using the partial conjunction approach, we can validly infer that at least 11 individual cases showed significant activity in the hand region at a given time point (voxel and ms accuracy) when the hand was touched (and similarly for foot).
3 | EXPERIMENT 2: INFANT BRAIN RESPONSES TO OBSERVED TOUCH
In Experiment 2 we used MEG to explore infant cortical regions activated by visual perception of someone else’s body being touched. Seven-month-old infants saw videos of an adult’s right hand or foot being touched by a wooden rod (Figure 1B). None of the infants had participated in Experiment 1.
The first experiment helped motivate Experiment 2 in three respects. First, it showed that our MEG methods could be used to examine cortical responses to somatosensory stimulation in awake infants. Previous infant MEG studies involving touch were limited to sleeping infants, which has the advantage of decreased movement. However, sleeping infants are not suitable for testing how the brain processes observed touch, because infants need to be awake to see the tactile event. Second, the first experiment served to localize brain areas within primary somatosensory cortex that activate in response to touch. The results documented regions within S1 that can plausibly be labeled as hand and foot regions in 7-month-old infants. Prior EEG studies were suggestive but insufficient to localize the source of responses to touch in the infant brain. Third, the statistical approaches used in Experiment 1 (consistency maps and partial conjunction maps) revealed both individual variation and also measurable overlap and consistency across infants. We could therefore apply these statistical approaches, which are designed to be sensitive to inter-subject variation, to the case of observed touch.
3.1 | Methods
3.1.1 | Participants
The participants were awake and alert 7-month-old infants tested in a narrow age window (32 weeks ± 14 days old). Infants were recruited in the same way as in Experiment 1 and met the same predetermined criteria about normal birth weight, gestational age, and healthy development. A total of 41 infants began MEG testing. Of these, two were excluded for technical issues and 17 were excluded for an insufficient number of trials (< 20) in which the infant was still and attentive to the movies (see Rejection and averaging, below). This left 22 infants who contributed analyzable data (Mage = 32.3 weeks, SD = 0.7, 16 males). For these 22 participants, 16 infants had a sufficient number of accepted trials (≥ 20) for only one of the effectors (hand or foot), and six other infants had a sufficient number of accepted trials for both effectors (hand and foot). Therefore, the analysis is based on data from 14 infants in the hand condition and 14 infants in the foot condition.
3.1.2 | Stimuli
The visual stimuli were digital video recordings of an adult’s right hand or right foot being contacted by a wooden rod (10 mm diameter; Figure 1B). The videos began with a static hand or foot. A rod entered from the right or left side of the frame, made contact with the dorsal surface of the hand or foot, and was withdrawn to exit the frame. In an effort to keep infants engaged, seven different video clips were created for each condition (hand stimuli and foot stimuli). These video clips varied in whether the hand or foot was female or male, whether it was presented in a first-or third-person perspective, and the color of the rod (red, blue, yellow, white or black) that appeared from the right or left side of the frame. All videos were 2000 ms in duration with the rod contacting the hand or foot at 1100 ms.
3.1.3 | Experimental procedure
All infants were fitted with the nylon cap with embedded HPI coils following the procedures described in Experiment 1. Infants were then taken into the MSR, and appropriately situated under the MEG sensor array in the adjustable, padded infant seat. The visual stimuli were presented with a Digital Light Processor projector (model PT-DW7000U) onto a back-projection screen placed 85 cm in front of the infant. The size of the stimulus frame on the screen was 36 × 64 cm. Each infant was first shown videos of either hand or foot stimulation, and if they remained still and attentive to the videos after approximately 60 trials of one condition (hand or foot), the videos were switched to the other condition. The videos were presented in blocks of three trials. In a single block, one of the seven different hand (or foot) videos was presented three times in succession. Each block was preceded by an animation of colored patterns with accompanying sound effects to retain or attract the infant’s visual attention. The offset of this attention grabber was controlled by an experimenter who was inside the MSR and observing the infants on a monitor, which was out of sight of the child. When the infant was attending to the stimulus screen, the experimenter advanced the visual presentation to the next block of three video trials. The MEG sessions lasted approximately 10 min, depending on the number of trials completed.
3.1.4 | MEG measurements, preprocessing, rejection, and averaging
These methods were the same as Experiment 1, save for two modifications due to the use of visual stimuli. The preprocessed data were epoched (−250 to 1750 ms) relative to the onset of the video. An additional epoch rejection criterion was added. In addition to excluding trials containing infant movement, the video recordings of the infants were examined offline for infant attention to the visual stimulus; and trials were rejected if the infant looked away from the screen during the duration of the 2000 ms video. The mean number of epochs retained after rejection for the observed hand and foot touch conditions were 50.6 (SD = 21.3) and 44.6 (SD = 15.4), respectively.
3.2 | Results
Observed touch of the hand and foot resulted in ERFs that were less clearly dipolar than the fields obtained in Experiment 1, and thus we were not able to reliably fit the data using ECD modeling (see also Pihko et al., 2010, for a similar report using adult MEG participants). This is possibly due to the more spatially distributed activation patterns evoked by the visual stimulus, which included both visual and somatosensory areas. Nevertheless, with eLORETA source estimation we were able to localize the ERFs to areas thought to be involved in body perception. Statistical mapping of these source estimates, using Hotelling’s T2 tests, provided single-subject p-maps. Following the approach in Experiment 1, two types of group-level analyses were applied to the p-maps.
First, we constructed consistency maps by counting the number of infants at each voxel that exceeded a statistical threshold of p < .001 at any time point within the 400 ms time window following the contact of the rod with the hand or foot (i.e. 1100–1500 ms). As expected, the consistency maps (Figure 5) showed bilateral activation of the occipital lobe. Furthermore, they showed consistent activation in the somatosensory cortices and some degree of somatotopy: 11/14 infants in the hand touch condition and 8/14 infants in the foot touch condition surpassed threshold in hand and foot somatosensory regions, respectively.
FIGURE 5.
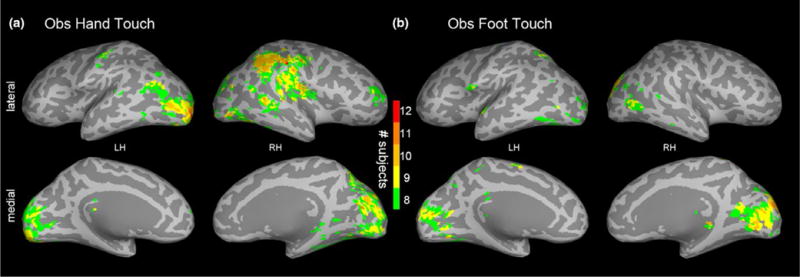
Experiment 2: (a) Observed hand touch and (b) observed foot touch subject consistency maps showing, at each voxel, the number of infants (out of 14) meeting the p < .001 threshold at any time point within the 400 ms time window following the rod touching the hand (or foot) in the video stimulus. The maps are visualized with a lower bound of eight subjects
Next, we performed spatiotemporal subject partial conjunction (st-sPC) mapping under FDR control to assess responses at each voxel and ms (SI, Figure S3). The pattern of activation was compatible with that shown in Figure 5; however, as expected, this analysis showed fewer infants with significant activation in somatosensory areas in response to observed touch than in response to felt touch in Experiment 1. Nonetheless, the results of the st-sPC mapping showed significant activation in bilateral somatosensory regions in S1 (BA3, 1, 2) and other parietal areas (S2, BA5 and 7) which overlap with similar regions activated in Experiment 1. These analyses also revealed activation in: (a) early visual areas (e.g., V1, V2, V3a); (b) areas that may correspond to the adult extrastriate body area (EBA) and fusiform body area (FBA), which are thought to be multimodal areas involved in visual body processing and haptic perception; (c) the superior temporal sulcus (STS), an area involved in action perception including its social dimensions; (d) the temporoparietal junction (TPJ), an area involved in self–other distinction; and (e) the lateral occipital complex (LOC), involved in visual object recognition, and the human middle temporal region (hMT+) involved in motion processing, probably due to the moving rod (Figure S4).
Lastly, we also examined infant brain oscillations during observed touch. We focused on the infant beta band because previous adult studies have implicated beta band oscillations in cognitive processes related to touch (Engel & Fries, 2010; van Ede, Jensen, & Maris, 2010). The source event-related spectral perturbation (ERSP) of the infant beta band (12–18 Hz) was estimated (Makeig, 1993; Pfurtscheller & Lopes da Silva, 1999). Statistical analyses of the ERSP were performed using spatiotemporal threshold-free cluster enhancement (TFCE) with family-wise error rate (FWER) correction, p < .05 (see SI Methods, Section 2.6). As shown in Figure 6, observed hand touch significantly increased beta band power relative to the pre-stimulus baseline in the hand region of S1 (BA3, 1, 2), and in S2, EBA, FBA, and other visual and parietal cortical areas. Observed foot touch significantly increased beta band power in the foot region of S1 (BA3, 1, 2) and also in the cingulate cortex.
FIGURE 6.
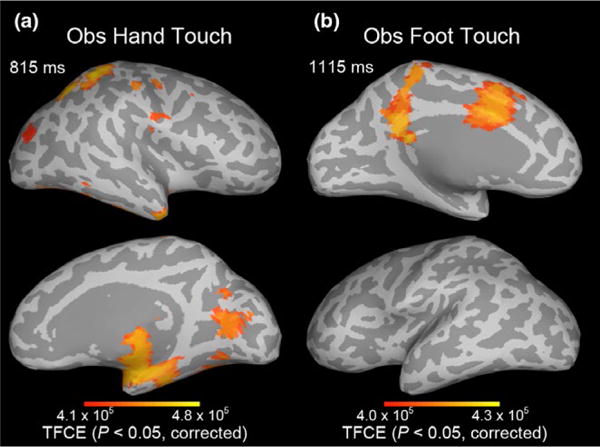
Experiment 2: Spatiotemporal threshold-free cluster enhancement (TFCE) statistical maps showing increases in infant beta band (12–18 Hz) power relative to the pre-stimulus baseline, that is, the event-related spectral perturbation (ERSP) for (a) observed hand touch and (b) observed foot touch. Maps are thresholded at the TFCE value corresponding to p < .05, after family-wise error rate (FWER) correction for multiple hypotheses. SI Movies 5 and 6 provide dynamic visualizations of these TFCE maps
4 | GENERAL DISCUSSION
The current experiments used MEG to investigate cortical responses to felt and observed touch in 7-month-old human infants. This infant work addressed two novel questions. First, what is the specific pattern of brain activation when awake infants are touched on their hands and feet? Current knowledge of infant brain responses to tactile stimulation of multiple body parts is based primarily on sensor-level EEG studies, which do not provide information about the sources of activity in the infant brain. Second, what spatiotemporal pattern of activation is present in the infant brain during the observation of another person’s body being touched, in the absence of tactile stimulation to the self? This has previously been studied in adults and older children but not in infants. Taken together, the results of the two experiments inform theorizing on the development of body representations, including the connections between the body of self and the bodies of others.
Experiment 1 showed that punctate touch to the hand and foot activates infant somatosensory cortex in a somatotopic manner. The ECD analyses localized activity approximately 19 mm more lateral in response to the touch of the infant’s hand compared to the infant’s foot; and conjunction analyses of the eLORETA source estimates mapped activity to the contralateral S1 (BA3, 1, 2) hand and foot regions, respectively. A significant contralateral S1 response was apparent in 11 of 14 infants by 90 ms (hand) and 103 ms (foot), with some infants showing responses at earlier latencies. We also observed that the spatiotemporal source patterns in somatosensory cortex exhibited waves of activity that started focally in the S1 hand or foot area, and then spread to neighboring regions, often returning to where they originated and then reactivating recurrently, with waves generally spreading further at later latencies (Figure 3). Related patterns have also been reported in animal studies utilizing voltage-sensitive dye imaging (Wester & Contreras, 2012; Wu, Huang, & Zhang, 2008).
The results of Experiment 1 serve to inform the interpretation of the results from Experiment 2, in which infants visually perceived the touch to others’ hands and feet. Consistent with the results of Experiment 1, significant activation occurred in the infant’s own somatosensory cortex in response to seeing a hand or foot being touched. The results also showed that observing hand and foot touch resulted in significant increases of beta-band power in S1 hand and foot regions, respectively (Figure 6). Previous studies with adults showed that modulation of beta-band oscillations is implicated in the processing of tactile stimuli (Engel & Fries, 2010; Gardner & Martin, 2000; Linkenkaer-Hansen, Nikulin, Palva, Ilmoniemi, & Palva, 2004; van Ede et al., 2010).1
Taken together, the results of Experiment 2 provide evidence for activation of somatosensory cortex during infants’ viewing of touch to another person’s body. Three statistical approaches support this conclusion (consistency maps, partial conjunction, and threshold-free cluster enhancement). It is noteworthy that the spatial distribution of the results obtained in response to felt touch (Figure 4) and observed touch (Figure 6) show a great deal of overlap. This suggests that some shared anatomical regions in human infants are activated whether touch of the body is tactilely or visually perceived, which is compatible with cognitive neuroscience work done with human adults (e.g., Keysers et al., 2010; Pihko et al., 2010).
It is notable that activation of somatosensory cortex for observed touch (Experiment 2) occurred in fewer infants than for felt touch (Experiment 1). A weaker somatosensory response to observed touch has also been reported in adult subjects (Pihko et al., 2010), for whom the source strength for observing someone else being touched was ten times weaker than that to felt touch. Reflecting further on the difference between felt and observed touch, there is a “labeled line” (direct pathway) (Gardner & Martin, 2000) connecting tactile stimulation of patches of skin to the thalamus and S1. Thus, felt touch is registered at a basic level, whereas observed touch is indirect and requires the infant to make perceptual-cognitive inferences related to body-part identification. In the visual modality, infants might, at least on first encounter with the movie, register a “limb-like” body part being touched rather than a clearly identified hand versus foot. The visual stimuli were two-dimensional displays of stationary body parts being touched. It would be interesting to examine whether infant responses to observed touch are enhanced and more clearly differentiated if infants: (a) are shown a live three-dimensional body being touched or (b) are shown canonical actions of the body part (e.g., a grasping act of the hand) prior to seeing it touched, as a way of assisting infants in visual identification of the specific body part.
In Experiment 2, viewing a video of another person’s body being touched resulted in activation in early visual regions, with further activity in areas thought to be involved in multisensory body and self–other processing. Specifically, observation of touch was associated with activation in areas corresponding to the EBA, FBA, STS, and TPJ. Previous infant work has used near-infrared spectroscopy to broadly examine temporal cortex responses to the biological motion of different body parts (Lloyd-Fox, Blasi, Everdell, Elwell, & Johnson, 2011), but to our knowledge, our results are the first to suggest EBA and FBA responses to seen body parts in infants. The functional properties of these regions have been studied with fMRI in older children (Peelen, Glaser, Vuilleumier, & Eliez, 2009; Ross, de Gelder, Crabbe, & Grosbras, 2014) and adults (Lingnau & Downing, 2015; Peelen & Downing, 2007; Taylor & Downing, 2011). Remaining to be tested is the degree to which these areas in the infant brain respond selectively to body parts versus similar objects, as assessed in adult subjects (Peelen & Downing, 2007).2
Behavioral studies have documented that human infants can visually identify body parts (Bhatt, Hock, White, Jubran, & Galati, 2016; Meltzoff, 1988; Meltzoff & Moore, 1997). Notably, human infants can imitate specific bodily acts they see others perform, including hand gestures (Meltzoff & Moore, 1977; Nagy, Pal, & Orvos, 2014; Piaget, 1962). In order to imitate with fidelity, infants must map the effector they see the adult use to the corresponding effector on their own body and then perform the same movement with that effector. Theoretical models of infant imitation hypothesize that “organ identification” (Meltzoff & Moore, 1997) is an early step in achieving imitation. Work with 14-month-old infants provided initial insights into the neural correlates of this process of organ identification by showing a coarse somatotopic pattern of infant EEG responses during the observation of hand and foot actions (Marshall et al., 2013; Saby et al., 2013). By using MEG to conduct fine-grained analyses of both the spatial and temporal dynamics of infant brain responses to felt and observed touch, the current work with younger infants provides new insights into the mechanisms involved in organ identification.3
The current work raises fundamental questions concerning the connections between the bodies of self and other. One possibility is that infants first learn an exclusively visual category for hands. A different possibility is that this “hand category” is multimodally specified, such that the hands of self and other share a common representation supporting the identification of “hand” across variations in size, visual perspective, texture, and even modality of input. Infants in the first half-year of life engage in intense visual examination of their own hands, termed “hand regard”. It is unknown whether this kind of visual input is necessary for the ontogenesis of selectivity in neural regions that respond to seen hands, or whether such neural selectivity predates this visual experience. Pre-existing neural selectivity could trigger infant hand regard—attracting infants’ attention to hands, which would in turn provide visual input and engender more fine-tuned selectivity.
Future work could address these developmental questions by: (a) testing younger infants in tactile and visual conditions similar to those used here, (b) exploring how neural body maps change with age and experience (e.g., before/after the onset of infant visual hand regard), and (c) examining neural representations of body parts beyond the hands and feet—especially those, such as one’s own lips, that can be seen on other people but are invisible on one’s own body.
From the viewpoint of developmental cognitive neuroscience, future work could: (a) attempt to further differentiate which particular subareas within primary somatosensory cortex (BA3, 1, and 2) are most involved in infant responses to felt and observed touch, (b) improve infant data acquisition and analysis approaches to further cope with the large inter-individual variations in infant brain responses, and (c) explore the temporal sequence and causal relations among brain regions activated when visually perceiving someone else’s body being touched (e.g., neural circuits linking early visual areas to brain regions involved in body-part recognition, self–other correspondences, and vicarious touch).
The current work also opens the possibility of testing infants longitudinally while combining infant MEG and behavioral tests. Such work might shed light on how human infants so rapidly and effortlessly develop interpersonal skills such as high-fidelity bodily imitation and the attribution of action goals and intentions to others. These capacities may build, at least in part, on infant neural representations that map equivalences between the bodies of self and other.
Supplementary Material
RESEARCH HIGHLIGHTS.
We investigated the neural representation of the body in human infants using magnetoencephalography (MEG) brain imaging with awake participants.
Seven-month-old infants had their own hand or foot touched or observed someone else’s hand or foot being touched.
Infants’ hand and foot regions were activated when their own body was touched, and also when infants visually perceived touch to someone else’s body.
Cortical representations of body parts may underlie connections between self and other, supporting infant social learning and imitation.
Acknowledgments
Supported by NSF grants SMA-1540619 (ANM) and BCS-1460889 (PJM). We thank P. Kuhl and T. Imada for helpful comments and M. Clarke, M. Reilly, and R. Brooks for assistance.
Funding information
NSF grants SMA-1540619 and BCS-1460889
Footnotes
Increases in beta-band power have been reported in other studies in which participants can predict regular outcomes of events (e.g., Engel & Fries, 2010; Kilavik, Zaepffel, Brovelli, MacKay, & Riehle, 2013). One speculative possibility is that the beta increase we observed may be attributable to infants’ predictions about the visual events. Because the rod’s touch on the hand (or foot) can be predicted at the endpoint of the seen trajectory of movement, there is an expected hand (or foot) event. A different possibility is that observed touch induces movements in the infant’s corresponding limb, which is reflected in changes in beta. Weighing against the latter view is that epochs with clearly discernible movements were rejected; however, video review and epoch rejection would not be able to completely rule out very subtle movements (or invisible motor intentions).
A comprehensive exploration would involve the presentation of static body parts, moving body parts, similarly shaped objects, and the presence/absence of the moving rod touching these entities.
Organ identification has been investigated in behavioral studies of infant imitation. For example, when an infant sees an adult touching a box with his head, infants imitate by using their own heads and not their hands (Király, Csibra, & Gergely, 2013; Meltzoff, 1988). Such body-part identification allows infants to imitate specific bodily acts with high fidelity, and not simply to emulate more general aspects of what they see others do. Imitating with the corresponding body part is relevant for learning culturally specific customs, rituals, and mannerisms—for which it is often important to imitate in the exact right way (e.g., Legare, Wen, Herrmann, & Whitehouse, 2015).
ORCID
Andrew N. Meltzoff http://orcid.org/0000-0001-8683-0547
SUPPORTING INFORMATION
Additional Supporting Information may be found online in the supporting information tab for this article.
References
- Arichi T, Moraux A, Melendez A, Doria V, Groppo M, Merchant N, Edwards AD. Somatosensory cortical activation identified by functional MRI in preterm and term infants. NeuroImage. 2010;49:2063–2071. doi: 10.1016/j.neuroimage.2009.10.038. [DOI] [PubMed] [Google Scholar]
- Benjamini Y, Heller R. Screening for partial conjunction hypotheses. Biometrics. 2008;64:1215–1222. doi: 10.1111/j.1541-0420.2007.00984.x. [DOI] [PubMed] [Google Scholar]
- Bhatt RS, Hock A, White H, Jubran R, Galati A. The development of body structure knowledge in infancy. Child Development Perspectives. 2016;10:45–52. doi: 10.1111/cdep.12162. [DOI] [PMC free article] [PubMed] [Google Scholar]
- Buonomano DV, Merzenich MM. Cortical plasticity: From synapses to maps. Annual Review of Neuroscience. 1998;21:149–186. doi: 10.1146/annurev.neuro.21.1.149. [DOI] [PubMed] [Google Scholar]
- Cuevas K, Cannon EN, Yoo K, Fox NA. The infant EEG mu rhythm: Methodological considerations and best practices. Developmental Review. 2014;34:26–43. doi: 10.1016/j.dr.2013.12.001. [DOI] [PMC free article] [PubMed] [Google Scholar]
- de Klerk CCJM, Johnson MH, Southgate V. An EEG study on the somatotopic organisation of sensorimotor cortex activation during action execution and observation in infancy. Developmental Cognitive Neuroscience. 2015;15:1–10. doi: 10.1016/j.dcn.2015.08.004. [DOI] [PMC free article] [PubMed] [Google Scholar]
- Destrieux C, Fischl B, Dale A, Halgren E. Automatic parcellation of human cortical gyri and sulci using standard anatomical nomenclature. NeuroImage. 2010;53:1–15. doi: 10.1016/j.neuroimage.2010.06.010. [DOI] [PMC free article] [PubMed] [Google Scholar]
- Elbert T, Pantev C, Wienbruch C, Rockstroh B, Taub E. Increased cortical representation of the fingers of the left hand in string players. Science. 1995;270:305–307. doi: 10.1126/science.270.5234.305. [DOI] [PubMed] [Google Scholar]
- Engel AK, Fries P. Beta-band oscillations—Signalling the status quo? Current Opinion in Neurobiology. 2010;20:156–165. doi: 10.1016/j.conb.2010.02.015. [DOI] [PubMed] [Google Scholar]
- Ernst MD. Permutation methods: A basis for exact inference. Statistical Science. 2004;19:676–685. [Google Scholar]
- Ferjan Ramírez N, Ramírez RR, Clarke M, Taulu S, Kuhl PK. Speech discrimination in 11-month-old bilingual and monolingual infants: A magnetoencephalography study. Developmental Science. 2017;20:e12427. doi: 10.1111/desc.12427. [DOI] [PubMed] [Google Scholar]
- Friston KJ, Penny WD, Glaser DE. Conjunction revisited. NeuroImage. 2005;25:661–667. doi: 10.1016/j.neuroimage.2005.01.013. [DOI] [PubMed] [Google Scholar]
- Gardner EP, Martin JH. Coding of sensory information. In: Kandel ER, Schwartz JH, Jessell TM, editors. Principles of neural science. 4th. New York: McGraw-Hill; 2000. pp. 411–429. [Google Scholar]
- Gillmeister H, Bowling N, Rigato S, Banissy MJ. Inter-individual differences in vicarious tactile perception: A view across the lifespan in typical and atypical populations. Multisensory Research. 2017;30:485–508. doi: 10.1163/22134808-00002543. [DOI] [PubMed] [Google Scholar]
- Gondo K, Tobimatsu S, Kira R, Tokunaga Y, Yamamoto T, Hara T. A magnetoencephalographic study on development of the somatosensory cortex in infants. NeuroReport. 2001;12:3227–3231. doi: 10.1097/00001756-200110290-00017. [DOI] [PubMed] [Google Scholar]
- Gramfort A, Luessi M, Larson E, Engemann DA, Strohmeier D, Brodbeck C, Hämäläinen MS. MNE software for processing MEG and EEG data. NeuroImage. 2014;86:446–460. doi: 10.1016/j.neuroimage.2013.10.027. [DOI] [PMC free article] [PubMed] [Google Scholar]
- Hahamy A, Macdonald SN, van den Heiligenberg F, Kieliba P, Emir U, Malach R, Makin TR. Representation of multiple body parts in the missing-hand territory of congenital one-handers. Current Biology. 2017;27:1350–1355. doi: 10.1016/j.cub.2017.03.053. [DOI] [PMC free article] [PubMed] [Google Scholar]
- Heller R, Golland Y, Malach R, Benjamini Y. Conjunction group analysis: An alternative to mixed/random effect analysis. NeuroImage. 2007;37:1178–1185. doi: 10.1016/j.neuroimage.2007.05.051. [DOI] [PubMed] [Google Scholar]
- Kaas JH. Plasticity of sensory and motor maps in adult mammals. Annual Review of Neuroscience. 1991;14:137–167. doi: 10.1146/annurev.ne.14.030191.001033. [DOI] [PubMed] [Google Scholar]
- Kaas JH. Topographic maps are fundamental to sensory processing. Brain Research Bulletin. 1997;44:107–112. doi: 10.1016/s0361-9230(97)00094-4. [DOI] [PubMed] [Google Scholar]
- Kaas JH, Jain N, Qi HX. The organization of the somatosensory system in primates. In: Nelson RJ, editor. The somatosensory system: Deciphering the brain’s own body image. New York: CRC; 2002. pp. 1–25. [Google Scholar]
- Keysers C, Kaas JH, Gazzola V. Somatosensation in social perception. Nature Reviews Neuroscience. 2010;11:417–428. doi: 10.1038/nrn2833. [DOI] [PubMed] [Google Scholar]
- Kilavik BE, Zaepffel M, Brovelli A, Mackay WA, Riehle A. The ups and downs of beta oscillations in sensorimotor cortex. Experimental Neurology. 2013;245:15–26. doi: 10.1016/j.expneurol.2012.09.014. [DOI] [PubMed] [Google Scholar]
- Király I, Csibra G, Gergely G. Beyond rational imitation: Learning arbitrary means actions from communicative demonstrations. Journal of Experimental Child Psychology. 2013;116:471–486. doi: 10.1016/j.jecp.2012.12.003. [DOI] [PMC free article] [PubMed] [Google Scholar]
- Kuhl PK, Ramírez RR, Bosseler A, Lin JFL, Imada T. Infants’ brain responses to speech suggest analysis by synthesis. Proceedings of the National Academy of Sciences, USA. 2014;111:11238–11245. doi: 10.1073/pnas.1410963111. [DOI] [PMC free article] [PubMed] [Google Scholar]
- Lankinen K, Smeds E, Tikka P, Pihko E, Hari R, Koskinen M. Haptic contents of a movie dynamically engage the spectator’s sensorimotor cortex. Human Brain Mapping. 2016;37:4061–4068. doi: 10.1002/hbm.23295. [DOI] [PMC free article] [PubMed] [Google Scholar]
- Legare CH, Wen NJ, Herrmann PA, Whitehouse H. Imitative flexibility and the development of cultural learning. Cognition. 2015;142:351–361. doi: 10.1016/j.cognition.2015.05.020. [DOI] [PubMed] [Google Scholar]
- Lingnau A, Downing PE. The lateral occipitotemporal cortex in action. Trends in Cognitive Sciences. 2015;19:268–277. doi: 10.1016/j.tics.2015.03.006. [DOI] [PubMed] [Google Scholar]
- Linkenkaer-Hansen K, Nikulin VV, Palva S, Ilmoniemi RJ, Palva JM. Prestimulus oscillations enhance psychophysical performance in humans. Journal of Neuroscience. 2004;24:10186–10190. doi: 10.1523/JNEUROSCI.2584-04.2004. [DOI] [PMC free article] [PubMed] [Google Scholar]
- Lloyd-Fox S, Blasi A, Everdell N, Elwell CE, Johnson MH. Selective cortical mapping of biological motion processing in young infants. Journal of Cognitive Neuroscience. 2011;23:2521–2532. doi: 10.1162/jocn.2010.21598. [DOI] [PubMed] [Google Scholar]
- Makeig S. Auditory event-related dynamics of the EEG spectrum and effects of exposure to tones. Electroencephalography and Clinical Neurophysiology. 1993;86:283–293. doi: 10.1016/0013-4694(93)90110-h. [DOI] [PubMed] [Google Scholar]
- Maris E. Statistical testing in electrophysiological studies. Psychophysiology. 2012;49:549–565. doi: 10.1111/j.1469-8986.2011.01320.x. [DOI] [PubMed] [Google Scholar]
- Marshall PJ, Meltzoff AN. Neural mirroring mechanisms and imitation in human infants. Philosophical Transactions of the Royal Society B: Biological Sciences. 2014;369:20130620. doi: 10.1098/rstb.2013.0620. [DOI] [PMC free article] [PubMed] [Google Scholar]
- Marshall PJ, Meltzoff AN. Body maps in the infant brain. Trends in Cognitive Sciences. 2015;19:499–505. doi: 10.1016/j.tics.2015.06.012. [DOI] [PMC free article] [PubMed] [Google Scholar]
- Marshall PJ, Saby JN, Meltzoff AN. Imitation and the developing social brain: Infants’ somatotopic EEG patterns for acts of self and other. International Journal of Psychological Research. 2013;6:22–29. doi: 10.21500/20112084.714. [DOI] [PMC free article] [PubMed] [Google Scholar]
- Medvedovsky M, Taulu S, Bikmullina R, Paetau R. Artifact and head movement compensation in MEG. Neurology, Neurophysiology and Neuroscience. 2007;4 [PubMed] [Google Scholar]
- Meltzoff AN. Infant imitation after a 1-week delay: Long-term memory for novel acts and multiple stimuli. Developmental Psychology. 1988;24:470–476. doi: 10.1037/0012-1649.24.4.470. [DOI] [PMC free article] [PubMed] [Google Scholar]
- Meltzoff AN. Origins of social cognition: Bidirectional self-other mapping and the “Like-Me” hypothesis. In: Banaji MR, Gelman SA, editors. Navigating the social world: What infants, children, and other species can teach us. New York: Oxford University Press; 2013. pp. 139–144. [Google Scholar]
- Meltzoff AN, Moore MK. Imitation of facial and manual gestures by human neonates. Science. 1977;198:75–78. doi: 10.1126/science.198.4312.75. [DOI] [PubMed] [Google Scholar]
- Meltzoff AN, Moore MK. Explaining facial imitation: A theoretical model. Early Development and Parenting. 1997;6:179–192. doi: 10.1002/(SICI)1099-0917(199709/12)6:3/4<179::AID-EDP157>3.0.CO;2-R. [DOI] [PMC free article] [PubMed] [Google Scholar]
- Milh M, Kaminska A, Huon C, Lapillonne A, Ben-Ari Y, Khazipov R. Rapid cortical oscillations and early motor activity in premature human neonate. Cerebral Cortex. 2007;17:1582–1594. doi: 10.1093/cercor/bhl069. [DOI] [PubMed] [Google Scholar]
- Nagy E, Pal A, Orvos H. Learning to imitate individual finger movements by the human neonate. Developmental Science. 2014;17:841–857. doi: 10.1111/desc.12163. [DOI] [PubMed] [Google Scholar]
- Nevalainen P, Lauronen L, Pihko E. Development of human somatosensory cortical functions—what have we learned from magnetoencephalography: A review. Frontiers in Human Neuroscience. 2014;8:158. doi: 10.3389/fnhum.2014.00158. [DOI] [PMC free article] [PubMed] [Google Scholar]
- Nichols T, Brett M, Andersson J, Wager T, Poline JB. Valid conjunction inference with the minimum statistic. NeuroImage. 2005;25:653–660. doi: 10.1016/j.neuroimage.2004.12.005. [DOI] [PubMed] [Google Scholar]
- Pascual-Marqui RD. Discrete, 3D distributed, linear imaging methods of electric neuronal activity. Part 1: Exact, zero error localization. arXiv:0710.3341 2007 [Google Scholar]
- Peelen MV, Downing PE. The neural basis of visual body perception. Nature Reviews Neuroscience. 2007;8:636–648. doi: 10.1038/nrn2195. [DOI] [PubMed] [Google Scholar]
- Peelen MV, Glaser B, Vuilleumier P, Eliez S. Differential development of selectivity for faces and bodies in the fusiform gyrus. Developmental Science. 2009;12:F16–F25. doi: 10.1111/j.1467-7687.2009.00916.x. [DOI] [PubMed] [Google Scholar]
- Pfurtscheller G, Lopes da Silva FH. Event-related EEG/MEG synchronization and desynchronization: Basic principles. Clinical Neurophysiology. 1999;110:1842–1857. doi: 10.1016/s1388-2457(99)00141-8. [DOI] [PubMed] [Google Scholar]
- Piaget J. In: Play, dreams and imitation in childhood. Gattegno C, Hodgson FM, translators. New York: Norton; 1962. [Google Scholar]
- Pihko E, Lauronen L, Wikström H, Taulu S, Nurminen J, Kivitie-Kallio S, Okada Y. Somatosensory evoked potentials and magnetic fields elicited by tactile stimulation of the hand during active and quiet sleep in newborns. Clinical Neurophysiology. 2004;115:448–455. doi: 10.1016/s1388-2457(03)00349-3. [DOI] [PubMed] [Google Scholar]
- Pihko E, Nangini C, Jousmäki V, Hari R. Observing touch activates human primary somatosensory cortex. European Journal of Neuroscience. 2010;31:1836–1843. doi: 10.1111/j.1460-9568.2010.07192.x. [DOI] [PubMed] [Google Scholar]
- Pihko E, Nevalainen P, Stephen J, Okada Y, Lauronen L. Maturation of somatosensory cortical processing from birth to adulthood revealed by magnetoencephalography. Clinical Neurophysiology. 2009;120:1552–1561. doi: 10.1016/j.clinph.2009.05.028. [DOI] [PubMed] [Google Scholar]
- Remijn GB, Kikuchi M, Shitamichi K, Ueno S, Yoshimura Y, Nagao K, Minabe Y. Somatosensory evoked field in response to visuotactile stimulation in 3-to 4-year-old children. Frontiers in Human Neuroscience. 2014;8:170. doi: 10.3389/fnhum.2014.00170. [DOI] [PMC free article] [PubMed] [Google Scholar]
- Rigato S, Banissy MJ, Romanska A, Thomas R, van Velzen J, Bremner AJ. Cortical signatures of vicarious tactile experience in four-month-old infants. Developmental Cognitive Neuroscience. 2017 doi: 10.1016/j.dcn.2017.09.003. [DOI] [PMC free article] [PubMed]
- Rigato S, Begum Ali J, van Velzen J, Bremner AJ. The neural basis of somatosensory remapping develops in human infancy. Current Biology. 2014;24:1222–1226. doi: 10.1016/j.cub.2014.04.004. [DOI] [PubMed] [Google Scholar]
- Riquelme I, Montoya P. Developmental changes in somatosensory processing in cerebral palsy and healthy individuals. Clinical Neurophysiology. 2010;121:1314–1320. doi: 10.1016/j.clinph.2010.03.010. [DOI] [PubMed] [Google Scholar]
- Rochat P. Others in mind: Social origins of self-consciousness. New York: Cambridge University Press; 2009. [Google Scholar]
- Ross PD, de Gelder B, Crabbe F, Grosbras MH. Body-selective areas in the visual cortex are less active in children than in adults. Frontiers in Human Neuroscience. 2014;8:941. doi: 10.3389/fnhum.2014.00941. [DOI] [PMC free article] [PubMed] [Google Scholar]
- Rushton DN, Rothwell JC, Craggs MD. Gating of somatosensory evoked potentials during different kinds of movement in man. Brain. 1981;104:465–491. doi: 10.1093/brain/104.3.465. [DOI] [PubMed] [Google Scholar]
- Saby JN, Meltzoff AN, Marshall PJ. Infants’ somatotopic neural responses to seeing human actions: I’ve got you under my skin. PLoS ONE. 2013;8:e77905. doi: 10.1371/journal.pone.0077905. [DOI] [PMC free article] [PubMed] [Google Scholar]
- Saby JN, Meltzoff AN, Marshall PJ. Neural body maps in human infants: Somatotopic responses to tactile stimulation in 7-month-olds. NeuroImage. 2015;118:74–78. doi: 10.1016/j.neuroimage.2015.05.097. [DOI] [PubMed] [Google Scholar]
- Saby JN, Meltzoff AN, Marshall PJ. Beyond the N1: A review of late somatosensory evoked responses in human infants. International Journal of Psychophysiology. 2016;110:146–152. doi: 10.1016/j.ijpsycho.2016.08.008. [DOI] [PMC free article] [PubMed] [Google Scholar]
- Taulu S, Hari R. Removal of magnetoencephalographic artifacts with temporal signal-space separation: Demonstration with single-trial auditory-evoked responses. Human Brain Mapping. 2009;30:1524–1534. doi: 10.1002/hbm.20627. [DOI] [PMC free article] [PubMed] [Google Scholar]
- Taulu S, Simola J. Spatiotemporal signal space separation method for rejecting nearby interference in MEG measurements. Physics in Medicine and Biology. 2006;51:1759–1768. doi: 10.1088/0031-9155/51/7/008. [DOI] [PubMed] [Google Scholar]
- Taulu S, Simola J, Kajola M. Applications of the signal space separation method. IEEE Transactions on Signal Processing. 2005;53:3359–3372. [Google Scholar]
- Taylor JC, Downing PE. Division of labor between lateral and ventral extrastriate representations of faces, bodies, and objects. Journal of Cognitive Neuroscience. 2011;23:4122–4137. doi: 10.1162/jocn_a_00091. [DOI] [PubMed] [Google Scholar]
- Tomasello M. The cultural origins of human cognition. Cambridge, MA: Harvard University Press; 1999. [Google Scholar]
- Ulmer S. Neuroanatomy and cortical landmarks. In: Ulmer S, Jansen O, editors. fMRI: Basics and clinical applications. Berlin: Springer-Verlag; 2013. pp. 7–16. [Google Scholar]
- Uusitalo MA, Ilmoniemi RJ. Signal-space projection method for separating MEG or EEG into components. Medical & Biological Engineering & Computing. 1997;35:135–140. doi: 10.1007/BF02534144. [DOI] [PubMed] [Google Scholar]
- van Ede F, Jensen O, Maris E. Tactile expectation modulates pre-stimulus β-band oscillations in human sensorimotor cortex. NeuroImage. 2010;51:867–876. doi: 10.1016/j.neuroimage.2010.02.053. [DOI] [PubMed] [Google Scholar]
- Wehner DT, Hämäläinen MS, Mody M, Ahlfors SP. Head movements of children in MEG: Quantification, effects on source estimation, and compensation. NeuroImage. 2008;40:541–550. doi: 10.1016/j.neuroimage.2007.12.026. [DOI] [PMC free article] [PubMed] [Google Scholar]
- Wester JC, Contreras D. Columnar interactions determine horizontal propagation of recurrent network activity in neocortex. Journal of Neuroscience. 2012;32:5454–5471. doi: 10.1523/JNEUROSCI.5006-11.2012. [DOI] [PMC free article] [PubMed] [Google Scholar]
- Williams G, Fabrizi L, Meek J, Jackson D, Tracey I, Robertson N, Fitzgerald M. Functional magnetic resonance imaging can be used to explore tactile and nociceptive processing in the infant brain. Acta Paediatrica. 2015;104:158–166. doi: 10.1111/apa.12848. [DOI] [PMC free article] [PubMed] [Google Scholar]
- Wittenberg P, Krugman H, Russel A, Klassmann A, Sloetjes H. Proceedings of the 5th international conference on language resources and evaluation (LREC 2006) Genoa: 2006. ELAN: A professional framework for multimodality research; pp. 1556–1559. [Google Scholar]
- Wu JY, Huang X, Zhang C. Propagating waves of activity in the neocortex: What they are, what they do. Neuroscientist. 2008;14:487–502. doi: 10.1177/1073858408317066. [DOI] [PMC free article] [PubMed] [Google Scholar]
- Zhao TC, Kuhl PK. Musical intervention enhances infants’ neural processing of temporal structure in music and speech. Proceedings of the National Academy of Sciences, USA. 2016;113:5212–5217. doi: 10.1073/pnas.1603984113. [DOI] [PMC free article] [PubMed] [Google Scholar]
Associated Data
This section collects any data citations, data availability statements, or supplementary materials included in this article.