

Abstract
Research using the Stop Signal Task employing an adaptive algorithm to accommodate individual differences often report inferior performance on the task in individuals with ADHD, OCD, and substance use disorders compared to non‐clinical controls. Furthermore, individuals with deficits in inhibitory control tend to show reduced neural activity in key inhibitory regions during successful stopping. However, the adaptive algorithm systematically introduces performance‐related differences in objective task difficulty that may influence the estimation of individual differences in stop‐related neural activity. This report examines the effect that these algorithm‐related differences have on the measurement of neural activity during the stop signal task. We compared two groups of subjects (n = 210) who differed in inhibitory ability using both a standard fMRI analysis and an analysis that resampled trials to remove the objective task difficulty confound. The results show that objective task difficulty influences the magnitude of between‐group differences and that controlling for difficulty attenuates stop‐related activity differences between superior and poor inhibitors. Specifically, group differences in the right inferior frontal gyrus, right middle occipital gyrus, and left inferior frontal gyrus are diminished when differences in objective task difficulty are controlled for. Also, when objective task difficulty effects are exaggerated, group differences in stop related activity emerge in other regions of the stopping network. The implications of these effects for how we interpret individual differences in activity levels are discussed.
Keywords: objective task difficulty, response inhibition, stop signal delay
1. INTRODUCTION
The ability to inhibit unwarranted behaviors and thoughts is considered a major component of executive functioning (Barkley, 1997). Inhibitory control is thought to be the central deficit in attention deficit hyperactivity disorder (ADHD; Casey et al. 1997; Quay 1997; Slaats‐Willemse, Swaab‐Barneveld, de Sonneville, van der Meulen, & Buitelaar, 2003), and is also impaired in substance use disorders (Nigg et al., 2006; Whelan et al., 2012) and obsessive compulsive disorder (OCD; Penades et al., 2007). In the laboratory, tasks examining aspects of motor response inhibition have been used to assess inhibitory control and identify impairments in this domain, and therefore it is critical that such tasks accurately describe inter‐individual differences so that pathologies associated with impairments can be characterized appropriately.
The Stop Signal Task (SST; Logan & Cowan, 1984) has, to a large extent, been a hallmark assessment for inhibitory control in neuroimaging and neurophysiological research. The SST is composed of go and stop trials. On go trials, the participant must respond rapidly via a button press to a “go signal.” However, on a minority of trials (stop trials; typically 20%–25% of trials), the go signal will be followed by a “stop signal,” indicating that the individual should attempt to countermand the already initiated response. On stop trials, the interval between the onset of the go signal and the onset of the stop signal is known as the stop signal delay (SSD), and this delay will determine the difficulty of successful inhibition. If the SSD is short (i.e., the stop signal appears very soon after the go signal is presented) it is easier to inhibit the motor response, and if the SSD is long it is more difficult to inhibit the motor response (Logan, 1994).
Often the SST employs an adaptive algorithm tracking procedure in which a participant's performance dictates the SSD of the subsequent stop trial to reach an SSD that elicits 50% stopping accuracy. In the tracking procedure, successful stopping results in a longer SSD in the following stop trial, which reduces the probability of successful inhibition, and unsuccessful stopping results in a shorter SSD in the following stop trial, which increases the probability of successful inhibition. By equating accuracy on stop trials across all participants at ∼50%, it is possible to quantitatively compare inhibitory abilities across participants. The tracking procedure allows for simple calculation of the Stop Signal Reaction Time (SSRT), or the time required to inhibit an already initiated motor response (Logan, Schachar, & Tannock, 1997). The SSRT is an indirect measure of inhibitory ability and commonly used as the main outcome variable of the SST.
Numerous neuroimaging and neurophysiological studies have used the tracking SST to compare stop‐related neural activity between groups of participants. The literature suggests that more impulsive responders (those with a longer SSRT) show decreased neural activity in key response inhibition regions of the brain. First, there is a sizeable behavioral literature suggesting individuals with ADHD perform poorly on the SST (for reviews, see Alderson, Rapport, & Kofler, 2007; Lijffijt, Kenemans, Verbaten, & van Engeland, 2005; Oosterlaan, Logan, & Sergeant, 1998). Supplementing the behavioral studies on the SST and ADHD, fMRI studies have also found that individuals with ADHD performed worse compared to controls, as noted by longer SSRT, and this poor performance was associated with reduced activity in the right mesial frontal cortex, right inferior prefrontal cortex, and left caudate (Rubia et al., 1999; Rubia, Smith, Brammer, Toone, & Taylor, 2005) as well as the right pre‐supplementary motor area, right dorsolateral prefrontal cortex, and right basal ganglia structures (Dickstein, Bannon, Xavier Castellanos, & Milham, 2006; Hart et al., 2014; Passarotti, Sweeney, & Pavuluri, 2010) during successful inhibition. Event‐related potential (ERP) studies have yielded similar results, finding decreased right frontal N2 and P3 amplitudes during successful stopping in individuals with ADHD during the SST (Liotti, Pliszka, Perez, Kothmann, & Woldorff, 2005; Pliszka, Liotti, & Woldorff, 2000; Senderecka, Grabowska, Szewczyk, Gerc, & Chmylak, 2012). Furthermore, this prefrontal and basal ganglia hypoactivity observed in individuals with ADHD is attributed to response inhibition deficits in ADHD, rather than attentional deficits (Cubillo et al., 2009; Dickstein et al., 2006; Hart, Radua, Nakao, Mataix‐Cols, & Rubia, 2013, Morien‐Zamir et al., 2014). These results indicate that a key feature of ADHD is poor performance on the SST, and, importantly, this is related to decreased activation of regions associated with response inhibition.
In research examining healthy participants, normal variation in SST performance has also been associated with different levels of neural activity. Multiple studies have reported significant negative correlations between SSRT and stop‐related activity in key inhibitory control regions (Chikazoe et al., 2009; Chao, Luo, Chang, & Li, 2009; Congdon et al., 2010; Duann, Ide, Luo, & Li, 2009; Li, Huang, Constable, & Sinha, 2006; Li, Yan, Sinha, & Lee, 2008; Whelan et al., 2012), suggesting that increased inhibitory ability is associated with increased neural activity, consistent with the clinical findings above. Aron and Poldrack (2006) found that stop‐related activity in the right inferior frontal cortex correlated negatively with SSRT and, using a median split of SSRT to create two groups of participants, found increased activity in the right inferior frontal cortex in the faster SSRT group. These findings suggest that superior response inhibition performance, and therein superior inhibitory control, is associated with increased neural activity in regions associated with this executive function.
Despite the extensive literature demonstrating individual differences using the adaptive SST, there may be concerns with its suitability for determining inter‐individual, and to some degree intra‐individual, differences in neural activity. Although the tracking procedure is designed to elicit equal subjective task difficulty across participants (meaning all participants inhibit at ∼50% of stop trials), this results in unequal objective task difficulty across participants (meaning different participants reach 50% stopping accuracy at a range of SSDs). That is, individuals who differ on inhibitory abilities will ultimately complete different versions of the SST. When an individual with relatively superior inhibitory abilities completes the task, he/she will be able to successfully inhibit at longer, more difficult SSDs, and, subsequently, the adaptive algorithm will increase the SSDs to ensure 50% inhibition rate for that individual. In contrast, a relatively poor inhibitor will complete shorter, easier SSDs to ensure their 50% accuracy. This is potentially problematic, especially considering that as SSD increases, activation increases in various inhibitory regions. Aron and Poldrack (2006) found that SSD was positively correlated with activity in the right subthalamic nucleus, the right pre‐supplementary motor area, and the right globus pallidus. Therefore, the increased activity observed in superior inhibitors may be due to the higher demands of a more objectively difficult version of the SST rather than reflecting an inherent characteristic of the activation levels of superior inhibitors.
Given the results from previous neuroimaging and neurophysiological work on the SST, it is difficult to discern if neural activation differences observed between superior inhibitors and poor inhibitors reflect differences in inherent inhibitory abilities, or reflect differences in objective task difficulty. This is of potential concern when considering the literature suggesting that a major deficit of ADHD is poor response inhibition coupled with hypo‐activation and considering the multiple reports finding SSRT scores correlate negatively with neural activity. The goal of the current study is to examine if group differences in stop‐related activity are influenced by differences in objective task demands (i.e., the stop signal delay duration of successfully inhibited stop trials). To accomplish this, we compared two groups of individuals that were selected based on differences in SSRT scores while performing the SST during fMRI acquisition. We compared regional activity from the two groups in which subjective difficulty was equivalent (both groups perform at a similar successful inhibition rate) and in which objective difficulty was equivalent (both groups successfully inhibit an identical set of trials). We hypothesized that group differences in regional activity observed in the subjectively equal condition would be attenuated when groups were compared during the objectively equal condition.
2. METHODS
2.1. Participants
Neuroimaging data used in the current study were collected as part of the large, longitudinal neuroimaging study, IMAGEN (https://imagen-europe.com). A description of participant recruiting procedures, assessment and data collection, and inclusion criteria has been previously described in Schumann et al (2010). In the current study, we examined data from 210 participants collected during the second neuroimaging time point (mean age = 18.96, SD = 0.72).
2.2. The stop signal task
All participants completed the IMAGEN version of the Stop Signal Task (SST) during functional MRI acquisition. Standardized hardware for visual stimulus presentation was used at all scanning locations (NordicNeurolabs, http://www.nordicneurolab.com). On go trials, arrows pointing to the left required a left‐hand button response, and arrows pointing to the right required a right‐hand button response. 60 stop trials were pseudorandomly mixed with 300 go trials. Stop trials consisted of an arrow pointing up (stop signal) that quickly followed the go signal. Difficulty of stopping was manipulated by varying the length of the stop signal delay (SSD) on each stop trial using a tracking algorithm based on participants’ performance (Logan et al. 1997). The goal of the tracking algorithm is to arrive at a 50% accuracy on stop trials for all participants. The initial stop trial SSD was 150 ms, and varied by 50 ms based on performance on the previous trial (increasing to make the next stop trial more difficult if the participant successfully inhibited on the previous stop trial and decreasing to make the next stop trial easier if the participant failed to successfully inhibit on the previous stop trial). The main performance measure of the SST, the Stop Signal Reaction Time (SSRT), was computed as described previously (Whelan et al., 2012). SSRT was computed by subtracting the median SSD of all successful stop trials from the nth percentile go reaction time, where n represents the percentage of successful inhibitions.
2.3. Superior and poor inhibitors
The goal of the present study was to examine how the tracking algorithm influences inter‐individual differences in stop‐related activity, and therefore two groups of subjects were chosen that would best exhibit group differences. The two groups of participants, superior and poor inhibitors, were defined based on SSRT performance values derived from the SST. 725 participants who had stop task neuroimaging data that passed quality control for excessive motion (i.e., mean framewise displacement <0.9 mm as indicated by Siegel et al., 2014) were ranked based on their SSRT. Superior inhibitors were the top 20% of participants with the fastest SSRT values (mean SSRT = 137 ms) and the poor inhibitors were the bottom 20% of participants with the slowest SSRT values (mean SSRT = 250 ms), resulting in 125 participants in each group. Further task performance quality control was performed (in accordance with Congdon et al., 2012; i.e., >50 ms SSRT, percent successful inhibition between 25% and 75%, less than 10% errors on go trials, and fewer than 10 stop trials in which the participant responded before the onset of the go signal). Finally, after dropping participants from the analysis to ensure equal sample sizes in the two groups, the final sample size contained 210 participants with 105 in each group.
2.4. AllSSD, CommonSSD, and UncommonSSD
To examine the effects of objective task difficulty on inter‐individual differences in stop‐related activity, we compared superior and poor inhibitors on three different subtypes of trials. In the first analysis, the AllSSD condition, activation maps for each participant were generated using all successful stop trials, as is standard in the neuroimaging literature. Here, the two groups are participating at equal subjective task difficulty (all participants inhibiting on approximately 50% of stop trials), however the two groups were compared on a task that was objectively more difficult for the superior inhibitors (the superior inhibitors successfully inhibited on trials with longer SSDs; see Figure 1).
Figure 1.
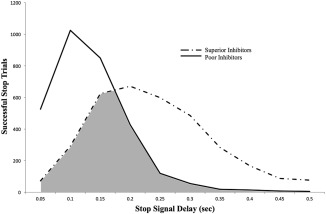
Distribution of stop success trials completed by the superior inhibitors (dotted line) and the poor inhibitors (solid line). For each SSD, the total number of successful stop trials completed at that given SSD length is plotted for each group. Notably, the superior inhibitors’ distribution is shifted towards longer SSDs, and the poor inhibitors’ distribution is shifted towards shorter SSDs. The shaded region represents the distribution of trials that were inhibited by both superior and poor inhibitors, and thus formed the subset of trials for the CommonSSD analysis. The non‐shaded regions represent the trials that were uniquely inhibited by only one group, and thus formed the subsets of trials for the UncommonSSD analysis
The goal of the second analysis, the CommonSSD condition, was to examine group differences on a subset of trials that were equal in objective task difficulty (shaded region, Figure 1). The CommonSSD condition contained an equal number of trials at each SSD for the two groups (Table 1). To accomplish this, we randomly selected successful stop trials from each group so that both groups had the same number of successful stop trials at each SSD. Additionally, we matched the number of participants from each group that contributed to the analyses at each SSD (see Table 1). For example, at 250 ms SSD, there were 45 poor inhibitors that successfully inhibited on 120 stop trials in total and there were 101 superior inhibitors that successfully inhibited on 599 stop trials in total. To match these groups, we randomly selected 45 of the 101 superior inhibitors, and from the 45 selected participants, we randomly chose 120 successful stop trials. This procedure was conducted for SSDs of 50–500 ms. The trials that were not selected for the CommonSSD condition comprised the UncommonSSD condition (unshaded region, Figure 1); these trials maximize the SSD confound between the superior and poor participants. Therefore, the model for this analysis was identical to that of the AllSSD condition, except here all successful stop trials were assigned to either the CommonSSD or UncommonSSD trial types.
Table 1.
Distribution of successful stop trials from the superior and poor inhibitors in the CommonSSD and AllSSD analyses
| Superior | Poor | |||
|---|---|---|---|---|
| SSD (ms) | Trials | Participants | Trials | Participants |
| 50 | 72 | 35 | 526 | 90 |
| 100 | 292 | 83 | 1025 | 103 |
| 150 | 624 | 105 | 850 | 105 |
| 200 | 671 | 105 | 428 | 88 |
| 250 | 599 | 101 | 120 | 45 |
| 300 | 486 | 91 | 55 | 19 |
| 350 | 283 | 67 | 18 | 6 |
| 400 | 167 | 47 | 14 | 4 |
| 450 | 87 | 31 | 8 | 2 |
| 500 | 77 | 19 | 5 | 2 |
Number of successful stop trials at each SSD. The SSD is listed in milliseconds on the left panel of the table. For each SSD, the total number of successful stop trials for each group is listed from the AllSSD condition (Trials), along with the total number of participants that successfully inhibited at that delay (Participants). The italic bolded numbers represent the CommonSSD distribution of participants and trials that were taken from both groups for this analysis.
2.5. AllSSD‐subsample
The CommonSSD condition contains approximately half the number of trials used to generate activation contrasts in the AllSSD condition (48% of successful stop trials for the superior inhibitors and 53% of successful stop trials for the poor inhibitors; see Table 1). To control for the potential influence this loss of power may have when comparing results from the AllSSD to the CommonSSD condition, we created a third condition. The AllSSD‐subsample condition is composed of 50% of trials randomly selected from the AllSSD condition of each participant. In this manner, the AllSSD‐subsample condition preserves the same group differences in the distribution of SSD length on successful stop trials as in the AllSSD condition, while also containing a similar number of trials used to generate activation contrasts as in the CommonSSD condition.
2.6. fMRI acquisition and analysis
Full a full description of the MRI acquisition, quality control procedures, and multi‐site standardization please refer to Schumann et al. (2010). MRI Acquisition Scanning was performed at the eight IMAGEN assessment sites (London, Nottingham, Dublin, Mannheim, Dresden, Berlin, Hamburg, and Paris) with 3T whole body MRI systems made by four manufacturers (Siemens: 4 sites, Philips: 2 sites, General Electric: 1 site, and Bruker: 1 site). Image acquisition parameters were held constant across all sites to ensure comparison of fMRI data across the different image acquisition facilities. For structural images, high‐resolution anatomical MRIs were acquired with three‐dimensional T1 weighted magnetization prepared gradient echo sequence (MPRAGE), with 2300 ms TR and slice thickness of 1.1 mm. For functional images, blood oxygenation level dependent (BOLD) fMRI images were acquired with a gradient‐echo echoplanar image sequence using a relatively short echo‐time, with 2200 ms TR and slice thickness of 2.4 mm.
Functional image processing included realignment, slice‐timing correction, movement correction, non‐linear warping into MNI space using a custom EPI template, and Gaussian‐smoothing at 5 mm full width half maximum. Statistical Parametric Mapping (SPM) version 12 was used for generation of all first level analysis contrast images. Activation maps were computed using a general linear model with an auto‐regressive noise model. Based on behavioral records, each participant's design matrix included regressors for the different trials in the task and six motion regressors (3 for translational and 3 for rotational movement) included as nuisance variables. Regressors modeling the experimental conditions are convolved using SPM's default hemodynamic response function. Task condition regressors include stop success trials (more details below), stop failure trials, trials on which the go response was too late and trials on which the go response was wrong (if any). Contrast images are generated for successful (stop success) responses against the implicit baseline of the go success condition while removing variance associated with the other regressors in the design matrix, as this has been the model used previously on the IMAGEN dataset (Whelan et al., 2012). For all contrast images, intensity in each voxel represents the estimated percent BOLD signal change associated with the regressor.
Three different design matrices were used in the current study to create activation contrasts for successful stop trials. The three design matrices were identical except for how successful stop trials were modeled. For the AllSSD condition, all successful stop trials were included in the “stop success” regressor, generating a contrast image for all available successful stop trials. For the CommonSSD and UncommonSSD condition, the “stop success” regressor was split into two distinct regressors according to the duration of the SSD as described above, generating contrast images for the CommonSSD trials and for the UncommonSSD trials, separately. For the AllSSD‐subsample analysis, all successful stop trials were randomly separated to one of two regressors ensuring that the AllSSD‐subsample regressor contained a similar number of trials as were represented in the CommonSSD regressor.
2.7. Regions of interest generation
Functionally‐defined regions of interest (ROI) were created to compare percent signal change associated with successful stop trials between superior and poor inhibitors. To define the ROIs, contrast images were first generated for stop success activity from all successful stop trials from all 210 participants. Regions were then selected by the ten peaks exhibiting the greatest activity for the stop success contrast, and spheres with a radius of 5 mm were centered on the ten local maxima. All ten regions were gray matter masked to remove white matter and CSF from the sphere. Marsbar ROI toolbox for SPM was used to extract the average percent signal change for voxels within each of the ten ROIs (http://marsbar.sourceforge.net). Figure 2 depicts each ROI along with the MNI coordinates and Brodmann area that each ROI lies within. Regions are labeled with a short naming schema used for future descriptions in text, however Figure 2 caption includes more anatomical specificity for each ROI. To verify that the locations of these ten regions were not driven by the activation from the superior or poor inhibitors, we calculated the peaks of activation separately for each group. Importantly, the distance from each groups’ activation peaks and the regions used here was equal, suggesting the results are not biased towards activation of either group.
Figure 2.
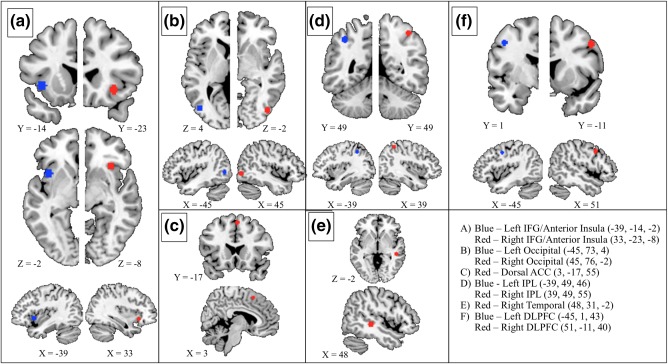
Ten functionally‐defined ROIs that were used in the current study for ROI‐based analyses, along with their MNI coordinates. All regions within the left hemisphere are marked in blue and all regions within the right hemisphere are marked in red. If applicable (a, b, d, and f), regions are displayed with their contralateral counterpart. In a, b, d, and f, the right and left hemisphere slices do not align, and the slice number is provided to clarify the spatial discrepancies. The legend provided includes the MNI coordinates (R, A, I) with the abbreviated names that are used throughout the text of this study. The following represents a more anatomically detailed description of the regions including dominant Brodmann areas (BA): (a) Blue: anterior aspect of the left insula extending into the left inferior frontal gyrus (BA 13/47). Red: anterior aspect of the right insula extending into the right inferior frontal gyrus (BA 13/47). (b) Blue: anterior aspect of the left middle occipital gyrus (BA 19). Red: anterior aspect of the right middle occipital gyrus (BA 19). (c) dorsal anterior cingulate gyrus, including bilateral medial superior frontal gyrus (BA 6). (d) Blue: left inferior parietal lobule extending into the superior parietal lobule (BA 40). Red: right inferior parietal lobule extending into the superior parietal lobule (BA 40). (e) posterior aspect of the right middle temporal gyrus (BA = 21). (f) Blue: posterior aspect of the left middle and superior frontal gyrus (BA 9). Red: posterior aspect of the right middle and superior frontal gyrus (BA 9) [Color figure can be viewed at http://wileyonlinelibrary.com]
2.8. Post hoc separation of IFG and insula
Although the focus of the current study is to examine the effects of objective task difficulty on stop‐related activity, the right IFG/anterior insula and the left IFG/anterior insula include voxels from two anatomically distinct regions. This is potentially problematic considering the inferior frontal gyrus and the anterior insula exhibit unique architectonic characteristics and may be involved in functionally separable networks (Aron, Robbins, & Poldrack, 2004; Menon & Uddin, 2010). To address this concern, a post hoc analyses was performed to address the effects of objective task difficulty on stop‐related activity specifically in the right and left inferior frontal gyri and the right and left anterior insula. Four new functionally‐defined regions of interest were generated (see Figure 3). Similar to the ten regions used in the main analyses of the current study, the four new regions were defined by the stop success activity from all successful stop trials in the 210 participants. Here, ROIs were defined by the peak of stop‐related activity that lay at least 5 mm away from the boundary of the IFG and insula. The post‐hoc regions of interest are spherical ROIs with a radius of 5 mm (same size as the main 10 regions) that reside completely within the inferior frontal gyrus or anterior insula of their respective hemispheres, which was confirmed by applying the Automated Anatomical Labeling atlas (AAL; Tzourio‐Mazoyer et al., 2002) to the ROIs.
Figure 3.
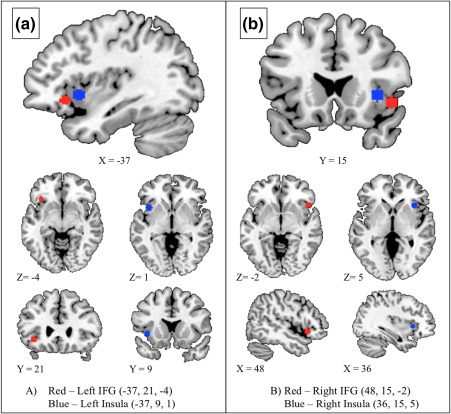
Four new functionally defined ROIs that were generated post hoc to separate inferior frontal gyrus and anterior insula, as these regions were combined in the ROIs used in the earlier analyses. The newly generated ROIs are listed for the right and the left hemisphere, along with their MNI coordinates. (a) The left inferior frontal gyrus (red) and left anterior insula (blue) ROIs are displayed together in the sagittal image, as well as separately in the axial and coronal images. (b) The right inferior frontal gyrus (red) and right anterior insula (blue) are displayed together in the coronal image, as well as separately in the axial and sagittal images [Color figure can be viewed at http://wileyonlinelibrary.com]
3. RESULTS
3.1. Demographic and performance
Group means and standard deviations for demographic variables of the superior and poor inhibitors can be found in Table 2. There were no significant differences in age (t(208) = 0.38, p = .71), sex (Χ 2(1) = 3.49, p = .07), or handedness (X 2(1) = 1.69, p = .19) between the two groups. Group means and standard deviations for performance variables including SSRT, average successful SSD, average reaction time from go trials (RT), and percent of stop trials successfully inhibited can also be found in Table 2. Compared to poor inhibitors, superior inhibitors, by design, had significantly faster SSRT values (t(208) = 38.97, p < .001) and significantly longer average SSD (t(208) = 12.68, p < .001). Superior inhibitors had a greater percent of stop trials successfully inhibited (t(208) = 6.05, p < .01) compared to poor inhibitors. There was no significant difference between superior and poor inhibitors on average reaction times from successful go trials (t(208) = 1.03, p = .3).
Table 2.
Means, standard deviations, and comparison results from demographic and performance data for the superior and poor inhibitors
| Effect | ||||||
|---|---|---|---|---|---|---|
| Superior inhibitors | Poor inhibitors | t/X2 | p value | |||
| Age | M = 18.94 | SD = 0.76 | M = 18.98 | SD = 0.68 | 1.21 | .71 |
| Sex | 54M | 51F | 41M | 64F | 3.25 | .07 |
| Handedness | 90R | 15L | 96R | 9L | 1.69 | .19 |
| M | SD | M | SD | F | p value | |
| SSRT | 137 | 27 | 250 | 12 | 37.01 | <.001* |
| SSD | 241 | 75 | 131 | 47 | 21.92 | <.001* |
| RT | 418 | 60 | 426 | 48 | 10.01 | .30 |
| % Success | 51.9 | 2.1 | 50.4 | 1.5 | 6.05 | <.01* |
Demographic and behavioral differences between superior and poor inhibitors. Age is listed in years, sex denotes the total number of males (M) and females (F) in each group, and handedness denotes the total number of left‐handed (L) and right‐handed individuals (R) in each group. Stop signal reaction time (SSRT), average successful stop signal delay (SSD), and reaction time on go trials (RT) are listed in milliseconds. Also included are percent of stop trials successfully inhibited (% Success). For the effect, either the t statistic or the Pearson's X 2 is provided (X 2 is for sex and handedness), along with the corresponding p value. An * is used to denote statistical significance of p < .05.
3.2. AllSSD fMRI
First, superior and poor inhibitors were compared using activity derived from all successful stop trials across the ten regions of interest. Univariate analysis of covariance (ANCOVA) was used to compare the two groups, and age, sex, handedness, scan acquisition site and percentage of stop trials successfully inhibited were used as covariates in the model (all results held if the percentage of successful stop trials was not included as a covariate). Given that group differences were tested at ten regions functionally defined by the same task contrast and are not completely independent of one another, we employed a modified Bonferroni adjustment accounting for the average correlation of stop success activity across the ten ROIs (r = .38; Bender & Lange, 2001). This resulted in a corrected significance threshold of p < .012.
Superior inhibitors displayed significantly greater stop success activity compared to poor inhibitors in the right IFG/anterior insula (F(197) = 12.28, p < .005) and right temporal (F(197) = 11.02, p < .005) ROIs (Figure 4). In the right occipital ROI, the results suggest superior inhibitors exhibit greater stop success activity than poor inhibitors, however the difference did not pass the corrected statistical threshold (p = .048).
Figure 4.
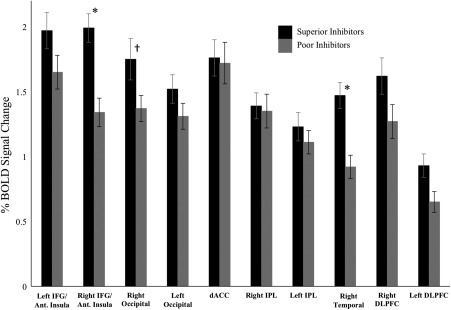
Average percent BOLD signal change for the superior and poor inhibitors in the AllSSD analysis. The ten regions of interest that were analyzed are listed on the x‐axis. Error bars are plotted for ± 1 standard error. An * denotes significant differences between the two groups that survived Bonferroni‐adjusted threshold for significance (p < .012). For the right occipital, † is used to indicate a marginal effect in the right occipital region (p = .048) that did not survive the Bonferroni‐adjusted threshold. To demonstrate effect sizes in the regions showing significant effects, partial eta squared was calculated as ηp 2 = 0.059 and ηp 2 = 0.053 for the right IFG/anterior insula and the right temporal regions, respectively
3.3. CommonSSD and UncommonSSD fMRI
A 2 × 2 mixed effects analysis of covariance (ANCOVA) was run using trial subset as the within‐subject variable (CommonSSD and Uncommon SSD), group as the between‐subject variable (superior and poor inhibitors), and age, sex, handedness, scan acquisition site, and percentage stop success as covariates. The mixed effects ANCOVA revealed significant main effects of group in the right IFG/anterior insula (F(1) = 14.52, p < .001), the right occipital (F(1) = 5.14, p < .01), the right temporal (F(1) = 10.61, p < .01), and the right DLPFC (F(1) = 4.79, p < .05). Critically, significant interactions between group and trial subset were found in the right IFG (F(1,197) = 6.31, p < .05), the right occipital (F(1,197) = 7.54, p < .01), the left occipital (F(1,197) = 9.36, p < .01), the left IPL (F(1,197) = 5.84, p < .05), the right temporal (F(1,197) = 7.33, p < .01), and the left DLPFC (F(1,197) = 6.87, p < .01) regions of interest.
Post hoc comparisons of superior and poor inhibitors were run using the CommonSSD trial subset and the UncommonSSD subtype separately. Bonferroni‐adjusted threshold accounting for average correlation was performed for the CommonSSD and UncommonSSD conditions (r = .43, p < .014; r = .49, p < .016, respectively). In the CommonSSD analysis, the superior inhibitors did not display greater activity compared to the poor inhibitors in any region of interest that passed corrected statistical threshold (Figure 5) although there were subthreshold effects in the right IFG/anterior insula and right temporal region. When comparing the groups using the UncommonSSD subgroup of stop success trials, superior inhibitors displayed significantly greater activity compared to the poor inhibitors in the right IFG/anterior insula, the right occipital, and the right temporal regions of interest (Figure 5). For the left occipital, the left IPL, the left DLPFC, the data suggest greater activity in the superior inhibitors compared to the poor inhibitors, however the results do not survive correction for multiple comparisons (p = .042, p = .021, and p = .025, respectively).
Figure 5.
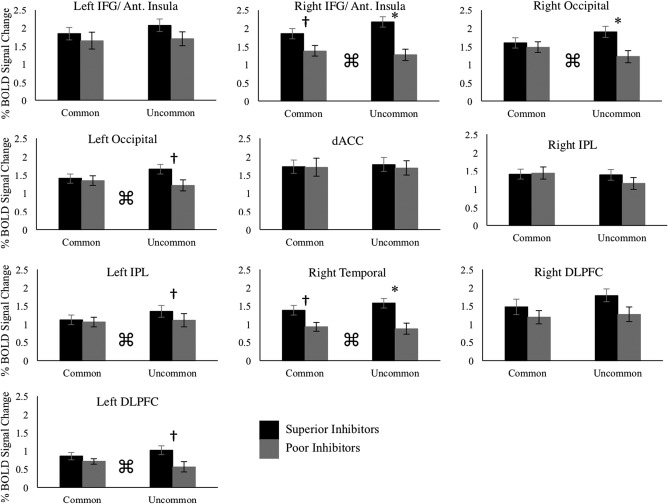
Average percent BOLD signal change for all ten regions of interest in both the CommonSSD and UncommonSSD analyses. Error bars are plotted for ± 1 standard error. Bonferroni adjusted thresholds accounting for average correlation across the ten regions of interest were calculated separately for the CommonSSD (p < .014) and UncommonSSD (p < .016) analyses. An * denotes group differences that surpass the Bonferroni‐corrected thresholds, and † is used to denote p values that are less than .05 but do not pass Bonferroni‐corrected thresholds. ⌘ is used to indicate an interaction between group and analysis condition (CommonSSD vs. UncommonSSD). In regions showing significant interactions, the following effect sizes were calculated for post hoc group differences in the CommonSSD and UncommonSSD analyses. CommonSSD: right IFG/anterior insula ηp 2 = 0.015; right occipital ηp 2 = 0.000; left occipital ηp 2 = 0.000; left IPL ηp 2 = 0.001; right temporal ηp 2 = 0.009; left DLPFC ηp 2 = 0.000. Uncommon SSD: right IFG/anterior insula ηp 2 = 0.083; right occipital ηp 2 = 0.046; left occipital ηp 2 = 0.042; left IPL ηp 2 = 0.027; right temporal ηp 2 = 0.077; left DLPFC ηp 2 = 0.043
3.4. AllSSD‐subsample fMRI
Comparing superior and poor inhibitors on activation derived from a random half of each participant's stop trials yielded similar results to those from the AllSSD analysis. Similar to the AllSSD analysis, superior and poor inhibitors were compared using univariate analysis of covariance (ANCOVA) with age, sex, handedness, scan acquisition site, and percentage of successful stop trials included as covariates. In the AllSSD‐subsample analysis, Bonferroni‐adjusted correction for multiple comparisons accounting for average correlation across the 10 regions (r = .39) created a significance threshold of p < .012. Superior inhibitors displayed significantly greater activity compared to poor inhibitors in the right IFG/anterior insula (F(197) = 10.18, p < .005) and in the right temporal (F(197) = 8.84, p < .05) regions of interest, as was the case in the AllSSD analysis.
3.5. Post hoc separation of IFG and insula
To separate effects in the right and left inferior frontal gyri from effects in the right and left anterior insula, superior and poor inhibitors were compared in the AllSSD analysis and Common/UncommonSSD × group interaction in the four regions created post hoc (See Figure 3). In both analyses, age, sex, scan acquisition site, handedness, and percentage of successful stop trials were included as covariates. In the AllSSD analysis superior inhibitors displayed significantly greater activity than poor inhibitors in the left IFG (F(197) = 7.35, p < .05) and the right IFG (F(197) = 4.45, p < .05), with no group differences in the right or left insula (Figure 6). In the Common/UncommonSSD × group analysis, there was a significant interaction in the left IFG (F(1,197) = 8.75, p < .05), the right IFG (F(1,197) = 3.91, p < .05), and the right insula (F(1,197) = 4.84, p < .05). Post hoc comparison of superior and poor inhibitors were performed for the CommonSSD and UncommonSSD analyses separately (Figure 7). There were no group differences in any of the four regions for the CommonSSD analysis. In the UncommonSSD analysis, superior inhibitors displayed greater activity compared to poor inhibitors in the left IFG (F(197) = 17.87, p < .05), the right IFG (F(197) = 9.13, p < .05), and the right insula (F(197) = 6.01, p < .05).
Figure 6.
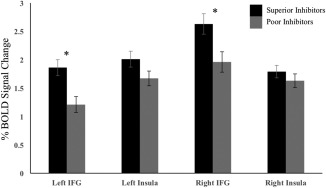
Average percent BOLD signal change for the superior and poor inhibitors in the AllSSD analysis for the four ROIs that were functionally defined post hoc to separate the inferior frontal gyri from the insula. Error bars are plotted for ± 1 standard error. An * denotes significant differences between the two groups at a level of p < .05. To demonstrate effect sizes in the regions showing significant effects, partial eta squared was calculated as ηp 2 = 0.036 and ηp 2 = 0.022 for the left IFG and the right IFG, respectively
Figure 7.
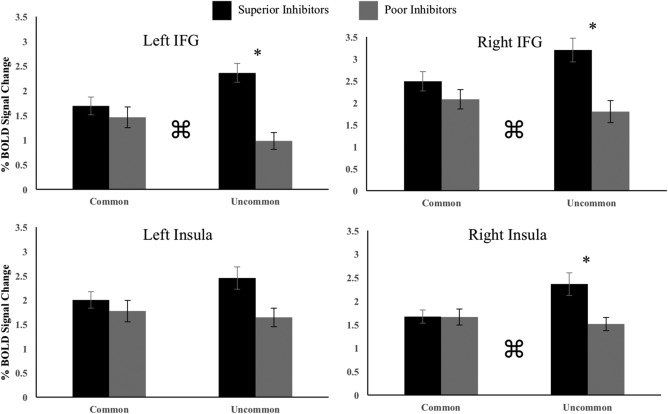
Average percent BOLD signal change for post hoc inferior frontal gyri and insula regions in the CommonSSD and UncommonSSD analyses. Error bars are plotted for ± 1 standard error. An * denotes group differences at a level of p < .05. ⌘ is used to indicate an interaction between group and analysis condition (CommonSSD vs. UncommonSSD). In regions showing significant interactions, the following effect sizes were calculated for post hoc group differences in the CommonSSD and UncommonSSD analyses. CommonSSD: left IFG ηp 2 = 0.003; right IFG ηp 2 = 0.006; right insula ηp 2 = 0.002. Uncommon SSD: left IFG ηp 2 = 0.083; right IFG ηp 2 = 0.041; right insula ηp 2 = 0.031. left IPL ηp 2 = 0.027; right temporal ηp 2 = 0.077; left DLPFC ηp 2 = 0.043
4. DISCUSSION
The current study examined the influence of the adaptive algorithm in the Stop Signal Task when measuring inter‐individual differences in stop‐related activity. The adaptive SST has particular strengths for inhibitory control research in that it allows for easy calculation of a measure of the speed of inhibitory processes (i.e., the SSRT) and it ensures all participants are inhibiting at an equal inhibition rate (∼50% of stop trials). However, the cause for concern raised in this report is that it achieves the latter by creating an objectively more difficult version of the task for superior inhibitors. Consequently, these differences in task difficulty may contribute to the greater stop‐related activity seen in superior inhibitors and in healthy controls when compared to clinical participants.
The present results suggest that comparing superior and poor inhibitors on trials matched for objective difficulty (i.e., trial SSD) yields different results than comparing the groups on trials matched for inhibition rate performance (i.e., subjective task difficulty). In the AllSSD condition (equal subjective difficulty), superior inhibitors displayed greater activity than poor inhibitors in the right IFG/anterior insula and the right temporal regions of interest. In the CommonSSD condition (equal objective difficulty) these effects did not survive correction for multiple comparisons. Furthermore, results from the AllSSD‐subsample condition matched those from the AllSSD condition, suggesting the attenuation of group differences observed in the CommonSSD condition is not a result of the reduction in the number of trials (i.e., loss of statistical power) used to generate stop‐related activity.
In the right IFG/anterior insula, the right occipital, the left occipital, the left IPL, the right temporal, and the left DLPFC, there were significant interactions between condition (CommonSSD vs. UncommonSSD) and group. If difficulty to inhibit increases as SSD increases, then the UncommonSSD condition reflects the largest group difference in objective task difficulty, being composed of the shortest SSD trials from the poor inhibitors and the longest SSD trials from the superior inhibitors. As seen in Figure 5, post hoc analyses of these interactions show these regions of interest exhibit larger group differences in the UncommonSSD condition compared to the CommonSSD condition. Combined with the main effects of the AllSSD and CommonSSD analyses, these results support the hypothesis that differences in objective task difficulty inflate group differences in stop‐related activity. That said, it should be noted that the subthreshold effects observed in the CommonSSD condition and the pattern of effects in Figure 5 show the influence of task difficulty to be largely quantitative in nature.
Although the focus of the current study was to examine the influence of objective task difficulty on stop‐related activity and not the neurobiology of individual differences in inhibitory ability per se, the analyses here may identify dissociable roles for the inferior frontal gyri and insulae. The post‐hoc separation of the inferior frontal gyri and the anterior insulae revealed that in the AllSSD analysis superior inhibitors displayed greater activity compared to poor inhibitors in bilateral IFG but not in either left or right insula. This result alone is interesting supporting the distinct roles of the IFG and insula in the stopping network and salience network, respectively (Aron & Poldrack, 2006; Menon & Uddin, 2010). Furthermore, that the effect was observed in both the right and left IFG agrees with previous work arguing the role of both the right and left hemispheres in inhibitory ability (D'Alberto, Funnel, Potter, & Garavan, 2017). The interaction of group and trial subset revealed larger group differences in the UncommonSSD analysis compared to the CommonSSD analysis in the left IFG, the right IFG, and the right Insula. These results reiterate the conclusion that objective task difficulty influences stop‐related activity, particularly in regions that exhibit group differences in the standard AllSSD analysis. Future studies should further explore how the effects of objective task difficulty influence the neurobiology associated with individual differences in inhibitory control, particularly in studies with finer spatial resolution such as those employing the Human Connectome Project processing stream (Van Essen et al., 2012).
The findings from the AllSSD analysis replicate previous neuroimaging work on the SST demonstrating that superior performance on the task is associated with increased neural activity (Aron & Poldrack, 2006; Chikazoe et al., 2009; Chao et al., 2009; Congdon et al., 2010; Duann et al., 2009; Li et al., 2006; Li et al., 2008; Whelan et al., 2012). However, these studies have failed to acknowledge the potential influence of SSD length, and therein objective task difficulty. Thus, the current report is, to our knowledge, the first to show that group differences in neural activity are diminished when controlling for objective task difficulty in the Stop Signal Task.
Although the present results suggest that objective task difficulty influences stop‐related activity, the AllSSD analysis, which includes all trials and is standard in the literature, should still be considered a valuable probe of individual differences in inhibitory ability. Rather than interpreting the increased activation level of a superior inhibitor as indicating that they necessarily activate more when inhibiting, we suggest instead that it reveals the increased activation “capacity” that the superior inhibitor has. The adaptive SST successfully reveals the superior ability of this participant (faster SSRT and longer successfully inhibited SSD) and the increased levels of activity that they can achieve. The corollary is that it is not the case that the superior inhibitor must activate more in order to successfully inhibit (once the influence of task difficulty is accommodated). Previous work has found similar effects in tasks of working memory and proactive response inhibition. Specifically, Schneider‐Garces and colleagues (2010) found that on a working memory task in which young adults outperform a group of elderly participants, young adults showed an increase in neural activity as task demands increased, whereas elderly participants did not show this increase. Similarly, a study examining the Go/No‐Go task found that adults, but not children, were able to increase activation in ventral prefrontal regions as interference increased from additional go trials (Durston et al., 2002). Although the current study cannot interpret results from a developmental framework as the two aforementioned reports do, the results here also suggest superior task ability is associated with an increased capacity for activation as objective task demands increase.
The results from the current study suggest a caveat when interpreting group difference in activation in the presence of performance differences, as is often the case when contrasting a clinical group against controls. If activation differences are related, in part, to the differences in task difficulty that arise from differences in inhibitory ability then the magnitude of those activation differences are will be affected by the SSD effects described here. The degree to which groups differ on stop‐related activity will be related to the degree to which those groups differ on the distribution of successful stop signal delays. Thus, the magnitude of group differences in activation will reflect a combination of both inherent difference in the ability to activate per se and the task difficulty effect. Arising from this conclusion, the authors propose the following recommendations for future research. First, if researchers wish to account for the influence of objective task difficulty on stop‐related BOLD activity, then the research design might employ the “CommonSSD” analysis approach used here. Second, for research continuing to use the standard “AllSSD” analysis, we offer a nuanced interpretation of individual differences in stop‐related BOLD activity. That is, individual differences in inhibitory ability are reflective of a greater capacity for activation as the objective difficulty to inhibit a response increases. Thus, superior inhibitors do not activate the STOP network more than poor inhibitors if the two are compared on trials of similar objective task difficulty (i.e. SSD). However, the superior ability of the former group is demonstrated by their ability to perform more difficult trials yielding greater levels of activation. This interpretation offers insight into the neurobiological mechanisms that characterize individual differences in inhibitory control.
5. CONCLUSION
While the SST retains very many strengths, we suggest that interpretations of individual or group differences in activation should be cognizant of the effect of the adaptive algorithm. The standard analysis based on all trials yields activation measures that reflect both the inherent inhibitory abilities of the individual plus the activation related to the difficulty level of the task produced by the algorithm.
DISCLOSURES
Dr. Banaschewski has served as an advisor or consultant to Bristol‐Myers Squibb, Desitin Arzneimittel, Eli Lilly, Medice, Novartis, Pfizer, Shire, UCB, and Vifor Pharma; he has received conference attendance support, conference support, or speaking fees from Eli Lilly, Janssen McNeil, Medice, Novartis, Shire, and UCB; and he is involved in clinical trials conducted by Eli Lilly, Novartis, and Shire; the present work is unrelated to these relationships. Dr. Gallinat has received research funding from the German Federal Ministry of Education and Research, AstraZeneca, Eli Lilly, Janssen‐Cilag, and Bristol‐Myers Squibb; he has received speaking fees from AstraZeneca, Janssen‐Cilag, and Bristol‐Myers Squibb. Dr Barker has received honoraria from General Electric for teaching on scanner programming courses. The other authors report no biomedical financial interests or potential conflicts of interest.
ACKNOWLEDGMENTS
This work received support from the following sources: the European Union‐funded FP6 Integrated Project IMAGEN (Reinforcement‐related behavior in normal brain function and psychopathology) (LSHM‐CT‐ 2007‐037286), the FP7 projects IMAGEMEND(602450; IMAging GEnetics for MENtal Disorders), AGGRESSOTYPE (602805) and MATRICS (603016), the Innovative Medicine Initiative Project EU‐AIMS (115300‐2), the Medical Research Council Grants “Developmental pathways into adolescent substance abuse” (93558) and Consortium on Vulnerability to Externalizing Disorders and Addictions [c‐VEDA] (MR/N000390/1), the Swedish funding agencies VR, FORTE and FORMAS, the Medical Research Council and the Wellcome Trust (Behavioural and Clinical Neuroscience Institute, University of Cambridge), the National Institute for Health Research (NIHR) Biomedical Research Centre at South London and Maudsley NHS Foundation Trust and King's College London, the Bundesministeriumfür Bildung und Forschung (BMBF grants 01GS08152; 01EV0711; eMED SysAlc01ZX1311A; Forschungsnetz AERIAL), the Deutsche Forschungsgemeinschaft (DFG grants SM 80/7‐1, SM 80/7‐2, SFB 940/1), the National Institutes of Health, U.S.A. (Axon, Testosterone and Mental Health during Adolescence; RO1 MH085772‐01A1), and by NIH Consortium grant U54 EB020403, supported by a cross‐NIH alliance that funds Big Data to Knowledge Centres of Excellence. Dr. Garavan is supported by a Tobacco Centers of Regulatory Science award (P50DA036114). In addition, Drs. Garavan and Potter are supported P20GM103644 (PI: Stephen T. Higgins), Agency: NIGMS Vermont Center on Behavior and Health.
D'Alberto N, Chaarani B, Orr CA, et al. Individual differences in stop‐related activity are inflated by the adaptive algorithm in the stop signal task. Hum Brain Mapp. 2018;39:3263–3276. 10.1002/hbm.24075
Funding information Grant Sponsor: European Union‐funded FP6 Integrated Project IMAGEN (Reinforcement‐related behavior in normal brain function and psychopathology), Grant/Award Number: LSHM‐CT‐ 2007‐037286; FP7 projects IMAGEMEND, Grant/Award Number: 602450; IMAging GEnetics for MENtal Disorders; Grant Sponsor: AGGRESSOTYPE, Grant/Award Number: 602805; Grant Sponsor: MATRICS, Grant/Award Number: 603016; Grant Sponsor: Innovative Medicine Initiative Project EU‐AIMS, Grant/Award Number: 115300‐2; Medical Research Council Grants “Developmental pathways into adolescent substance abuse”, Grant/Award Number: 93558; Grant Sponsor: Consortium on Vulnerability to Externalizing Disorders and Addictions [c‐VEDA], Grant/Award Number: MR/N000390/1; Grant Sponsor: Swedish funding agencies VR, FORTE and FORMAS; Grant Sponsor: Medical Research Council and the Wellcome Trust (Behavioural and Clinical Neuroscience Institute, University of Cambridge); Grant Sponsor: National Institute for Health Research (NIHR) Biomedical Research Centre at South London and Maudsley NHS Foundation Trust and King's College London; Grant Sponsor: Bundesministeriumfür Bildung und Forschung, Grant/Award Numbers: BMBF grants 01GS08152; 01EV0711; eMED SysAlc01ZX1311A; Forschungsnetz AERIAL; Grant Sponsor: Deutsche Forschungsgemeinschaft, Grant/Award Numbers: DFG grants SM 80/7‐1, SM 80/7‐2, SFB 940/1; Grant Sponsor: National Institutes of Health, USA (Axon, Testosterone and Mental Health during Adolescence; RO1), Grant/Award Number: MH085772‐01A1; Grant Sponsor: NIH Consortium grant, Grant/Award Number: U54 EB020403; Grant Sponsor: cross‐NIH alliance that funds Big Data to Knowledge Centres of Excellence; Grant Sponsor: Tobacco Centers of Regulatory Science award, Grant/Award Number: P50DA036114; Grant Sponsor: NIGMS Vermont Center on Behavior and Health, Grant/Award Number: P20GM103644
REFERNCES
- Alderson, R. M. , Rapport, M. D. , & Kofler, M. J. (2007). Attention‐deficit/hyperactivity disorder and behavioral inhibition: A meta‐analytic review of the stop‐signal paradigm. Journal of Abnormal Child Psychology, 35(5), 745–758. 10.1007/s10802-007-9131-6 [DOI] [PubMed] [Google Scholar]
- Aron, A. R. (2006). Cortical and subcortical contributions to stop signal response inhibition: Role of the subthalamic nucleus. Journal of Neuroscience, 26(9), 2424–2433. 10.1523/JNEUROSCI.4682-05.2006 [DOI] [PMC free article] [PubMed] [Google Scholar]
- Aron, A. R. , Robbins, T. W. , & Poldrack, R. A. (2004). Inhibition and the right inferior frontal cortex. Trends in Cognitive Sciences, 8(4), 170–177. 10.1016/j.tics.2004.02.010 [DOI] [PubMed] [Google Scholar]
- Barkley, R. A. (1997). Behavioral inhibition, sustained attention, and executive functions: Constructing a unifying theory of ADHD. Psychological Bulletin, 121(1), 65–94. 10.1037/0033-2909.121.1.65 [DOI] [PubMed] [Google Scholar]
- Bender, R. , & Lange, S. (2001). Adjusting for multiple testing – When and how? Journal of Clinical Epidemiology, 54(4), 343–349. 10.1016/S0895-4356(00)00314‐0 [DOI] [PubMed] [Google Scholar]
- Casey, B. J. , Castellanos, F. X. , Giedd, J. N. , Marsh, W. L. , Hamburger, S. D. , Schubert, A. B. , … Rapoport, J. L. (1997). Implication of right frontostriatal circuitry in response inhibition and attention‐deficit/hyperactivity disorder. Journal of the American Academy of Child & Adolescent Psychiatry, 36(3), 374–383. 10.1097/00004583-199703000-00016 [DOI] [PubMed] [Google Scholar]
- Chao, H. H. , Luo, X. , Chang, J. L. , & Li, C. R. (2009). Activation of the pre‐supplementary motor area but not inferior prefrontal cortex in association with short stop signal reaction time – an intra‐subject analysis. BMC Neuroscience, 10(1), 75 10.1186/1471-2202-10-75 [DOI] [PMC free article] [PubMed] [Google Scholar]
- Chikazoe, J. , Jimura, K. , Hirose, S. , Yamashita, K.‐I. , Miyashita, Y. , & Konishi, S. (2009). Preparation to Inhibit a Response Complements Response Inhibition during Performance of a Stop‐Signal Task. Journal of Neuroscience, 29(50), 15870–15877. 10.1523/JNEUROSCI.3645-09.2009 [DOI] [PMC free article] [PubMed] [Google Scholar]
- Congdon, E. , Mumford, J. A. , Cohen, J. R. , Galvan, A. , Aron, A. R. , Xue, G. , … Poldrack, R. A. (2010). Engagement of large‐scale networks is related to individual differences in inhibitory control. NeuroImage, 53(2), 653–663. 10.1016/j.neuroimage.2010.06.062 [DOI] [PMC free article] [PubMed] [Google Scholar]
- Congdon, E. , Mumford, J. A. , Cohen, J. R. , Galvan, A. , Canli, T. , & Poldrack, R. A. (2012). Measurement and reliability of response inhibition. Frontiers in Psychology, 3, (37 10.3389/fpsyg.2012.00037 [DOI] [PMC free article] [PubMed] [Google Scholar]
- Cubillo, A. , Halari, R. , Ecker, C. , Giampietro, V. , Taylor, E. , & Rubia, K. (2010). Reduced activation and inter‐regional functional connectivity of fronto‐striatal networks in adults with childhood Attention‐Deficit Hyperactivity Disorder (ADHD) and persisting symptoms during tasks of motor inhibition and cognitive switching. Journal of Psychiatric Research, 44(10), 629–639. 10.1016/j.jpsychires.2009.11.016 [DOI] [PubMed] [Google Scholar]
- D'Alberto, N. , Funnel, M. , Potter, A. , & Garavan, H. (2017). A split‐brain case study on the hemispheric lateralization of inhibitory control. Neuropsychologia, 99, 24–29. 10.1016/j.neuropsychologia.2017.02.17 [DOI] [PubMed] [Google Scholar]
- Dickstein, S. G. , Bannon, K. , Xavier Castellanos, F. , & Milham, M. P. (2006). The neural correlates of attention deficit hyperactivity disorder: An ALE meta‐analysis. Journal of Child Psychology and Psychiatry, 47(10), 1051–1062. 10.1111/j.1469-7610.2006.01671.x [DOI] [PubMed] [Google Scholar]
- Duann, J.‐R. , Ide, J. S. , Luo, X. , & Li, C.‐S R. (2009). Functional connectivity delineates distinct roles of the inferior frontal cortex and presupplementary motor area in stop signal inhibition. Journal of Neuroscience, 29(32), 10171–10179. 10.1523/JNEUROSCI.1300-09.2009 [DOI] [PMC free article] [PubMed] [Google Scholar]
- Durston, S. , Thomas, K. M. , Yang, Y. , Ulug, A. M. , Zimmerman, R. D. , & Casey, B. J. (2010). A neural basis for the development of inhibitory control. Developmental Science, 5(4), F9–F16. 10.1111/1467‐7687.00235 [Google Scholar]
- Hart, H. , Radua, J. , Nakao, T. , Mataix‐Cols, D. , & Rubia, K. (2013). Meta‐analysis of functional magnetic resonance imaging studies of inhibition and attention in attention‐deficit/hyperactivity disorder: Exploring task‐specific, stimulant medication, and age effects. JAMA Psychiatry, 70(2), 185 10.1001/jamapsychiatry.2013.277 [DOI] [PubMed] [Google Scholar]
- Hart, H. , Chantiluke, K. , Cubillo, A. I. , Smith, A. B. , Simmons, A. , Brammer, M. J. , … Rubia, K. (2014). Pattern classification of response inhibition in ADHD: Toward the development of neurobiological markers for ADHD: Pattern Classification of fMRI of Response Inhibition in ADHD. Human Brain Mapping, 35(7), 3083–3094. 10.1002/hbm.22386 [DOI] [PMC free article] [PubMed] [Google Scholar]
- Li, C. R. , Huang, C. , Constable, R. T. , & Sinha, R. (2006). Imaging response inhibition in a stop‐signal task: Neural correlates independent of signal monitoring and post‐response processing. Journal of Neuroscience, 26(1), 186–192. 10.1523/JNEUROSCI.3741-05.2006 [DOI] [PMC free article] [PubMed] [Google Scholar]
- Li, C. R. , Yan, P. , Sinha, R. , & Lee, T.‐W. (2008). Subcortical processes of motor response inhibition during a stop signal task. NeuroImage, 41(4), 1352–1363. 10.1016/j.neuroimage.2008.04.023 [DOI] [PMC free article] [PubMed] [Google Scholar]
- Lijffijt, M. , Kenemans, J. L. , Verbaten, M. N. , & van Engeland, H. (2005). A meta‐analytic review of stopping performance in attention‐deficit/hyperactivity disorder: Deficient inhibitory motor control? Journal of Abnormal Psychology, 114(2), 216–222. 10.1037/0021-843X.114.2.216 [DOI] [PubMed] [Google Scholar]
- Liotti, M. , Pliszka, S. R. , Perez, R. , Kothmann, D. , & Woldorff, M. G. (2005). Abnormal brain activity related to performance monitoring and error detection in children with ADHD. Cortex, 41(3), 377–388. 10.1016/S0010-9452(08)70274‐0 [DOI] [PubMed] [Google Scholar]
- Logan, G. D. (1994). On the ability to inhibit thought and action: A users’ guide to the stop signal paradigm In Dagenbach D. Carr T. H. (Ed.), Inhibitory processes in attention, memory, and language (pp. 189–239). San Diego, CA: Academic Press. [Google Scholar]
- Logan, G. D. , & Cowan, W. B. (1984). On the ability to inhibit thought and action: A theory of an act of control. Psychological Review, 91(3), 295–327. 10.1037/0033-295X.91.3.295 [DOI] [PubMed] [Google Scholar]
- Logan, G. D. , Schachar, R. J. , & Tannock, R. (1997). Impulsivity and Inhibitory Control. Psychological Science, 8(1), 60–64. 10.1111/j.1467-9280.1997.tb00545.x [DOI] [Google Scholar]
- Menon, V. , & Uddin, L. C. (2010). Saliency, switching, attention and control: A network model of insula function. Brain Structure and Function, 214(4–5), 655–667. [DOI] [PMC free article] [PubMed] [Google Scholar]
- Morein‐Zamir, S. , Dodds, C. , van Hartevelt, T. J. , Schwarzkopf, W. , Sahakian, B. , Müller, U. , & Robbins, T. (2014). Hypoactivation in right inferior frontal cortex is specifically associated with motor response inhibition in adult ADHD: Inhibition‐Specific Hypoactivation in ADHD. Human Brain Mapping, 35(10), 5141–5152. 10.1002/hbm.22539 [DOI] [PMC free article] [PubMed] [Google Scholar]
- Nigg, J. T. , Wong, M. M. , Martel, M. M. , Jester, J. M. , Puttler, L. I. , Glass, J. M. , … Zucker, R. A. (2006). Poor response inhibition as a predictor of problem drinking and illicit drug use in adolescents at risk for alcoholism and other substance use disorders. Journal of the American Academy of Child & Adolescent Psychiatry, 45(4), 468–475. 10.1097/01.chi.0000199028.76452.a9 [DOI] [PubMed] [Google Scholar]
- Oosterlaan, J. , Logan, G. D. , & Sergeant, J. A. (1998). Response inhibition in AD/HD, CD, comorbid AD/HD+CD, anxious, and control children: A meta‐analysis of studies with the stop task. Journal of Child Psychology and Psychiatry, 39(3), 411–425. 10.1111/1469-7610.00336 [DOI] [PubMed] [Google Scholar]
- Passarotti, A. M. , Sweeney, J. A. , & Pavuluri, M. N. (2010). Neural correlates of response inhibition in pediatric bipolar disorder and attention deficit hyperactivity disorder. Psychiatry Research: Neuroimaging, 181(1), 36–43. 10.1016/j.pscychresns.2009.07.002 [DOI] [PMC free article] [PubMed] [Google Scholar]
- Penadés, R. , Catalán, R. , Rubia, K. , Andrés, S. , Salamero, M. , & Gastó, C. (2007). Impaired response inhibition in obsessive compulsive disorder. European Psychiatry, 22(6), 404–410. 10.1016/j.eurpsy.2006.05.001 [DOI] [PubMed] [Google Scholar]
- Pliszka, S. R. , Liotti, M. , & Woldorff, M. G. (2000). Inhibitory control in children with attention‐deficit/hyperactivity disorder: Event‐related potentials identify the processing component and timing of an impaired right‐frontal response‐inhibition mechanism. Biological Psychiatry, 48(3), 238–246. 10.1016/S0006-3223(00)00890‐8 [DOI] [PubMed] [Google Scholar]
- Quay, H. C. (1997). Inhibition and attention deficit hyperactivity disorder. Journal of Abnormal Child Psychology, 25(1), 7–13. 10.1023/A:1025799122529 [DOI] [PubMed] [Google Scholar]
- Rubia, K. , Overmeyer, S. , Taylor, E. , Brammer, M. , Williams, S. C. R. , Simmons, A. , & Bullmore, E. T. (1999). Hypofrontality in attention deficit hyperactivity disorder during higher‐order motor control: A study with functional MRI. American Journal of Psychiatry, 156(6), 891–896. 10.1176/ajp.156.6.891 [DOI] [PubMed] [Google Scholar]
- Rubia, K. , Smith, A. B. , Brammer, M. J. , Toone, B. , & Taylor, E. (2005). Abnormal brain activation during inhibition and error detection in medication‐naive adolescents with ADHD. American Journal of Psychiatry, 162(6), 1067–1075. 10.1176/appi.ajp.162.6.1067 [DOI] [PubMed] [Google Scholar]
- Schneider‐Garces, N. J. , Gordon, B. A. , Brumback‐Peltz, C. R. , Eunsam, S. , Yukyung, L. , Sutton, B. P. , … Fabiani, M. (2010). Span, CRUNCH, and beyond: Working memory capacity and the aging brain. Journal of Cognitive Neuroscience, 22(4), 655–669. [DOI] [PMC free article] [PubMed] [Google Scholar]
- Schumann, G. , Loth, E. , Banaschewski, T. , Barbot, A. , Barker, G. , Büchel, C. , … Struve, M. (2010). The IMAGEN study: Reinforcement‐related behaviour in normal brain function and psychopathology. Molecular Psychiatry, 15(12), 1128–1139. 10.1038/mp.2010.4 [DOI] [PubMed] [Google Scholar]
- Senderecka, M. , Grabowska, A. , Szewczyk, J. , Gerc, K. , & Chmylak, R. (2012). Response inhibition of children with ADHD in the stop‐signal task: An event‐related potential study. International Journal of Psychophysiology, 85(1), 93–105. 10.1016/j.ijpsycho.2011.05.007 [DOI] [PubMed] [Google Scholar]
- Siegel, J. S. , Power, J. D. , Dubis, J. W. , Vogel, A. C. , Church, J. A. , Schlaggar, B. L. , & Petersen, S. E. (2014). Statistical improvements in functional magnetic resonance imaging analyses produced by censoring high‐motion data points. Human Brain Mapping, 35(5), 1981–1996. 10.1002/hbm.22307 [DOI] [PMC free article] [PubMed] [Google Scholar]
- Slaats‐Willemse, D. , Swaab‐Barneveld, H. , de Sonneville, L. , van der Meulen, E. , & Buitelaar, J. (2003). Deficient response inhibition as a cognitive endophenotype of ADHD. Journal of the American Academy of Child & Adolescent Psychiatry, 42(10), 1242–1248. 10.1097/00004583-200310000-00016 [DOI] [PubMed] [Google Scholar]
- Tzourio‐Mazoyer, N. , Landeau, B. , Papathanassiou, D. , Crivello, F. , Etard, O. , Delcroix, N. , … Joliot, M. (2002). Automated Anatomical Labeling of activations in SPM using a macroscopic anatomical parcellation of the MNI MRI single‐subject brain. Neuroimage, 15(1), 273–289. 10.1016/nim.2001.0978 [DOI] [PubMed] [Google Scholar]
- Van Essen, D. C. , Ugurbil, K. , Auerbach, E. , Barch, D. , Behrens, T. E. J. , Bucholz, R. … (2012). The Human Connectome Project: A data acquisition perspective. Neuroimage, 62(4), 2222–2231. 10.1016/j.neuroimage.2012.02.018 [DOI] [PMC free article] [PubMed] [Google Scholar]
- Whelan, R. , Conrod, P. J. , Poline, J.‐B. , Lourdusamy, A. , Banaschewski, T. , Barker, G. J. , … Garavan, H. (2012). Adolescent impulsivity phenotypes characterized by distinct brain networks. Nature Neuroscience, 15(6), 920–925. 10.1038/nn.3092 [DOI] [PubMed] [Google Scholar]