Abstract
Ovarian cancer yields the highest mortality rate of all lethal gynecologic cancers, and the prognosis is unsatisfactory with the major obstacle in resistance to chemotherapy. The generation of reactive oxygen species (ROS) in tumor tissues was associated with chemotherapeutic effectiveness by mediating cellular longevity. In this study, we screened the prognostic values of oxidative stress-related genes in ovarian cancer patients received platinum-based chemotherapy, and conducted a prognostic gene signature composing of three genes, TXNRD1, GLA and GSTZ1. This three-gene signature was significantly associated with overall survival (OS), but not progression-free survival (PFS), in both training (n=276) and validation cohorts (n=230). Interestingly, we found that the prognostic value of three-gene signature was reinforced in platinum-sensitive patients. Subgroup analysis further suggested that patients with elder age, higher pathological grades and advanced tumor stages in low-risk score group could benefit from platinum-based chemotherapy. Functional analysis showed that the inactivation of several signaling pathways, including cell cycle, insulin-like growth factor 1 (IGF1) /mTOR and Fas pathways, was affected by three genes. Collectively, our results provided evidence that a panel of three oxidative stress-related gene signature had prognostic values for ovarian cancer patients received platinum-based chemotherapy.
Keywords: oxidative stress, prognosis, ovarian cancer, platinum, chemotherapy
Introduction
Ovarian cancer, as one of the most lethal malignancies among females, had approximately 238,700 newly diagnosed cases each year worldwide [1,2]. Due to its vague symptoms and lack of effective biomarkers, most patients were usually diagnosed at advanced stages [1,3–6]. Despite recent advancements in therapies, the prognosis of ovarian cancer is still unsatisfactory with the major obstacle in resistance to standard platinum-based chemotherapy. So far, combination of cyto-reductive surgery and post-operative chemotherapy is the current standard treatment for advanced ovarian cancer. However, more than 70% patients developed resistance to the platinum-based chemotherapy after surgery within six months [7–9]. The clinical characteristics, such as histologic type, tumor grade, debulking status and CA-125 levels, did not achieve satisfied prognostic values for ovarian cancer patients [10]. Therefore, it is essential to explore promising prognostic biomarkers in ovarian cancer patients.
During the past decade, great efforts have been made to explore the molecular mechanisms involved in the response to platinum-based chemotherapy in ovarian cancer patients. It has been well-demonstrated that chemotherapy-induced oxidative stress was associated with chemotherapeutic effectiveness [11]. Mechanistic investigations showed that the generation of reactive oxygen species (ROS) caused genomic instability in tumor cells and promoted cellular apoptosis, senescence or autophagy [12]. Thus, the intracellular balance of oxidants and antioxidants contributed to the therapeutic effectiveness in ovarian cancer patients received platinum-based chemotherapy. Indeed, several oxidative stress-related genes, such as ARHGEF6 [13] and ALDH1 [14], have been reported to be related to chemo-resistance in ovarian cancer. However, effective molecular biomarkers accurately predicting clinical prognosis in ovarian cancer patients received platinum-based chemotherapy have not yet been thoroughly explored.
In this study, we performed comprehensive investigations to identify the prognostic gene signature from 99 oxidative stress-related genes. Using cox regression analysis, we developed a three-gene prognostic signature consisting of TXNRD1, GLA and GSTZ1, and validated this model in another independent cohort. Additionally, we also performed bioinformatic analysis to explore the potential molecular mechanisms underlying the different clinical outcomes of ovarian cancer patients.
RESULTS
Construction of prognostic model based on oxidative stress-related genes in the training group
Firstly, we employed 276 ovarian cancer patients to construct the prognostic model by using oxidative stress-related genes. All oxidative stress-related genes were listed in Table S1. By subjecting the genes expression data to Cox regression analysis, we identified a panel of three oxidative stress-related genes consisting of TXNRD1, GLA and GSTZ1, which were strongly correlated with patients’ overall survival (Table 1, P<0.05). We then calculated the risk score for each patient in the training group by using the risk score formula. Using the median risk score as cut-off value, the patients in the training group were divided into low (n = 138) and high (n = 138) risk score subgroups (Figure 1A). As shown in Figure 1B, the expression patterns showed that the patients in high risk score group had higher TXNRD1 expression and lower GLA and GSTZ1 expression.
Table 1. Three-genes signature associated with the OS of ovarian cancer patients received platinum-based chemotherapy.
Figure 1.
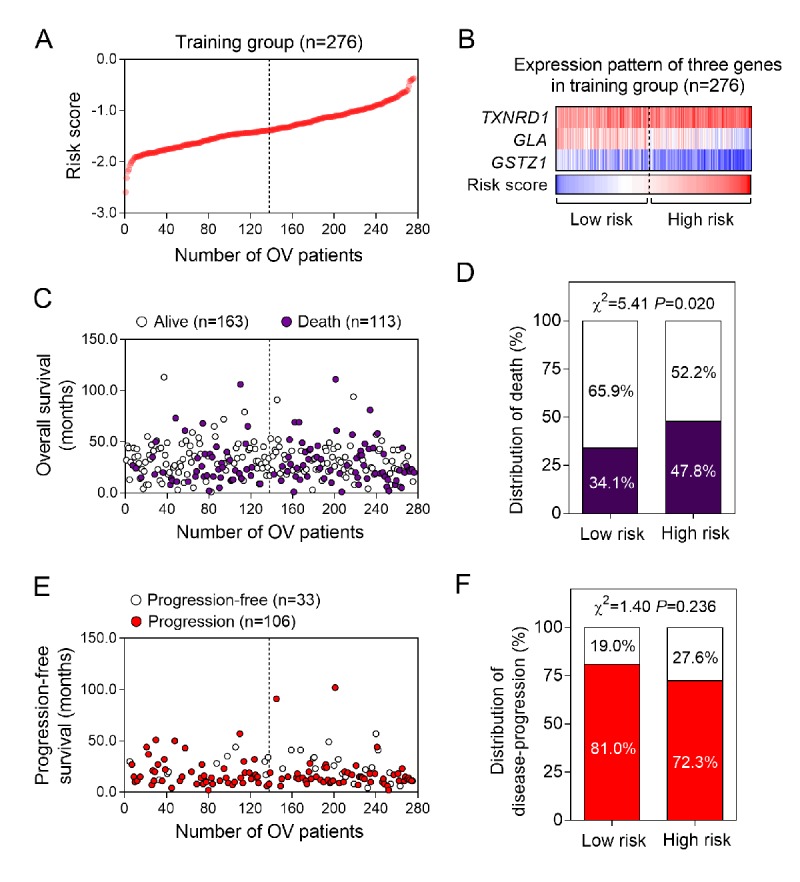
The three-gene signature-focused risk score in prognosis of overall survival in the validation group. (A) The three gene-based risk score distribution. (B) The heatmap of the expression of three genes. (C) Patients’ overall survival status in training group. (D) The mortality rate in low- and high-risk score groups. (E) Patients’ progression-free survival status in training group. (F) The recurrence rate in low- and high-risk score groups.
Next, we analyzed the differences of clinical outcomes between high and low risk score groups (Figure 1C). Our data suggested that the mortality rate in high risk score group was significantly higher than low risk score group (Figure 1D, P=0.020). Moreover, we also analyzed the disease progression status in 139 patients who had tumor progression information (Figure 1E). Unexpectedly, we found there is no differences of tumor progression status between high and low risk score groups (Figure 1F). To further explore the association between the three-gene signature and survival, we performed the Kaplan-Meier curves to estimate the MST between two groups. As expected, patients in the high risk score group had significantly shorter overall survival time (MST=43.0 months) than those in the low risk score group (MST=65.0 months) [HR (95%CI) =1.54 (1.06-2.23); log-rank P value=0.021] (Figure 2A). However, we find no significance in progression-free survival between the high and low risk score groups [15.0 months vs 16.0 months; HR(95%CI) =0.98 (0.69-1.43); log-rank P value=0.911] (Figure 2B).
Figure 2.
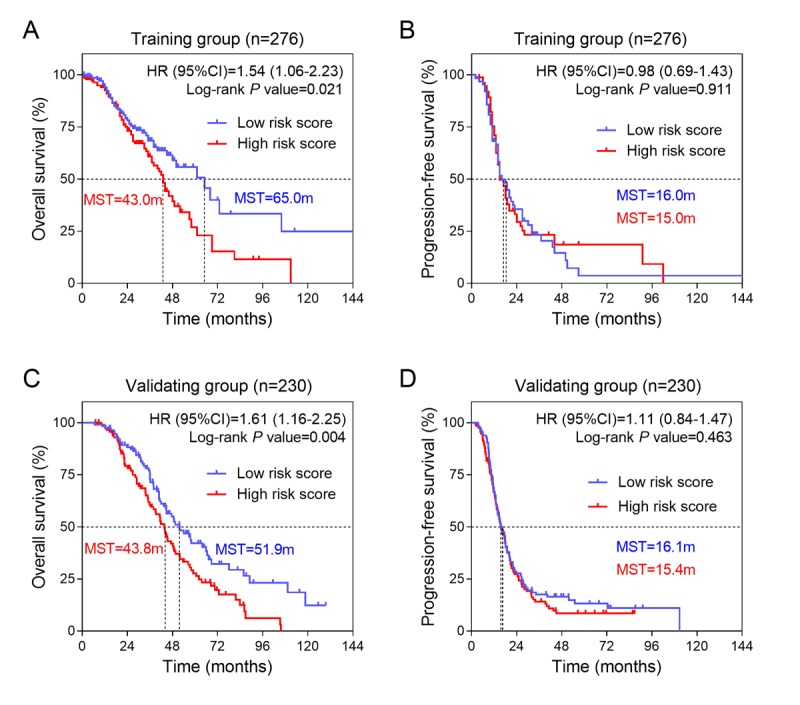
The association between three-gene signature and survival in training and validation groups. (A) Kaplan-Meier survival curves were plotted to estimate the overall survival probabilities for the low-risk versus high-risk group in training group (n=276). (B) Progression-free survival was estimated by Kaplan-Meier curves in training group (n=276). (C) Overall survival and (D) progression-free survival were estimated in validation group (n=230).
Validation of the three-gene signature for survival prediction in the validation group
To validate our findings, we calculated the risk score for ovarian cancer patients in an independent validation group (n = 230) using the same formula. Because the gene expression profiles in validation group were based on RNA-sequencing platform, which was different from the training group (Affymetrix Human Genome U133 Plus 2.0 platform), we did not use same cut-off value as the training group, but selected the median value in training group as the cut off. The patients from the validation group were divided into low and high risk score groups and then subjected to survival comparison. Similar to the findings obtained from the training group, patients in the high risk score group had shorter overall survival time than patients in the low risk score group [43.8 months vs 51.9 months; HR(95%CI) =1.61(1.16-2.25); log-rank P value=0.004] (Figure 2C). Similarly, there was no significance in progression-free survival between the two groups [15.4 months vs 16.1 months; HR (95%CI) =1.11 (0.87-1.47); log-rank P value=0.463] (Figure 2D).
Prognostic values of three-gene signature for patients with different therapeutic response in validation group
To further explore the prognostic values of three-gene signature for the platinum sensitive and resistant patients, we picked up platinum sensitive patients (n = 161) and resistant patients (n = 69) from the validation group and conducted Kaplan-Meier curves separately. Interestingly, we found that the three-gene signature had a high accuracy to predict overall survival only in the platinum sensitive patients [HR (95%CI) =2.08 (1.35-3.22); log-rank P value=0.001] (Figure 3A). There was no significant association between three-gene signature and overall survival in platinum resistant patients [HR (95%CI) =1.04 (0.62-1.75), log-rank P value=0.883] (Figure 3B). In addition, three-gene signature was found to be insignificantly associated with progression-free survival both in the platinum sensitive (Figure 3C) and platinum resistant patients (Figure 3D).
Figure 3.
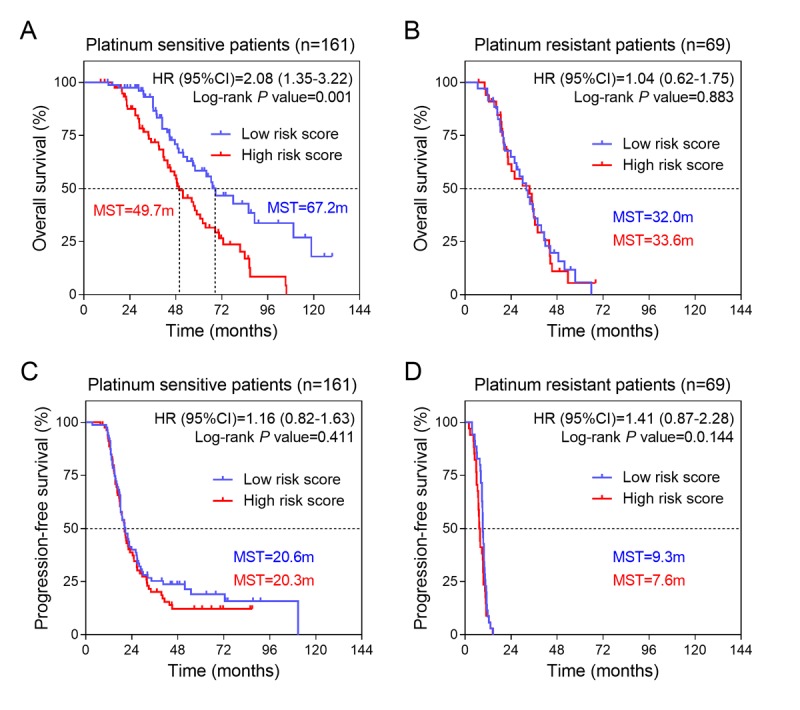
Kaplan-Meier estimates of the survival of patients with different platinum response in training group. (A) Kaplan-Meier survival curves were plotted to estimate the overall survival for platinum sensitive patients in validation group (n=161). (B) Kaplan-Meier survival curves were plotted to estimate the overall survival for platinum resistant patients in validation group (n=69). Progression-free survival was estimated by Kaplan-Meier curves for (C) platinum sensitive and (D) platinum resistant patients in training group.
Subgroup analysis of three-gene expression signature in predicting overall survival of platinum-sensitive patients
To explore the impacts of clinical risk factors on the prognostic values of three-gene expression signature, a set of predefined subgroup analysis was conducted. We stratified the platinum sensitive patients from the validation group (n=161) by four risk factors, including age, residual disease, pathological grade and tumor stage (Table 2). Kaplan-Meier curves were conducted to visualize the survival probabilities for the low risk score versus high risk score group. We found that overall survival time of low risk score group was longer than high risk score group in patients with elder age [HR(95%CI) =2.39 (1.21-4.70); log-rank P value=0.006], high pathological grade [HR(95%CI) =2.06 (1.25-3.37); log-rank P value=0.002] and advanced FIGO stage [HR(95%CI) =1.65 (1.01-2.72) for stage III and HR(95%CI) =3.87 (1.46-10.3) for stage IV; all log-rank P value <0.05) (Figure 4A-H). In addition, we found the association between three-gene signature and overall survival was not affected by residual disease status (Figure 4C and 4D).
Table 2. Stratified analysis on the association between three-mRNA signature and OS of platinum-sensitive ovarian cancer patients in validating group.
| Variables | Total number | High risk score | Low risk score | HR (95%CI) | P value | |||
|---|---|---|---|---|---|---|---|---|
| Case number | MST (month) |
Case number | MST (month) |
|||||
| Overall | 161 | 81 | 49.7 | 80 | 67.2 | 2.08 (1.35-3.22) | 0.001 | |
| Age (years) | ||||||||
| < 60 | 90 | 46 | 49.7 | 44 | 63.8 | 1.59 (0.90-2.82) | 0.112 | |
| ≥ 60 | 71 | 35 | 43.8 | 36 | 85.9 | 2.39 (1.21-4.70) | 0.006 | |
| Residual Disease | ||||||||
| Macrospcopic disease ≤1cm | 108 | 51 | 48.6 | 57 | 63.8 | 1.81 (1.08-3.34) | 0.021 | |
| Macrospcopic disease >1cm | 39 | 21 | 57.2 | 18 | 85.9 | 2.65 (1.12-6.29) | 0.024 | |
| Pathological grade | ||||||||
| 2 | 25 | 16 | 60.7 | 9 | 85.9 | 2.23 (0.69-7.25) | 0.262 | |
| 3 | 133 | 64 | 48.8 | 69 | 66.5 | 2.06 (1.25-3.37) | 0.002 | |
| FIGO stage, no (%) | ||||||||
| III | 128 | 63 | 51.8 | 65 | 63.8 | 1.65 (1.01-2.72) | 0.043 | |
| IV | 24 | 12 | 45.6 | 12 | 89.1 | 3.87 (1.46-10.3) | 0.004 | |
Figure 4.
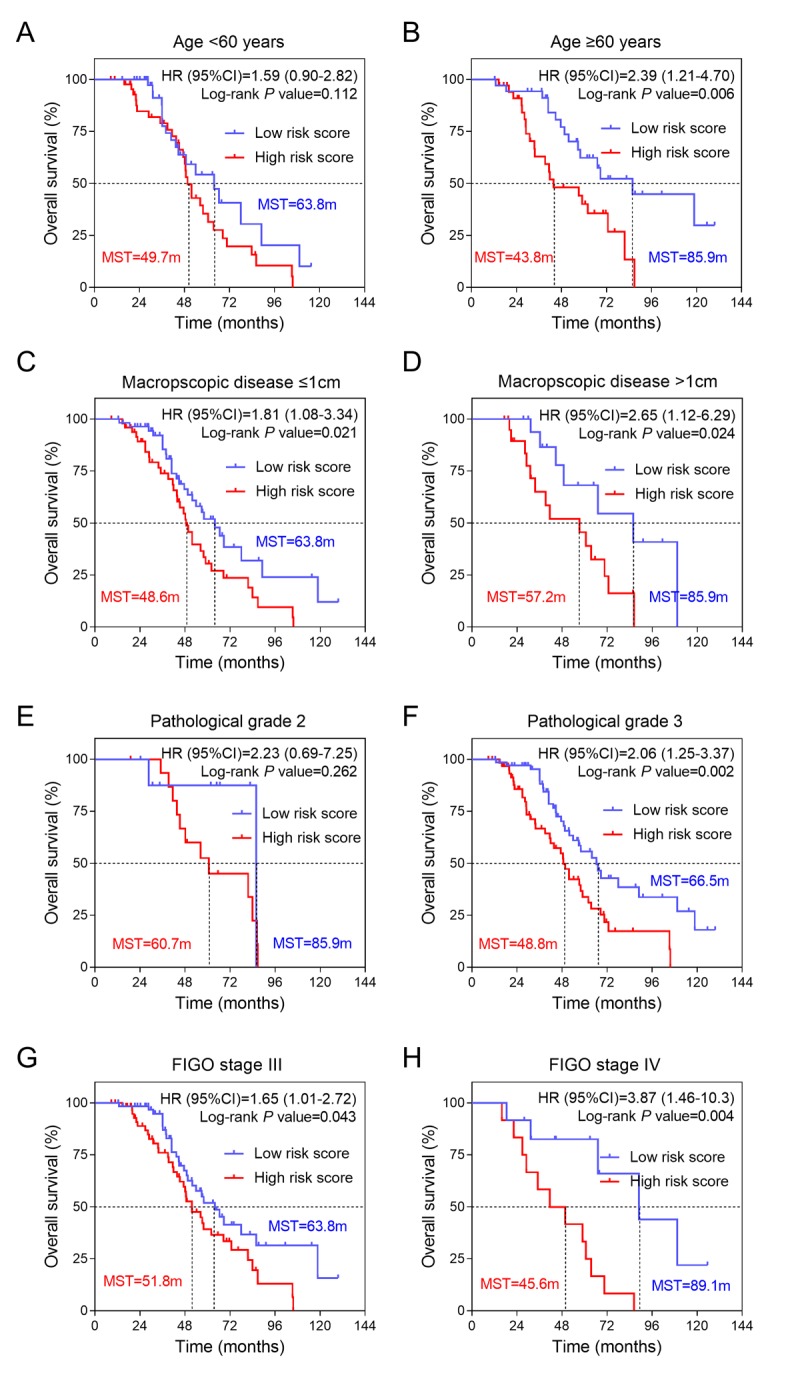
Effects of SAMR1 and SAMP8 mice fecal microbiota transplant on behavior in pseudo germ-free mice. (A) Kaplan-Meier curves for younger patients (age<60 years). (B) Kaplan-Meier curves for older patients (age≥60 years). (C) Kaplan-Meier curves for patients with macroscopic disease ≤1cm. (D) Kaplan-Meier curves for patients with macroscopic disease >1cm. (E) Kaplan-Meier curves for patients with pathological grade 2. (F) Kaplan-Meier curves for patients with pathological grade 3. (G) Kaplan-Meier curves for patients with FIGO stage III. (H) Kaplan-Meier curves for patients with FIGO stage IV. FIGO, International Federation of Gynecology and Obstetrics.
Prediction of the three-gene signature associated biological pathways
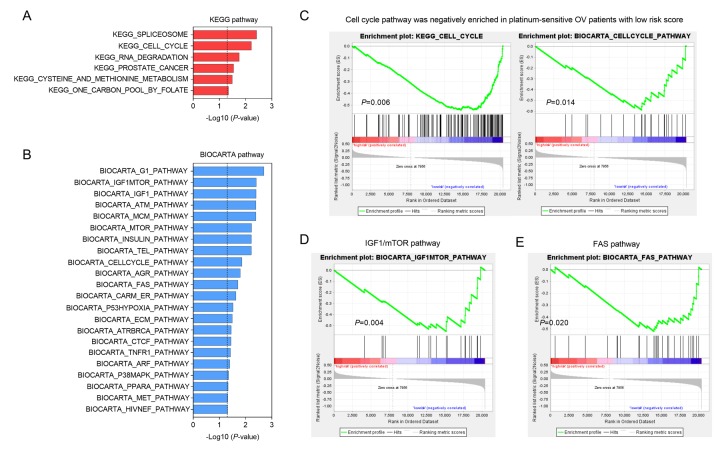
To explore the biological processes and signaling pathways affected by the three-gene signature, we compared the genome-wide gene expression profile between high and low risk score groups in platinum sensitive patients by using GSEA. The significant KEGG and BIOCARTA gene sets were visualized as histogram bar charts. Six KEGG pathways and twenty-two BIOCARTA pathways were predicted to be correlated with three-gene signature (Figure 5A and 5B). Cell cycle pathway stood out in both of two gene sets, suggesting that the low risk score accompanied with down-regulation of cell cycle pathway (Figure 5C). In addition, two important signaling pathways,
Figure 5.
GSEA delineates biological pathways associated with risk score in the validation group. Significantly enriched KEGG pathways (A) and BIOCARTA pathways (B) of the co-expressed genes with three oxidative stress-related genes. GSEA validated downregulated activity of (C) cell cycle, (D) IGF1/mTOR and (E) Fas pathways in low risk score group.
IGF1/mTOR and Fas pathways, were also shown to be negatively enriched in platinum sensitive ovarian cancer patients with low risk score (Figure 5D and 5E). Above findings provided evidence for molecular mechanisms affected by three-gene signature in ovarian cancer patients received platinum-based chemotherapy.
DISCUSSION
Ovarian cancer is the most common cancer with highest mortality rate among gynecologic cancers. Therefore, it is urgent to explore new prognostic biomarkers to predict the survival for patients with ovarian cancer. In this study, we firstly constructed a prognostic model consisting of a panel of three oxidative stress-related genes for ovarian cancer patients received platinum-based chemotherapy. Next, we evaluated the prognostic values of the three-gene signature in an independent group, and found that our risk model had high prognostic values in platinum sensitive patients. Finally, bioinformatic analysis suggested that the patients with low risk score was accompanied with down-regulation of cell cycle, IGF1/mTOR and Fas pathways.
For decades, researchers have found that oxidative stress-related genes are involved in cancer progression and therapeutic response. In ovarian cancer, genome-wide investigation also revealed that amount of oxidative stress-related genes were implicated in the carcinogenesis. Kajihara et al summarized the 54 highly up-regulated genes in ovarian cancer, and found 47 (87%) of them were redox-related genes, including oxidative and detoxification enzymes [16]. In the present study, we, for the first time, identified a panel of three oxidative stress-related genes, including TXNRD1, GLA and GSTZ1, to predict overall survival for ovarian cancer patients. These findings provide evidence for conducting a panel of oxidative stress-related genes as prognostic biomarkers in ovarian cancer.
TXNRD1, as a key regulation factor in oxidative stress control, was found to be associated with poor prognosis in breast cancer patients [17]. Saener Y et al identified four genes, including TXNRD1, were associated with clinical outcomes in patients treated with tremelimumab [18]. Recently, TXNRD1 was found to be a risk factor for patients with hepatocellular carcinoma [19]. However, the prognostic value of TXNRD1 in ovarian cancer has not yet been investigated. In our prognostic model, we identified TXNRD1 as a risk factor for ovarian cancer patients. Moreover, we also found the patients with high risk scores had increased TXNRD1 expression, consistent with the findings in other cancer types.
Glutathione S-transferases (GSTs) are a family of phase II isoenzymes that detoxify toxicant to lower toxic [20] and its dysfunction has been found to be closely related with response to chemotherapy [21–23]. GSTZ1 belongs to the zeta class of GSTs, and patients carrying GSTZ1 variants had an increased risk of bladder cancer when exposed to trihalomethanes, a potential human carcinogen [24]. Mechanistic investigation suggested high levels of GSTZ1 expression conferred resistance to the effect of anti-cancer therapy of dichloroacetate in hepatocellular carcinoma cell lines. In this study, we found GSTZ1 might act as a protective factor in ovarian cancer, suggesting that altered GSTZ1 expression level might have impact on survival by affecting the toxic of chemotherapy.
Moreover, in this study, we also found that several cancer-related pathways, such as cell cycle, IGF1/mTOR and Fas pathways, were related to three-gene signature. Cell cycle is a well-known critical factor that affects tumor progression. Many cell cycle regulators function as oncogenes that control proliferative and survival activities in chemo-response of ovarian cancer [7]. Our findings suggested that low risk score accompanied with down-regulation of cell cycle pathway, consistent with above knowledge. Moreover, we also found downregulation of IGF1/mTOR and Fas pathways in low risk score group. It has been have clearly demonstrated that IGF1/mTOR pathway took part in promoting cell proliferation [25] and affecting chemo-response [9,26] in ovarian cancer. Additionally, Fas protein was considered as a key factor mediating cell cycle and chemotherapy sensitivity [27]. These results implied important functional roles of the three-green signature in tumor progression and chemo-response of ovarian cancer patients.
In summary, using two independent cohorts and genome-wide gene expression profile, we systemically investigated the prognostic values of oxidative-stress related genes in ovarian cancer. We constructed a three-gene prognostic signature consisting of TXNRD1, GLA and GSTZ1 which was associated with overall survival for ovarian cancer patients received platinum-based chemotherapy, especially in those with elder age, high pathological grade and advanced tumor stage. Further investigations are warranted to validate our findings.
MATERIALS AND METHODS
Sources of ovarian cancer patients
Two independent cohorts, AOCS (Australian Ovarian Cancer Study) and TCGA-OV (The Cancer Genome Atlas - Ovarian Cancer), were used in this study. The gene expression data of AOCS cohort (GSE9891) was downloaded from the Gene Expression Omnibus (GEO, http://www.ncbi.nlm.nih.gov/geo). GSE9891 consisted of 285 ovarian cancer samples and was performed on the Affymetrix Human Genome U133 Plus 2.0 platform. The gene expression data of TCGA-OV cohort was downloaded from the cBioPortal (http://www.cbioportal.org). TCGA-OV cohort consisted of 230 samples and was performed on the Illumina RNA-sequencing platform. All analyses were firstly conducted using the training dataset (GSE9891) and then validated using the validation dataset (TCGA-OV). Clinical characteristics of patients in the training and validation datasets were summarized in Table 3.
Table 3. Clinical features of ovarian cancer patients in the training and validating groups.
| Features |
Training group (n=276) |
Validating group (n=230) |
|---|---|---|
| Age (years), (Mean±SD) | 59.7±0.6 | 59.9±0.7 |
| Residual Disease, no (%) | ||
| No macropscopic disease | 82 (29.7) | 43 (18.7) |
| Macrospcopic disease ≤1cm | 76 (27.5) | 115 (50.0) |
| Macrospcopic disease >1cm | 66 (23.9) | 56 (24.3) |
| Unknown | 52 (18.8) | 16 (7.0) |
| Pathological grade, no (%) | ||
| 1 | 19 (6.9) | 0 (0) |
| 2 | 94 (34.1) | 32 (13.9) |
| 3 | 160 (58.0) | 194 (84.3) |
| Unknown | 3 (1.1) | 4 (1.7) |
| FIGO stage, no (%) | ||
| I+II | 41 (14.9) | 10 (4.3) |
| III | 212 (76.8) | 189 (82.2) |
| IV | 22 (8.0) | 31 (13.5) |
| Unknown | 1 (0.4) | 0 (0) |
| Progression status, no (%) | ||
| Progression | 33 (12.0) | 197 (85.7) |
| Progression -free | 106 (38.4) | 33 (14.3) |
| Unknown | 137 (49.6) | 0 (0) |
| Vital status, no (%) | ||
| Death | 113 (40.9) | 140 (60.9) |
| Alive | 163 (59.1) | 90 (39.1) |
Construction of prognostic signature
We screened the gene expression profile with the corresponding clinical data, and filtered out samples without clinical survival information. The therapeutic response to platinum was defined according to Liu’s method [15]. In brief, platinum-resistance was defined if tumor progress or recurrence within 6 months, and platinum-sensitivity was defined if the progression-free survival was more than 6 months. We then created the prognostic model, a risk-score formula, according to the expressions of candidate genes for survival prediction. Three oxidative stress-related genes, which were significantly and consistently associated with patients’ survival, were selected. Every patient was then accumulated a risk score that is a linear combination of the expression levels of the significant three genes weighted by their respective Cox regression coefficients. The risk score was calculated as follows: Risk score = (-0.38× expression value of GLA) + (-0.36 × expression value of GSTZ1) + (0.46 × expression value of TXNRD1).
Survival analysis
Based on this risk score formula, patients in the training group were divided into low-risk and high-risk groups using the median value. The Kaplan-Meier curves were conducted to estimate survival time for the training and validation groups. Differences in median survival time (MST) between the low-risk and high-risk groups were then compared using the two-sided log rank test. Hazard ratio (HR) and 95% confidence intervals (CI) were calculated by Cox proportional hazards regression model.
Gene set enrichment analysis (GSEA)
GSEA java software was downloaded from http://www.broadinstitute.org/gsea and analyzed using MSigDB C2 CP: BioCarta gene sets (217 gene sets available) and KEGG gene sets (186 gene sets available). Gene set with a P-value less than 0.05 was considered to be significantly enriched. Histogram bar charts and enrichment plots were used for visualization of the GSEA results.
Statistical analysis
All data management and statistical analyses in the present study were conducted using R software with related packages (www.rproject.org). Categorical data was analyzed by Fisher’s exact test. The significance was defined as P values being less than 0.05.
Supplementary Material
Footnotes
CONFLICTS OF INTEREST: None of the authors have any conflict of interest to disclose.
FUNDING: This work was supported by Natural Science Basic Research Plan in Shaanxi Province of China (No. 2017JM8039); Fundamental Research Fund for the Central Universities (No. 2016qngz05); the Clinical Research Award of the First Affiliated Hospital of Xi'an Jiaotong University, China (No. XJTU1AF-CRF-2015-011).
REFERENCES
- 1.Jayson GC, Kohn EC, Kitchener HC, Ledermann JA. Ovarian cancer. Lancet. 2014; 384:1376–88. 10.1016/S0140-6736(13)62146-7 [DOI] [PubMed] [Google Scholar]
- 2.Torre LA, Bray F, Siegel RL, Ferlay J, Lortet-Tieulent J, Jemal A. Global cancer statistics, 2012. CA Cancer J Clin. 2015; 65:87–108. 10.3322/caac.21262 [DOI] [PubMed] [Google Scholar]
- 3.Weberpals JI, Koti M, Squire JA. Targeting genetic and epigenetic alterations in the treatment of serous ovarian cancer. Cancer Genet. 2011; 204:525–35. 10.1016/j.cancergen.2011.09.004 [DOI] [PubMed] [Google Scholar]
- 4.Bian C, Yao K, Li L, Yi T, Zhao X. Primary debulking surgery vs. neoadjuvant chemotherapy followed by interval debulking surgery for patients with advanced ovarian cancer. Arch Gynecol Obstet. 2016; 293:163–68. 10.1007/s00404-015-3813-z [DOI] [PubMed] [Google Scholar]
- 5.Liu R, Lu S, Deng Y, Yang S, He S, Cai J, Qiang F, Chen C, Zhang W, Zhao S, Qian L, Mao G, Wang Y. PSMB4 expression associates with epithelial ovarian cancer growth and poor prognosis. Arch Gynecol Obstet. 2016; 293:1297–307. 10.1007/s00404-015-3904-x [DOI] [PubMed] [Google Scholar]
- 6.Nagaraj AB, Joseph P, DiFeo A. miRNAs as prognostic and therapeutic tools in epithelial ovarian cancer. Biomarkers Med. 2015; 9:241–57. 10.2217/bmm.14.108 [DOI] [PubMed] [Google Scholar]
- 7.Huang KC, Yang J, Ng MC, Ng SK, Welch WR, Muto MG, Berkowitz RS, Ng SW. Cyclin A1 expression and paclitaxel resistance in human ovarian cancer cells. Eur J Cancer. 2016; 67:152–63. 10.1016/j.ejca.2016.08.007 [DOI] [PMC free article] [PubMed] [Google Scholar]
- 8.Miller DS, Blessing JA, Krasner CN, Mannel RS, Hanjani P, Pearl ML, Waggoner SE, Boardman CH. Phase II evaluation of pemetrexed in the treatment of recurrent or persistent platinum-resistant ovarian or primary peritoneal carcinoma: a study of the Gynecologic Oncology Group. J Clin Oncol. 2009; 27:2686–91. 10.1200/JCO.2008.19.2963 [DOI] [PMC free article] [PubMed] [Google Scholar]
- 9.Koti M, Gooding RJ, Nuin P, Haslehurst A, Crane C, Weberpals J, Childs T, Bryson P, Dharsee M, Evans K, Feilotter HE, Park PC, Squire JA. Identification of the IGF1/PI3K/NF κB/ERK gene signalling networks associated with chemotherapy resistance and treatment response in high-grade serous epithelial ovarian cancer. BMC Cancer. 2013; 13:549. 10.1186/1471-2407-13-549 [DOI] [PMC free article] [PubMed] [Google Scholar]
- 10.May T, Stewart JM, Bernardini MQ, Ferguson SE, Laframboise S, Jiang H, Rosen B. The prognostic value of perioperative, pre-systemic therapy CA125 levels in patients with high-grade serous ovarian cancer. Int J Gynaecol Obstet. 2018; 140:247–52. 10.1002/ijgo.12376 [DOI] [PubMed] [Google Scholar]
- 11.Conklin KA. Chemotherapy-associated oxidative stress: impact on chemotherapeutic effectiveness. Integr Cancer Ther. 2004; 3:294–300. 10.1177/1534735404270335 [DOI] [PubMed] [Google Scholar]
- 12.Miyata Y, Matsuo T, Sagara Y, Ohba K, Ohyama K, Sakai H. A mini-review of reactive oxygen species in urological cancer: correlation with NADPH oxidases, angiogenesis, and apoptosis. Int J Mol Sci. 2017; 18:E2214. 10.3390/ijms18102214 [DOI] [PMC free article] [PubMed] [Google Scholar]
- 13.Maiti AK. Gene network analysis of oxidative stress-mediated drug sensitivity in resistant ovarian carcinoma cells. Pharmacogenomics J. 2010; 10:94–104. 10.1038/tpj.2009.49 [DOI] [PubMed] [Google Scholar]
- 14.Park YT, Jeong JY, Lee MJ, Kim KI, Kim TH, Kwon YD, Lee C, Kim OJ, An HJ. MicroRNAs overexpressed in ovarian ALDH1-positive cells are associated with chemoresistance. J Ovarian Res. 2013; 6:18. 10.1186/1757-2215-6-18 [DOI] [PMC free article] [PubMed] [Google Scholar]
- 15.Liu R, Zeng Y, Zhou CF, Wang Y, Li X, Liu ZQ, Chen XP, Zhang W, Zhou HH. Long noncoding RNA expression signature to predict platinum-based chemotherapeutic sensitivity of ovarian cancer patients. Sci Rep. 2017; 7:18. 10.1038/s41598-017-00050-w [DOI] [PMC free article] [PubMed] [Google Scholar]
- 16.Kajihara H, Yamada Y, Kanayama S, Furukawa N, Noguchi T, Haruta S, Yoshida S, Sado T, Oi H, Kobayashi H. Clear cell carcinoma of the ovary: potential pathogenic mechanisms (Review). Oncol Rep. 2010; 23:1193–203. Review [DOI] [PubMed] [Google Scholar]
- 17.Jamil K, Mustafa SM. Thioredoxin system: a model for determining novel lead molecules for breast cancer chemotherapy. Avicenna J Med Biotechnol. 2012; 4:121–30. [PMC free article] [PubMed] [Google Scholar]
- 18.Saenger Y, Magidson J, Liaw B, de Moll E, Harcharik S, Fu Y, Wassmann K, Fisher D, Kirkwood J, Oh WK, Friedlander P. Blood mRNA expression profiling predicts survival in patients treated with tremelimumab. Clin Cancer Res. 2014; 20:3310–18. 10.1158/1078-0432.CCR-13-2906 [DOI] [PubMed] [Google Scholar]
- 19.Fu B, Meng W, Zeng X, Zhao H, Liu W, Zhang T. TXNRD1 is an unfavorable prognostic factor for patients with hepatocellular carcinoma. BioMed Res Int. 2017; 2017:4698167. 10.1155/2017/4698167 [DOI] [PMC free article] [PubMed] [Google Scholar]
- 20.Chasseaud LF. The role of glutathione and glutathione S-transferases in the metabolism of chemical carcinogens and other electrophilic agents. Adv Cancer Res. 1979; 29:175–274. 10.1016/S0065-230X(08)60848-9 [DOI] [PubMed] [Google Scholar]
- 21.Lee WH, Morton RA, Epstein JI, Brooks JD, Campbell PA, Bova GS, Hsieh WS, Isaacs WB, Nelson WG. Cytidine methylation of regulatory sequences near the pi-class glutathione S-transferase gene accompanies human prostatic carcinogenesis. Proc Natl Acad Sci USA. 1994; 91:11733–37. 10.1073/pnas.91.24.11733 [DOI] [PMC free article] [PubMed] [Google Scholar]
- 22.Niu D, Zhang J, Ren Y, Feng H, Chen WN. HBx genotype D represses GSTP1 expression and increases the oxidative level and apoptosis in HepG2 cells. Mol Oncol. 2009; 3:67–76. 10.1016/j.molonc.2008.10.002 [DOI] [PMC free article] [PubMed] [Google Scholar]
- 23.Zhang YJ, Chen Y, Ahsan H, Lunn RM, Chen SY, Lee PH, Chen CJ, Santella RM. Silencing of glutathione S-transferase P1 by promoter hypermethylation and its relationship to environmental chemical carcinogens in hepatocellular carcinoma. Cancer Lett. 2005; 221:135–43. 10.1016/j.canlet.2004.08.028 [DOI] [PubMed] [Google Scholar]
- 24.Cantor KP, Villanueva CM, Silverman DT, Figueroa JD, Real FX, Garcia-Closas M, Malats N, Chanock S, Yeager M, Tardon A, Garcia-Closas R, Serra C, Carrato A, et al. Polymorphisms in GSTT1, GSTZ1, and CYP2E1, disinfection by-products, and risk of bladder cancer in Spain. Environ Health Perspect. 2010; 118:1545–50. 10.1289/ehp.1002206 [DOI] [PMC free article] [PubMed] [Google Scholar]
- 25.Lau MT, Leung PC. The PI3K/Akt/mTOR signaling pathway mediates insulin-like growth factor 1-induced E-cadherin down-regulation and cell proliferation in ovarian cancer cells. Cancer Lett. 2012; 326:191–98. 10.1016/j.canlet.2012.08.016 [DOI] [PubMed] [Google Scholar]
- 26.Eckstein N, Servan K, Hildebrandt B, Pölitz A, von Jonquières G, Wolf-Kümmeth S, Napierski I, Hamacher A, Kassack MU, Budczies J, Beier M, Dietel M, Royer-Pokora B, et al. Hyperactivation of the insulin-like growth factor receptor I signaling pathway is an essential event for cisplatin resistance of ovarian cancer cells. Cancer Res. 2009; 69:2996–3003. 10.1158/0008-5472.CAN-08-3153 [DOI] [PubMed] [Google Scholar]
- 27.Radin D, Lippa A, Patel P, Leonardi D. Lifeguard inhibition of Fas-mediated apoptosis: A possible mechanism for explaining the cisplatin resistance of triple-negative breast cancer cells. Biomed Pharmacother. 2016; 77:161–66. 10.1016/j.biopha.2015.12.022 [DOI] [PubMed] [Google Scholar]
Associated Data
This section collects any data citations, data availability statements, or supplementary materials included in this article.


