

Summary
Increased androgen receptor (AR) activity drives therapeutic resistance in advanced prostate cancer. The most common resistance mechanism is amplification of this locus presumably targeting the AR gene. Here, we identify and characterize a somatically acquired AR enhancer located 650 kilobases centromeric to the AR. Systematic perturbation of this enhancer using genome editing decreased proliferation by suppressing AR levels. Insertion of an additional copy of this region sufficed to increase proliferation under low androgen conditions and to decrease sensitivity to enzalutamide. Epigenetic data generated in localized prostate tumors and benign specimens support the notion that this region is a developmental enhancer. Collectively, these observations underscore the importance of epigenomic profiling in primary specimens and the value of deploying genome editing to functionally characterize noncoding elements. More broadly, this work identifies a therapeutic vulnerability for targeting the AR and emphasizes the importance of regulatory elements as highly recurrent oncogenic drivers.
In Brief
Activation and amplification of an enhancer upstream of the androgen receptor locus drives progression of metastatic castration-resistant prostate cancer.
Introduction
For over 75 years, the AR axis has remained the primary therapeutic target in advanced prostate cancer. The AR is a transcription factor (TF) that upon androgen binding, translocates to the nucleus, binds to specific genomic locations, and ultimately results in stimulation or repression of target genes. The cornerstone of prostate cancer treatment, androgen deprivation therapy (ADT), usually involves ablation of androgen synthesis through chemical castration and may be combined with antiandrogens to further suppress AR signaling.
Despite castrate levels of circulating androgens, tumors progress to a lethal state referred to as castration resistant prostate cancer (CRPC). Notably, the majority of these tumors continue to depend on AR signaling by adapting to decreased circulating androgens. The most common mechanism of resistance, amplification of the AR locus, occurs in about 50% of men with CRPC (Robinson et al., 2015; Visakorpi et al., 1995). The presumed target of this amplicon is the AR gene. Prior functional data showed that modest increases in AR mRNA and protein levels were found to be both necessary and sufficient to convert prostate cancer growth from a hormone-sensitive to a hormone-refractory stage (Chen et al., 2004). Thus, modest increases in AR levels can drive a castration resistant phenotype.
Recurrent alterations in tumors provide prima facie evidence that a region is under selective pressure. Most studies have adopted a gene-centric focus when evaluating somatically acquired alterations. More recently, studies have started to examine recurrent alterations in the noncoding genome. One of the first reports to describe mutations in a gene regulatory region was for the TERT promoter in melanomas (Horn et al., 2013; Huang et al., 2013). Enhancer mutations have also been identified and lead to gene expression activation through three general mechanisms (Sur and Taipale, 2016), copy number gain of enhancer regions (Herranz et al., 2014; Zhang et al., 2017; Zhang et al., 2016), structural rearrangements leading to ‘enhancer hijacking’ of a target gene (Northcott et al., 2014; Weischenfeldt et al., 2017), and somatically acquired mutations that create or alter transcription factor binding sites (Mansour et al., 2014; Puente et al., 2015). Notably, the enhancer drivers discovered to date tend to account for fewer than 10% of cases.
Enhancers can be characterized as to their state and to the target gene(s) they regulate. The histone code hypothesis has spurred the development of using post-translational histone modifications to characterize the epigenome (Strahl and Allis, 2000). Chromatin immunoprecipitation followed by high-throughput sequencing (ChIP-seq) of post-translational histone modifications have been used extensively to annotate regulatory elements that correlate with function (Heintzman et al., 2007; Wang et al., 2008). For example, H3K27ac ChIP-seq is often used to annotate active enhancers and promoters (Creyghton et al., 2010). Large catalogs of regulatory elements across many tissues and cell types have been generated and are publicly available (2012; Kundaje et al., 2015). In addition, studies have demonstrated that the cistrome undergoes reprogramming during cancer pathogenesis and progression (Akhtar-Zaidi et al., 2012; Pomerantz et al., 2015; Ross-Innes et al., 2012; Wang et al., 2009).
Results
A highly recurrent amplicon encompasses an intergenic regulatory element that interacts with the AR gene in CRPC
Advanced prostate cancer initially responds to antiandrogen therapy, however development of resistance portends progression to CRPC. Re-evaluation of copy number from 149 tumors derived from 60 men with CRPC revealed an expected peak at the AR gene (Kumar et al., 2016). Interestingly, a second peak approximately 650 kb centromeric to the gene was observed (Figure 1A and Figure S1A). This peak coincided with DNaseI hypersensitivity peaks (DHS) that were present in the LNCaP prostate cancer cell line (Figure 1B) (2012). Notably, the DHS signal is highly cell type restricted; it is present in the LNCaP prostate cell line, but notably absent in 103 other cell lines (Figure S1B). In an independent, higher resolution whole genome sequencing-based dataset of metastatic CRPC tumors, amplification of this candidate regulatory region was observed in 20 out of 23 (87%) cases and was amplified in only 1 out of 57 primary localized tumors. Remarkably, the region harboring the LNCaP DHS was selectively amplified over the AR gene body in 4/23 (17%) of cases (Viswanathan et al., 2018). The data suggest that this region contains a putative regulatory element and is under selective pressure in response to antiandrogens.
Figure 1. A highly recurrent amplicon encompasses an intergenic regulatory element that interacts with the AR gene in CRPC.

(A) Cumulative copy number profile as determined from SNP array data from 149 CRPC tumors identify a distinct amplified region (dashed red line) approximately 650 kb centromeric to the AR gene body (demarcated by green lines).
(B) DNaseI hypersensitivity data from the LNCaP prostate cancer cell line showing copy number gain overlapping with regions of open chromatin.
(C) Chromosome conformation capture (3C) experiment performed in the LNCaP prostate cancer cell line reveals interaction between the candidate regulatory region and the AR promoter. The AR promoter was used as bait (dashed line at AR promoter). Each interaction frequency between the bait and candidate region was measured by quantitative PCR in triplicate. All interactions were normalized to a BAC control spanning this region. Error bars represent the standard error of measurement.
See also Figure S1.
To assess if this candidate regulatory region interacted with the AR promoter, we performed high resolution 3C on the LNCaP cell line (Figure 1C). We further note that this interaction takes place within two conserved CTCF binding sites across multiple cell types, a feature which demarcates topologically associating domains (Figure S1C) (Dixon et al., 2012).
The AR candidate enhancer becomes histone acetylated in CRPC tumors
To annotate active enhancers and promoters across the prostate genome, we performed chromatin immunoprecipitation followed by high-throughput sequencing (ChIP-seq) for the histone post-translational modification mark, H3K27ac, in primary prostate specimens (n=6 localized tumors; n=4 CRPC metastases). We identified a somatically acquired signal 650 kb centromeric to the AR gene that was present in the CRPC samples but not in the untreated localized tumor samples (Figure 2). This 9 kilobase acetylated region was coincident with LNCaP DHS mentioned above. This region is acetylated in the AR-positive prostate cancer cell lines (LNCaP, 22Rv1, and VCaP), but is not acetylated in the AR-negative PC3 cell line (Figure 2).
Figure 2. The AR candidate enhancer becomes acetylated in metastatic CRPC tumors.

Tracks depict H3K27ac as determined by ChIP-seq in tumor samples (n=6 localized tumors; T1–T6 and n=4 metastatic CRPC tumors; M1–M4), AR positive prostate cancer cell lines (22Rv1, VCaP, LNCaP), AR negative prostate cancer cell line (PC3), and DNaseI hypersensitivity in the LNCaP cell line. H3K27ac signal is observed at the AR promoter in all tumor samples (top), but at the enhancer region only in the metastatic CRPC samples. The enhancer region is comprised of three distinct DHS peaks.
The AR enhancer is essential for cell viability in the LNCaP metastatic prostate cancer cell line
To evaluate the functional consequences of this candidate AR enhancer, we performed Clustered Regularly Interspaced Short Palindromic Repeats (CRISPR)-based pooled screens to interrogate this region. We conducted both a CRISPR associated protein 9 (Cas9) nuclease screen to create small insertions and deletions (indels) and an epigenetic screen to suppress the region using a nuclease dead-Cas9 (dCas9) protein conjugated to the Kruppel associated box (KRAB) transcriptional repressor (Figure 3A) (Gilbert et al., 2013). We designed a high-density set of 878 guide RNAs (gRNAs) that spanned this 9 kb region as well as a set of positive and negative control gRNAs. This pool was cloned and transduced into LNCaP prostate cancer cell lines stably expressing either the Cas9 or the KRAB-dCas9 constructs (Methods). After allowing integration of the introduced constructs and cell proliferation, gRNA abundance was measured at the late time points and compared to earlier time points. Over time, gRNAs targeting the functionally relevant regions of the enhancer were expected to be depleted since the LNCaP cell line is AR dependent. A sliding window analysis for both screens revealed that the top-scoring gRNAs overlapped strongly with the three DHS LNCaP sites (Methods and Figure 3B).
Figure 3. The AR enhancer is essential for cell viability in the LNCaP metastatic prostate cancer cell line.

(A) Design of pooled CRISPR screens to identify noncoding regions required for proliferation of LNCaP cells.
(B) Results of pooled CRISPR screens depicted as sliding window of average –Z-scores of adjacent gRNAs. The positions of the individual gRNAs in the library and LNCaP DNAseI hypersensitivity data from ENCODE are shown.
(C) Proliferation of LNCaP cells as measured by cell counting (left) and expression of AR as measured by qRT-PCR (right) after transduction of KRAB-dCas9 and indicated gRNAs. Positions of gRNAs targeting the 9 kb enhancer region are depicted relative to screen results (top). F indicates gRNA designed against the forward strand and R indicates reverse strand.
(D) Proliferation of LNCaP cells and LNCaP cells overexpressing exogenous AR (LNCaP-AR) as measured by cell counting after transduction with KRAB-dCas9 and indicated gRNAs.
For (C) and (D) transduction of gRNA targeting the unrelated gene HPRT1, and nontargeting gRNA (NT) were used as controls. Expression is normalized to nontargeting gRNA. Data represent the average and standard deviation of 3 biological replicates, and significance determined by Student’s t test. * p = 0.011, ** p< 0.01.
See also Figure S2.
The top scoring gRNAs, which were located in the second DHS peak, were independently validated by assessing their effect on multiple cellular phenotypes. The gRNAs significantly suppressed AR levels and proliferation compared to control gRNAs (Figure 3C, Figure S2A–C). We confirmed that recruitment of KRABdCas9 to the enhancer significantly decreased H3K27ac levels by ChIP-qPCR (Figure S2D). Since the AR influences many target genes, we evaluated the effect of enhancer suppression on these AR-responsive transcripts. Target gene transcript levels demonstrated alterations consistent with their known effect after AR gene suppression (Figure S2E). Next, we inhibited the AR enhancer in a cell line that exogenously expressed a tagged version of AR. The effects on proliferation and gene expression that were observed during enhancer suppression were rescued by the forced expression of AR, consistent with the phenotypes being mediated through the AR (Figure 3D, Figure S2F–G).
AR enhancer allelic knock-in confers a castration resistant state
To more faithfully model what is observed in advanced prostate cancer clinical specimens, we created a cell line carrying an additional copy of the enhancer using a homology directed repair (HDR) strategy. A repair template containing the AR enhancer was co-transfected with CRISPR-Cas9 and a gRNA to create a double strand break 4 kb telomeric to the native enhancer in the LNCaP cell line (Figure 4A and Methods). Three independent clones carrying one extra copy of the enhancer were identified. Each one of the clones expressed higher AR mRNA and protein levels (Figures 4B and 4C). In addition, H3K27ac signal was significantly increased in the enhancer duplicated cells compared to the parental cells (Figure S3). Strikingly, compared to three control cell lines, the clones carrying the extra enhancer revealed increased proliferation rates at low androgen doses (Figure 4D). These results phenocopy what is observed in LNCaP cells overexpressing the AR gene, an established model for CRPC (Chen et al., 2004). To evaluate the response to enzalutamide, a direct AR antagonist used in the clinic to treat men with CRPC, we treated the clones with increasing doses of enzalutamide. Notably, all of the clones demonstrated significantly decreased sensitivity compared to the controls (Figure 4E).
Figure 4. AR enhancer knock-in confers a castration resistant state.

(A) Genome editing strategy to engineer duplication of AR enhancer. The 9kb enhancer region is inserted approximately 4 kb telomeric to the endogenous enhancer by CRISPR-Cas9 mediated homologous recombination. PCR using indicated primers confirmed correctly positioned enhancer in 3 independent clones (ARenh_1–3). Red triangles indicate LoxP sites.
(B) AR expression as measured by qRT-PCR in LNCaP cells with duplication of AR enhancer (ARenh), LNCaP control clones (Con), or LNCaP cells with ectopic overexpression of AR (3xFlag_AR). AR expression was normalized to parental LNCaP cells (Parental). Data represent the average and standard deviation of 3 biological replicates and significance determined by Student’s t test. ** p < 0.01.
(C) Protein levels of AR as measured by immunoblotting of cell lysates from LNCaP cells as in (B). Actin is used as a loading control.
(D) Proliferation as measured by crystal violet staining of LNCaP cells as described in (B) grown for 7 days in the presence of indicated concentration of R1881. Absorbance was normalized to vehicle control. Data represent the average and standard deviation of 3 biological replicates.
(E) Proliferation of LNCaP cells as described in (B) in the presence of indicated concentrations of enzalutamide. Viability was measured by CellTiter-Glo and normalized to vehicle control. Data represent the average and standard deviation of 3 biological replicates and significance determined by Student’s t test. * p < 0.05, ** p< 0.01.
See also Figure S3.
The AR enhancer resembles a developmental enhancer
Publicly available ChIP-seq datasets demonstrate that multiple trans-acting factors bind to this enhancer in LNCaP, including FOXA1, HOXB13, NKX3-1, GATA2, and AR (Mei et al., 2017) (Figure S4A–B). Previous studies have shown that suppression of HOXB13 and GATA2 expression leads to decreased AR levels (He et al., 2014; Pomerantz et al., 2015). Whether AR suppression is being mediated directly through this enhancer, however, is currently unknown.
In localized tumors, despite the absence of H3K27ac, the AR enhancer is unexpectedly bound by multiple transcription factors. In a previously characterized set of 13 localized prostate tumors, peaks 2 and 3 were called as tumor-AR binding sites, which were defined as regions where AR binding intensity is greater in tumors compared to a set of benign epithelium (Pomerantz et al., 2015). To assess binding of additional prostate cancer transcription factors, we performed HOXB13 and FOXA1 ChIP-seq in a set of four localized tumors. Interestingly, signal was present for both HOXB13 and FOXA1 predominantly at DHS peaks 2 and 3 (Figure 5A).
Figure 5. The AR enhancer binds transcription factors and resembles a developmental enhancer.

(A) Transcription factor binding (FOXA1, HOXB13) and histone modifications (H3K27ac, H3K4me2, H3K27me3) at the AR enhancer locus in localized prostate tumors as determined by ChIP-seq. Representative tracks are shown for the histone modifications. Also shown is DNaseI hypersensitivity data for the LNCaP prostate cancer cell line. The presence of transcription factor binding and the absence of histone modifications suggests that this is a vestigial enhancer that becomes activated during the transition to CRPC.
(B) Methylation levels of healthy tissue and tumor prostate samples in the AR enhancer as determined by whole genome bisulfite sequencing analysis. Methylation levels are plotted for the enhancer region (shaded in light purple), along with 4kb upstream and downstream. Locations of the three DHS peaks are shaded in dark purple. Locations of CpGs are denoted with tick marks along the x-axis. No CpGs fall in DHS peak 1. Each point denotes the methylation level for a sample group (Donor, Adjacent Tumor, or Tumor indicated by color). Methylation level for each sample group is computed by dividing the total number of methylated reads by the total coverage for all individuals in that group. Sizes of the points are proportional to total coverage. Smoothed local polynomial regression lines weighted by coverage are plotted for each sample group.
See also Figures S4 and S5.
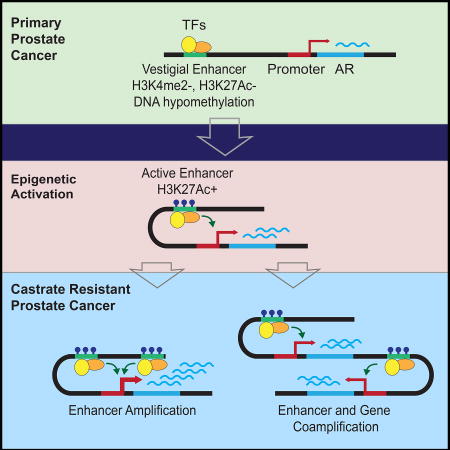
Enhancers can be further categorized based on the constellation of histone modifications and methylation status. Primed enhancers are typically marked by the presence of H3K4me1 or H3K4me2 whereas poised enhancers also include H3K27me3. Notably, the AR enhancer region is devoid of H3K4me2 and H3K27me3 in localized tumors (Figure 5A and Figure S4C). Enhancers that were active during development and then become dormant in adult tissues are referred to as vestigial enhancers and can be identified by the absence of histone marks and being hypomethylated (Hon et al., 2013). Using previously published whole genome bisulfite sequencing data, we observed that the enhancer region is largely methylated in prostate tissue, with the exception of two regions of hypomethylation where levels drop below 0.25 (Yu et al., 2013) (Figure 5B). Notably, these hypomethylated regions coincide with two of the DHS peaks, with the strongest signal exhibited in DHS peak 2. The hypomethylation signal of DHS peak 2 is consistent across benign and cancerous prostate tissue (Figure 5B). Based on these data, we speculate that the AR regulatory region was active during development, became decommissioned and epigenetically bookmarked in adult tissue, and was subsequently reactivated in CRPC disease (Figure S5).
Discussion
The AR remains a key target in the treatment of advanced prostate cancer. While suppressing AR signaling is the primary therapeutic objective in advanced prostate cancer, the transcriptional regulation of the AR gene itself is not well understood. Most of the work on transcriptional control has focused on the AR promoter (Blok et al., 1992; Tilley et al., 1990) and UTRs (Wang et al., 2004). More recently, using chromatin immunoprecipitation (ChIP), an enhancer located in the second intron of the AR gene was identified that contributed to increased AR expression levels at low androgen levels in CRPC (Cai et al., 2011). Another study reported a role for the retinoic acid receptor-related orphan receptor γ (ROR-γ) in controlling AR gene expression through an ROR-γ binding site in exon 1 of the AR locus (Wang et al., 2016).
Amplification of the AR region as a mechanism of resistance was first described over 20 years ago (Visakorpi et al., 1995) and remains the most highly recurrent mutation observed in advanced prostate cancer. For the past two decades, the AR gene itself was the presumed target of the amplicon. Multiple lines of evidence now demonstrate the clear importance of the AR enhancer as a target. Whole genome sequencing data demonstrate that this region is under selection pressure in CRPC; this region is either co-amplified with the AR gene or is relatively more amplified than the AR gene in a high percentage of CRPC cases (Viswanathan et al., 2018). ChIP-seq data reveal that this region is acetylated only in CRPC compared to localized disease and that LNCaP cells are functionally dependent on this enhancer. Recent efforts have demonstrated that noncoding regions, specifically regulatory regions, can behave as oncogenic drivers, however many of these examples occur in a small fraction of cases. By contrast, AR enhancer amplification is highly prevalent (Viswanathan et al., 2018). These observations broaden our notion of noncoding drivers and set the stage for expanding the range of therapeutic targets.
The mechanisms by which enhancers become commissioned and decommissioned over space and time are largely unknown. A somatically acquired enhancer for the TAL1 oncogene was created de novo through the acquisition of a mutation that created a MYB binding site (Mansour et al., 2014). Another study revealed an inherited polymorphism that correlated with a superenhancer in the LMO1 gene in neuroblastoma. The presence of the risk allele created a consensus GATA binding motif leading to increased GATA3 binding and increased LMO1 expression (Oldridge et al., 2015). These examples demonstrate how enhancers emerge through the creation of transcription factor binding sites (TFBS). By contrast, the AR enhancer region does not appear to create de novo TFBS as there are no recurrent single nucleotide variants or indels (Viswanathan et al., 2018). Prior studies showed enhancer dependencies through loss of function studies. In addition to demonstrating loss of function, our study demonstrated that insertion of a single additional copy of the AR enhancer, which models the CRPC clinical state, was sufficient to drive a castration resistant phenotype.
The pattern of epigenetic marks during the transition from localized to CRPC tumors is consistent with this region being a developmental enhancer that becomes reactivated in CRPC. Prior literature has identified a class of vestigial enhancers that are defined as regulatory elements that were active during development and became quiescent in adult tissue. These enhancers were defined by an epigenetic configuration of hypomethylation and absence of histone marks that define poised, primed, and active enhancers (Hon et al., 2013). Notably, transcription factor binding was present in primary localized, non-metastatic tumors in the absence of H3K27ac, H3K27me3, and H3K4me2 signals. Finally, peaks 2 and 3 were hypomethylated in benign and localized tumors using previously generated whole genome bisulfite sequencing data (Yu et al., 2013). Therefore, we posit that this element is a vestigial enhancer that becomes activated during the selective pressure exerted by antiandrogen treatment (Figure S5).
Our findings suggest additional opportunities for epigenetic therapeutic targeting of the AR in CRPC. CRISPRi against this element showed that deacetylation of this enhancer element effectively suppresses AR signaling and decreased sensitivity to enzalutamide. Therefore, specific targeting of the AR enhancer should, in theory, provide an additional therapeutic avenue to suppress AR levels. The cognate transcription factors that bind the AR enhancer may also serve as targets for therapeutic intervention. Although transcription factors have been historically difficult to target with small molecules, emerging technologies such as small molecule microarrays (Hong et al., 2014) and Degronimids (Winter et al., 2015) may render it possible to therapeutically target specific transcription factors required for enhancer activation.
Through an integrative analysis of ChIP-seq in primary specimens across state transitions, copy number alterations, 3C, and genome editing, we have identified a somatically acquired, functionally relevant enhancer of the AR in CRPC. Copy number data demonstrating that this region is under selective pressure coupled with the observation that a single extra copy of the enhancer is sufficient to induce decreased sensitivity to enzalutamide strongly supports the importance of non-genic elements as oncogenic drivers. We speculate that future efforts to target this enhancer may present additional viable opportunities for targeting the AR in advanced prostate cancer.
STAR METHODS
CONTACT FOR REAGENT AND RESOURCE SHARING
Further information and requests for resources and reagents should be directed to and will be fulfilled by the Lead Contact, Matthew Freedman (mfreedman@partners.org).
EXPERIMENTAL MODEL AND SUBJECT DETAILS
Tissue cohort
Fresh-frozen radical prostatectomy and metastatic specimens were selected from the Dana-Farber Cancer Institute/Harvard Cancer Center SPORE biobank and database, as part of DFCI Protocol 01-045, approved by the Dana-Farber Cancer Institute/Harvard Cancer Center Institutional Review Board. Informed consent was obtained from all subjects whose samples were included in the study. The patients were men aged 41–67 years, with a median of 57 years. A genitourinary pathologist reviewed slides stained with hematoxylin and eosin from each case and isolated areas estimated to be enriched by >70% for prostate tumor tissue.
The metastatic specimens were obtained by biopsies from four individuals and were comprised of three liver mets and one lymph node. All patients had metastatic CRPC.
Cell Lines
LNCaP and 22Rv1 cell lines were from ATCC and grown in RPMI (Invitrogen) supplemented with 10% fetal calf serum (Sigma), 100 U/mL penicillin, and 100 µg/mL streptomycin (Invitrogen). 293T cells were from ATCC and grown in DMEM (Invitrogen) supplemented with 10% fetal calf serum (Sigma), 100 U/mL penicillin, and 100 µg/mL streptomycin (Invitrogen). Cell lines were authenticated by short tandem repeat profiling and tested negative for mycoplasma (DDC Medical). LNCaP cell line overexpressing exogenous AR (LNCaP-AR) was generated by transducing LNCaP cells with pXPR_BRD118-AR followed by selection with hygromycin.
METHOD DETAILS
Design and creation of gRNA plasmid library
Every possible 20 nucleotide guide RNA (gRNA) spanning the region from 66,118,920 to 66,127,943 (UCSC sequence Genome Browser hg19) was designed based on the NGG protospacer adjacent motif (PAM) of S. pyogenes Cas9. This resulted in 878 gRNAs with an average distance of 10 bp between cleavage sites. For positive controls, we included gRNAs targeting the common essential genes EIF4A3, SF3B3, and RPL23, as well as the AR gene based on the Avana library sequences from the Broad Institute’s genome-scale CRISPR library (Doench et al., 2016). For negative controls, we used 100 nontargeting gRNAs previously described (Wang et al., 2014). Table S1 provides the sequences for the complete library pool consisting of 1018 gRNAs. Sequences were appended to facilitate cloning and amplification by PCR and the library was purchased from CustomArray as a pool of single stranded oligonucleotides. The oligonucleotide pool was amplified using NEBNext polymerase (New England Biolabs) and cloned into pXPR_BRD003 by Golden Gate cloning. The plasmid pool was transformed into Stbl4 electrocompetent cells (Invitrogen) and DNA purified using QIAGEN maxiprep kit.
Pooled lentiviral CRISPR/CRISPRi screen of AR enhancer
Lentivirus was generated by transfecting 293T cells with the plasmid pool together with the packaging plasmids pVsVG and pdelta8.9 using TransIT-LT1 transfection reagent (Mirus). Supernatant containing virus was harvested 48 hours after transfection and used to transduce LNCaP cell lines stably expressing Cas9 or KRAB-dCas9. LNCaP cells stably expressing Cas9 or KRAB-dCas9 were generated by transduction with pLEX_311-Cas9 or lenti-KRAB-dCas9-blast followed by selection with blasticidin. Viral transductions were performed in the presence of 4 µg/ml polybrene with centrifugation at 2000g for 2 hours. Medium was changed 24 hours after infection and replaced with medium containing 2 µg/ml puromycin for 3 days. The optimal virus concentration for the screen was determined by titrating the volume of virus to obtain an infection efficiency of approximately 30% as determined by calculating the viability of cells in the absence and presence of puromycin. This corresponds to a multiplicity of infection < 1 to ensure that each cell receives a single gRNA. For the screen, 3 × 10⁶ cells were transduced corresponding to an overall representation of 3000 cells per gRNA. Cells were passaged every 3–4 days, with an aliquot of 3 × 10⁶ cells harvested with each passage for isolation of genomic DNA. Genomic DNA was harvested using QIAGEN DNeasy. Each screen was done in duplicate.
Libraries were generated by PCR amplification of gRNA sequence using construct specific primers containing Illumina adaptor sequences and barcodes for multiplexing. PCR product was purified after separation by agarose electrophoresis using QIAGEN gel purification kit and submitted for sequencing on Illumina MiSeq using 75 bp paired end reads. We sequenced genomic DNA taken from cells harvested at days 3 and 7 (early time points) and days 16 and 20 (late time points).
Proliferation Assays
Cells were transduced with lentivirus in the presence of 4 µg/ml polybrene and medium changed after 24 hours. After selection for 72 hours with medium containing puromycin, cells were counted and replated into 12 well plates. Cells were counted after 5 days using a Beckman Vi-cell counter.
Competition Experiments
LNCaP cells stably expressing firefly luciferase or Renilla luciferase were generated by transduction with pLX313-Firefly Luciferase or pLX313-Renilla Luciferase followed by selection with hygromycin. LNCaP cells expressing firefly luciferase were transduced with lentivirus expressing both Cas9 and gRNA (pXPR_BRD023) and selected for 72 hours with puromycin. LNCaP cells expressing Renilla luciferase were similarly transduced with Cas9 and nontargeting gRNA. Cells were counted and firefly luciferase and Renilla luciferase expressing cells were mixed in a 1:1 ratio and plated in a 96 well plate. Cells were passaged every 3–4 days and relative ratio of cells were determined at indicated time points using Promega Dual-Glo. To ensure that differences were not influenced by the reporter plasmid, the experiment was also repeated after switching firefly and Renilla luciferase.
Quantitative RT-PCR
RNA was isolated using QIAGEN RNeasy Plus Kit and cDNA synthesized using Clontech RT Advantage Kit. Quantitative PCR was performed on a Quantstudio 6 using SYBR green. Primers used for qRT-PCR are listed in Table S2.
Immunoblotting
Cells were lysed using RIPA buffer (Sigma) and quantified by BCA assay (Thermo). Equal amounts of protein were loaded onto 4–12% Bis-Tris NuPage gel (Life Technologies) and immunoblotting performed per standard protocol and images obtained using LI-COR Odyssey Imaging System. Antibodies used: Androgen Receptor (Cell Signaling Technology D6F11), Beta-Actin (Cell Signaling Technology 8H10D10), Goat anti-Rabbit IgG (LI-COR), Goat anti-Mouse IgG (LI-COR).
Cloning
For validation experiments, gRNA sequences were synthesized as complementary single stranded oligonucleotides with sticky ends (detailed protocol also available at http://www.broadinstitute.org/rnai/public/resources/protocols). Following annealing, oligonucleotides were cloned into pXPR_BRD023 (vector containing Cas9 and gRNA), lenti_U6sg-KRAB-dCas9-puro (vector containing KRAB-dCas9 and gRNA), or pXPR_BRD003 (vector with gRNA only).
AR enhancer knock-in
To generate the targeting vector for homologous recombination (HR), we PCR amplified 1 kb genomic regions (chrX:66130001–66130990 and chrX:66131028–66132047) located approximately 4 kb telomeric to the AR enhancer. These served as the homology arms that were cloned into the BsrGI site and NotI/SalI sites, respectively, of the vector HR700PA-1 (System Biosciences). We then PCR amplified the 9 kb AR enhancer from LNCaP genomic DNA and cloned the region into HR700PA-1 containing the homology regions using the NotI and MluI sites. HR700PA-1 contains a GFP-puromycin cassette for positive selection that is flanked by LoxP sites allowing subsequent removal by Cre recombinase. We designed a gRNA for CRISPR-Cas9 editing to target position 66131023. The gRNA sequence was synthesized as complimentary single stranded oligonucleotides for cloning into pXPR_BRD003. The HR targeting vector, a Cas9 expression plasmid (pLEX_304-Cas9), and the gRNA expression plasmid were delivered to LNCaP cells by nucleofection and plated in 6 well plates. After 10 days, cells were selected by puromycin for an additional 7 days, and clones from each well identified by limiting dilution in 96 well plates. Colonies were screened by 2 sets of PCR primers with each set containing one primer complimentary to genomic DNA outside of the HR arms and one primer corresponding to the insert. Positive clones were then transfected with a Cre expression plasmid (Santa Cruz) by nucleofection and GFP negative cells sorted by FACS to identify cells that successfully underwent recombination to remove the GFP and puromycin selection markers. We subsequently confirmed successful recombination using primers spanning the HR arms as depicted in Figure 4. Primer sequences used are listed in Table S2.
Chromosome Conformation Capture
Chromosome Conformation Capture (3C) was performed as previously described (Pomerantz et al., 2009). Ten million LNCaP cells were harvested and fixed with 1% formaldehyde for 10 min. Cells were lysed (10 mM Tris-HCl pH 8, 10 mM NaCl, 0.2% Nonidet P-40) and pelleted nuclei were resuspended in restriction enzyme buffer (NEB) containing 0.1% SDS and 1.6% Triton X-100. 1500 units of BglII (NEB) were added and incubated at 37°C overnight. Digestions were halted by incubation with 1.5% SDS at 65°C for 30 minutes. Digested samples were added to ligation buffer containing 4000U T4 DNA ligase (NEB) and 1% Triton X-100 to neutralize SDS and incubated for 24 hr at 16°C. Crosslinking was reversed by overnight incubation at 65°C with proteinase K. Libraries were extracted using standard phenol/chloroform protocols, precipitated using ethanol, and desalted using Microcon Ultra Cell 30K filter columns. Primers were designed against the AR promoter and against the restriction fragments containing the AR enhancer (Figure 1C, Table S2). PCR was performed using Taq polymerase (QIAGEN), using the following conditions: 5 min at 94°C, 35 cycles of (20s at 94°C, 20s at 61°C, and 30s at 72°C), and 10 min at 72°C. The PCR products were run on a 1.7% agarose gel, gel purified using the QIAgen Gel Extraction kit, and sequenced.
Crystal Violet Proliferation Assays
Cells were washed twice with medium supplemented with charcoal stripped serum and plated in 12 well plates in medium with charcoal stripped serum at a density of 25,000 cells per well. The medium was replaced at 24 hours and again after 4 days with medium containing indicated concentrations of R1881 (Sigma). Cells were harvested 7 days after R1881 treatment by fixing with methanol and staining with crystal violet. Images were taken on a Leica Z6 microscope. Crystal violet was solubilized by 10% acetic acid and absorbance measured at 595 nm.
Enzalutamide Treatment
Cells were plated in 96 well plates at a density of 1,000 cells per well and allowed to adhere for 24 hours before treatment with indicated concentrations of enzalutamide (Selleck) in DMSO. Viability was measured by CellTiter-Glo (Promega) after 7 days and relative luciferase units normalized to vehicle control.
Transcription Factor ChIP-seq in human tissue specimens
Using a 2-mm2 core needle, approximately three cores (TF) were extracted from areas circled on each slide. Frozen cores were pulverized using the Covaris CryoPrep system. Tissue was then fixed using 1% formaldehyde with methanol for 18 min at room temperature, and fixation was quenched with 2M glycine. Chromatin was sheared to 300–500 bp in size using the Covaris E220 ultrasonicator. The resulting chromatin was incubated overnight with 6 µg of antibody—to AR (E2724, Spring Biosciences), HOXB13 (sc-66923, Santa Cruz Biotechnology) or FOXA1 (ab23738, Abcam)—bound to protein A and protein G beads (Life Technologies). A fraction of the sample was not exposed to antibody and was used as control (input). Samples underwent cross-linking reversal and were treated with RNase and proteinase K, and DNA was extracted. Concentrations of ChIP DNA were quantified by Qubit fluorometer (Life Technologies). DNA sequencing libraries were prepared using the ThruPLEX-FD Prep kit (Rubicon Genomics). Libraries were sequenced using 75-bp reads on the Illumina platform at the Dana-Farber Cancer Institute.
Histone ChIP-seq in human tissue specimens
One 2-mm2 frozen core was pulverized using the Covaris CryoPrep system. Tissue was then fixed using 1% formaldehyde with methanol for 18 min at 37°C, and quenched with 2M glycine. Chromatin was sheared to 300–500 bp in size using the Covaris E220 ultrasonicator. The resulting chromatin was incubated overnight with 6 µg of antibody—H3K27ac (C15410196, Diagenode), H3K4me2 (07030, Millipore), or H3K27me3 (9733S, Cell Signaling) - bound to protein A and protein G beads (Life Technologies). A fraction of the sample was not exposed to antibody and was used as control (input). Samples underwent cross-linking reversal and were treated with RNase and proteinase K, and DNA was extracted. The concentrations of ChIP DNA were quantified by Qubit fluorometer (Life Technologies), and DNA sequencing libraries were prepared using the ThruPLEX-FD Prep kit (Rubicon Genomics). Libraries were sequenced using 75-bp reads on the Illumina platform at the Dana-Farber Cancer Institute.
H3K27Ac ChIP on 22RV1 cells
H3K27Ac ChIP in 22RV1 cells was performed as previously described (Pomerantz et al., 2015). Ten million cells were fixed using 1% formaldehyde (Thermo fisher, Waltham, MA) for 10 minutes at 37°C. Chromatin was sheared in ice cold lysis buffer (50mM Tris, 10mM EDTA, 1% SDS with protease inhibitor) to 300–500 base pairs using the Covaris E210 sonicator. The sample was incubated with 1 µg H3K27Ac antibody (Diagenode, C15410196, Denville, NJ) coupled with protein A and protein G beads (Life Technologies, Carlsbad, CA) at 4°C overnight. The chromatin was washed with RIPA washing buffer (0.05M HEPES pH 7.6, 1 mM EDTA, 0.7% Na Deoxycholate, 1% NP-40, 0.5M LiCl). After decrosslinking, IP DNA as well as its input were extracted using Qiagen Qiaquick columns, and sequencing libraries prepared using the ThruPLEX-FD Prep Kit (Rubicon Genomics, Ann Arbor, MI). Libraries were sequenced using 75-base pair single reads on the Illumina platform at the Dana-Farber Cancer Institute.
Histone ChIP-qPCR in cell lines
Following transduction, 10–15 million cells were fixed using 1% paraformaldehyde for 10 minutes at room temperature and quenched with glycine. Nuclei were isolated and chromatin sheared by sonication using Branson 450 in lysis buffer (10 mM Tris pH 8.0, 5 mM EDTA, 2.5 mM EGTA, 0.5% sarcosine). Immunopreciptation was done overnight with 2 µg of antibody. Antibodies used: anti-H3K27ac (Cell Signaling D5E4). Protein A magnetic beads (Life Technologies) were added and incubated for 1 hour at 4°C. Immunoprecipitates were washed with low salt buffer (20 mM Tris pH 8.0, 150 mM NaCl, 2 mM EDTA, 1% Triton), high salt buffer (20 mM Tris pH 8.0, 500 mM NaCl, 2 mM EDTA, 1% Triton), LiCl buffer (100 mM Tris pH 8.0, 500 mM LiCl, 1% NP-40, 1% deoxycholate), and twice with TE (10 mM Tris pH 8.0, 1 mM EDTA). DNA was eluted with TE with 1% SDS for 10 minutes at 65°C. Crosslinking was reversed by treating with proteinase K at 65°C for 6 hours followed by RNAse treatment for 30 min at 37°C. DNA was purified using QIAGEN PCR purification kit, and quantified using qPCR. Primers used are listed in Table S2.
T7 Endonuclease I assay
As described previously (Spisak et al., 2015), transduced cells were harvested 3 days after puromycin selection, and genomic DNA was isolated (Qiagen). Amplicon including gRNA target sites were generated using AR_P2_1196 peak 2 specific primer pairs (Table S2). PCR products were purified by Ampure XP (Agencourt) magnetic beads according to the manufacturer's instructions. 500 ng of purified PCR product was denatured and reannealed in 1x NEBuffer 2.1 (New England Biolabs) using the following protocol: 95°C, 5 min; 95–85°C at −2 °C/s; 85–25°C at −0.1 °C/s; hold at 4°C. Hybridized PCR products were treated with 10 U of T7 Endonuclease I at 37°C for 30 min in a reaction volume of 30 µl. Reactions were stopped by the addition of 2 µl 0.5 M EDTA, purified with Ampure XP magnetic beads. DNA fragments were visualized on 1% agarose gel. Digested PCR products were analyzed on 1% agarose gel.
Data visualization for ChIP-seq samples
For ChIP-seq signal visualization, the Gviz Bioconductor package was used (Hahne and Ivanek, 2016).
QUANTIFICATION AND STATISTICAL ANALYSIS
Proliferation, qRT-PCR, ChIP-qPCR, competition experiments
Data from at least three independent biological replicates were used to determine the average and standard deviation. Statistical tests used and p values are described in the figure legends.
Copy number variation analysis on chromosome X
The dataset of 149 prostate cancer tissue samples (GSE77930) from 60 patients with metastatic CRPC was downloaded from GEO database (Kumar et al., 2016). Each patient had multiple sites analyzed by comparative genomic hybridization (CGH) SNP arrays. Patient level probe value information was calculated for each patient using average values of the corresponding samples. The average copy number values for the whole cohort were calculated as the mean of patient level copy numbers. Cumulative gain levels were calculated for each patient for the AR gene and the enhancer, using the mean of all probes in the AR gene and the mean of the 3 closest probes for the enhancer. Genomic coordinates were converted and values at chr X:63,000,000–70,000,000 were visualized using hg19 human reference genome.
Chromosome Conformation Capture Quantification
For analyzing long-range interaction quantitatively, BAC clones (RP11-137A22, RP11-807F19) to cover AR promoter and AR enhancer candidate region on chromosome X were obtained from the Children’s Hospital Oakland Research Institute. A BAC library was prepared as previously described (Miele et al., 2006). Two BAC clones were purified using BAC DNA prep kit (Zymo Research) and were mixed in equimolar. 20 µg BAC DNA was digested with CSP6I (Fisher biosciences) at 37°C overnight followed by 1:1 phenol/chloroform extraction and ethanol precipitation purification. 1 day ligation with T4 DNA ligase (NEB) at 16°C was performed. Then BAC library was purified and is used as BAC genomic DNA control template for 3C long range interaction verification. 3C libraries as well as the BAC library were titrated by serial dilution to identify the concentration of template for quantitative PCR analysis for each genomic region of interest. The PCR products were run on an agarose gel and stained with ethidium bromide. Intensity measurements for each of the bands were quantified using ImageQuant LAS4000 (Roche) with Image QuantTL8.1 software (Roche). The interaction frequency was determined by dividing the amount of PCR product obtained using the 3C template by the amount of PCR product obtained using the control template. Each template was run in triplicate and the standard error of measurement (SEM) calculated. The SEM for each amplicon was less than 15%.
Pooled CRISPR screen analysis
Sequencing reads were demultiplexed and aligned using the PoolQ algorithm from the Broad Institute (https://portals.broadinstitute.org/gpp/public/software/poolq). The number of reads for each gRNA was normalized to the total number of reads and converted to log2 and averaged between replicates. The log2 ratio was determined using the average of the late time points (day 16 and day 20) relative to the early time points (day 3 and day 7). We then took the Z-score of each gRNA. To account for differences in efficiency and potential off target effects of individual gRNAs, we used a sliding window to average the scores of 25 adjacent gRNAs.
ChIP-seq data analysis
All samples were processed through the exact same computational pipeline developed at the Center for Functional Cancer Epigenetics (CFCE) using primarily open source programs. Sequence tags were aligned with Bowtie to build hg19 of the human genome, and uniquely mapped, non-redundant reads were retained (Langmead et al., 2009). These reads (termed 'unique mappable locations') are tabulated for each sample and were used to generate binding sites with Model-Based Analysis of ChIP-seq 2 (MACS v2.0.10), with a q-value (FDR) threshold of 0.01 (Zhang et al., 2008). We evaluated multiple quality control criteria based on alignment information and peak quality: (i) sequence quality score; (ii) uniquely mappable reads (reads that can only map to one location in the genome); (iii) uniquely mappable locations (locations that can only be mapped by at least one read); (iv) peak overlap with Velcro regions, a comprehensive set of locations—also called consensus signal artifact regions—in the human genome that have anomalous, unstructured high signal or read counts in next-generation sequencing experiments independent of cell line and of type of experiment (2012); (v) number of total peaks (the minimum required was 1,000); (vi) highconfidence peaks (the number of peaks that are tenfold enriched over background); (vii) percentage overlap with known DHSs derived from the ENCODE Project (the minimum required to meet the threshold was 80%); and (viii) peak conservation (a measure of sequence similarity across species based on the hypothesis that conserved sequences are more likely to be functional). Typically, if a sample fails one of these criteria, it will fail many (locations with low mappability will likely have low peak numbers, many of which will likely be in high-mappability regions, etc.). For ChIP-seq signal visualization, the Gviz Bioconductor package was used (Hahne and Ivanek, 2016).
Whole-Genome Bisulfite Sequencing (WGBS) analysis
Paired end WGBS data from the prostate tissue of four healthy donors and five prostate cancer patients were obtained from the authors (Yu et al., 2013). Samples of tissue adjacent to the tumor from four of the prostate cancer patients were also included. Quality control of the sequencing reads, including trimming for quality (bases below Phred score threshold of 20 were trimmed) and adapters (Nextera adapter sequences were discarded), was carried out using Trim Galore! (version 0.4.4_dev). Reads were discarded if either mate pair was trimmed to below 20 bases. Trimmed reads were mapped to the hg19 genome reference (ftp://ftp.ensembl.org/pub/grch37/current/fasta/homo_sapiens/dna/Homo_sapiens.GRCh37.dna.chromosome.*.fa.gz) using Bowtie2 (Langmead and Salzberg, 2012) and Bismark v0.19.0 (Krueger and Andrews, 2011) in non-directional mode. Counts of methylated reads and total coverage for each cytosine in CpG context were extracted using the bismark_methylation_extractor command.
Methylation proportions for each CpG collapsed over strand were computed using the bsseq Bioconductor package in R (Hansen et al., 2012). The body site samples were lifted over to hg19 coordinates using the rtracklayer Bioconductor package (Lawrence et al., 2009). Data was visualized in the enhancer region using the dmrseq Bioconductor package (Korthauer et al., 2018).
DATA AND SOFTWARE AVAILABILITY
The accession number for the sequencing data from the ChIP-seq experiments reported in this paper is GEO: GSE114385.
Supplementary Material
Figure S1: Putative AR enhancer demonstrates features consistent with a prostate cancer specific regulatory element, Related to Figure 1
(A) Correlation between AR gene copy number (x-axis) and enhancer copy number (y-axis). Each green symbol represents a metastatic CRPC tumor derived from 60 men (149 tumors); data from (Kumar et al., 2016). The area of the green symbols represents AR expression levels. Panels to the left and the right are examples of individual copy number plots where the x-axis is chromosome position and the y-axis represents copy number. The vertical red lines show the location of the candidate enhancer and the vertical green lines show the location of the AR gene.
(B) DNaseI hypersensitivity tracks in ENCODE cell lines reveal that the AR enhancer is cell type specific. Overlay of DHS signal from 104 cell lines in ENCODE in a 1.2 Mb region encompassing the AR enhancer. LNCaP is the only prostate cell line among the 104 lines.
(C) Conserved CTCF binding sites centromeric to the AR enhancer region (red box) and telomeric to the AR transcription start site (red line) as demonstrated by comparison of CTFC ChIP-seq from LNCaP cells and overlay from 52 ENCODE cell lines. Conserved CTCF binding is a common feature of topological associating domains.
Figure S2: Validation of AR enhancer screens and AR rescue experiments, Related to Figure 3
(A) Design of competition assay to validate gRNAs targeting Cas9 to AR enhancer. LNCaP cells are stably transduced to express either firefly or Renilla luciferase for monitoring in a competition assay (Giacomelli et al., 2018). The different isogenic lines are transduced separately with Cas9 and different gRNAs and mixed in a 1:1 ratio. Following serial passaging, the relative abundance of each gRNA is determined by measuring the ratio of firefly luciferase to Renilla luciferase using Promega Dual-Glo assay.
(B) Relative proliferation of LNCaP cells in competition assay following transduction of indicated gRNAs versus a nontargeting gRNA control. Ratio of firefly to Renilla luciferase activity is normalized to nontargeting gRNA. A gRNA targeting the essential gene U2AF1 is used as a positive control. Experiment was repeated switching the firefly and Renilla luciferase (right). Data represent the average and standard deviation of 3 biological replicates, and significance determined by Student’s t test, * p < 0.05, ** p < 0.01.
(C) T7 Endonuclease I assay for top scoring Cas9 screen gRNAs in order to demonstrate cleavage efficiency.
(D) H3K27ac at second DHS peak of AR enhancer as determined by ChIP qPCR following transduction of KRAB-dCas9 and indicated gRNAs. Primers that amplify regions outside of the AR enhancer were used as controls (Control_1 and Control_2).
(E) Recruitment of KRAB-dCas9 to AR enhancer suppresses AR transcriptional targets. Expression of genes upregulated by AR (KLK3 and TMPRSS2) and downregulated (AMIGO2 and PLD1) as measured by qRT-PCR following transduction of KRAB-dCas9 and indicated gRNAs. Transduction of gRNA targeting the unrelated gene HPRT1, and nontargeting gRNA (NT) were used as controls. AR expression was normalized to nontargeting gRNA. Data represent the average and standard deviation of 3 biological replicates, and significance determined by Student’s t test. * p < 0.05, ** p < 0.01
(F) Exogenous expression of AR rescues suppression of AR enhancer. Expression of KLK3 and PLD1 as measured by qRT-PCR after transduction of LNCaP cells or LNCaP cells expressing exogenous AR (LNCaP-AR) with KRAB-dCas9 and indicated gRNAs. Transduction of gRNA targeting the unrelated gene HPRT1, and nontargeting gRNA (NT) were used as controls. Expression is normalized to nontargeting gRNA. Data represent the average and standard deviation of 3 biological replicates, and significance determined by Student’s t test. * p < 0.05, ** p< 0.01.
(G) Exogeneous AR expression is unaffected by suppression of endogenous AR enhancer. Expression of endogenous AR or exogenous AR in LNCaP-AR cells as measured by qRT-PCR after transduction with KRAB-dCas9 and indicated gRNAs demonstrate suppression of AR enhancer is specific for endogenous AR mRNA. Transduction of gRNA targeting the unrelated gene HPRT1, and nontargeting gRNA (NT) were used as controls. Expression is normalized to nontargeting gRNA. Data represent the average and standard deviation of 3 biological replicates, and significance determined by Student’s t test. ** p< 0.01.
Figure S3: AR enhancer knock-in is acetylated, Related to Figure 4
H3K27Ac at AR enhancer as determined by ChIP-QPCR. Results are expressed as % input normalized to nonamplified control region. Primers that amplify regions outside of the AR enhancer were used as controls (Control_1 and Control_2). Data represent the average and standard deviation of 3 biological replicates, and significance determined by Student’s t test. * p < 0.05.
Figure S4: Multiple transcription factors relevant to prostate biology bind to the AR enhancer, Related to Figure 5
(A) Tracks depict binding of indicated transcription factors to the AR enhancer in LNCaP cells as determined by ChIP-seq data downloaded from the Cistrome Data Browser (URL: cistrome.org/db) accessed on November 2017 (Mei et al., 2017).
(B) Summary table of ChIP-seq results from (A) including total number of peaks and whether a peak in the enhancer was called as significant.
(C) Representative tracks of histone modifications. Histone modifications (H3K27ac, H3K4me2, H3K27me3) in primary prostate tissue samples as determined by ChIP-seq at the HoxD cluster to confirm technical success of experiment and data quality.
Figure S5: Proposed model for AR enhancer activation in CRPC, Related to Figure 5
Table S1: CRISPR Screening Library Sequences and Results, Related to STAR Methods
Highlights.
An AR enhancer becomes activated in castrate resistant prostate cancer (CRPC)
The AR enhancer is frequently amplified in CRPC
The enhancer amplification desensitizes cancer cells to hormone deprivation treatment
The AR enhancer is likely to be a developmental enhancer that is reactivated in CRPC
Acknowledgments
We thank Andrew Giacomelli (DFCI), Joseph Rosenbluh (Monash University), Xiaoyang Zhang (DFCI), Peter Choi (DFCI), Zachary Herbert (DFCI; Molecular Biology Core Facilities) and members of the Freedman lab and Hahn lab for useful discussions and technical assistance. We thank Rafael Irizarry (DFCI) for supporting the work of K.K. We would also like to thank Srini Viswanathan, Gavin Ha, and Matthew Meyerson for sharing unpublished results, and Lauren Solomon (Broad Institute) for design of the graphical abstract. This work was supported by NIH grants R01GM107427 and R01CA193910 (to M.L.F.), Prostate Cancer Foundation Challenge Award (to M.L.F.), NIH grant K08CA218530 (to D.Y.T.), NIH grant R01HG005220 (to K.K.), National Research, Development and Innovation Fund of Hungary Project no. FIEK_16-1-2016-0005 (to D.R. and I.C.), Novo Nordisk Foundation Interdisciplinary Synergy Programme Grant no. NNF15OC0016584 (to D.R, I.C., and Z.S.), European Social Fund grant agreement no. EFOP-3.6.3-VEKOP-16-2017-00005 (to N.S.), Breast Cancer Research Foundation BCRF-17-156 (to Z.S.), Rebecca and Nathan Milikowsky (to M.M.P.), NIH grant U01 CA176058 (to W.C.H), H.L. Snyder Medical Research Foundation (to W.C.H. and M.L.F.).
Footnotes
Publisher's Disclaimer: This is a PDF file of an unedited manuscript that has been accepted for publication. As a service to our customers we are providing this early version of the manuscript. The manuscript will undergo copyediting, typesetting, and review of the resulting proof before it is published in its final citable form. Please note that during the production process errors may be discovered which could affect the content, and all legal disclaimers that apply to the journal pertain.
Author Contributions
Conceptualization, D.Y.T., S.S., J.H.S., M.L.F.; Methodology, D.Y.T., S.S., J.H.S., K.K., D.R., I.C., N.S., Z.S., H.W.L., M.M.P., W.C.H., M.L.F.; Formal Analysis, D.Y.T., S.S., J.H.S., K.K., D.R., I.C., N.S., Z.S., P.C., X.Q.; Investigation, D.Y.T., S.S., J.-H.S., C.B., E.O., D.R.S., V.T., P.V.N., and M.R.; Resources, I.C., W.C.H., M.L.F.; Writing – Original Draft, D.Y.T., S.S., M.L.F.; Writing – Review & Editing, D.Y.T., S.S., J.H.S., K.K., W.C.H., M.L.F.; Visualization, D.Y.T., S.S., J.H.S., K.K., N.S., D.R.; Supervision, W.C.H., M.L.F.
Declaration of Interests
The authors declare no competing interests.
References
- An integrated encyclopedia of DNA elements in the human genome. Nature. 2012;489:57–74. doi: 10.1038/nature11247. [DOI] [PMC free article] [PubMed] [Google Scholar]
- Akhtar-Zaidi B, Cowper-Sal-lari R, Corradin O, Saiakhova A, Bartels CF, Balasubramanian D, Myeroff L, Lutterbaugh J, Jarrar A, Kalady MF, et al. Epigenomic enhancer profiling defines a signature of colon cancer. Science (New York, NY) 2012;336:736–739. doi: 10.1126/science.1217277. [DOI] [PMC free article] [PubMed] [Google Scholar]
- Blok LJ, Themmen AP, Peters AH, Trapman J, Baarends WM, Hoogerbrugge JW, Grootegoed JA. Transcriptional regulation of androgen receptor gene expression in Sertoli cells and other cell types. Molecular and cellular endocrinology. 1992;88:153–164. doi: 10.1016/0303-7207(92)90020-7. [DOI] [PubMed] [Google Scholar]
- Cai C, He HH, Chen S, Coleman I, Wang H, Fang Z, Chen S, Nelson PS, Liu XS, Brown M, et al. Androgen receptor gene expression in prostate cancer is directly suppressed by the androgen receptor through recruitment of lysine-specific demethylase 1. Cancer cell. 2011;20:457–471. doi: 10.1016/j.ccr.2011.09.001. [DOI] [PMC free article] [PubMed] [Google Scholar]
- Chen CD, Welsbie DS, Tran C, Baek SH, Chen R, Vessella R, Rosenfeld MG, Sawyers CL. Molecular determinants of resistance to antiandrogen therapy. Nature medicine. 2004;10:33–39. doi: 10.1038/nm972. [DOI] [PubMed] [Google Scholar]
- Creyghton MP, Cheng AW, Welstead GG, Kooistra T, Carey BW, Steine EJ, Hanna J, Lodato MA, Frampton GM, Sharp PA, et al. Histone H3K27ac separates active from poised enhancers and predicts developmental state. Proc Natl Acad Sci U S A. 2010;107:21931–21936. doi: 10.1073/pnas.1016071107. [DOI] [PMC free article] [PubMed] [Google Scholar]
- Dixon JR, Selvaraj S, Yue F, Kim A, Li Y, Shen Y, Hu M, Liu JS, Ren B. Topological domains in mammalian genomes identified by analysis of chromatin interactions. Nature. 2012;485:376–380. doi: 10.1038/nature11082. [DOI] [PMC free article] [PubMed] [Google Scholar]
- Doench JG, Fusi N, Sullender M, Hegde M, Vaimberg EW, Donovan KF, Smith I, Tothova Z, Wilen C, Orchard R, et al. Optimized sgRNA design to maximize activity and minimize off-target effects of CRISPR-Cas9. Nat Biotechnol. 2016;34:184–191. doi: 10.1038/nbt.3437. [DOI] [PMC free article] [PubMed] [Google Scholar]
- Giacomelli AO, Yang X, Lintner RE, Duby M, Kim J, Baré O, Howard TP, Takeda DY, Ly SH, Kim E, et al. Mutational processes shape the landscape of TP53 mutations in human cancer. Nature genetics. 2018 doi: 10.1038/s41588-018-0204-y. in press. [DOI] [PMC free article] [PubMed] [Google Scholar]
- Gilbert LA, Larson MH, Morsut L, Liu Z, Brar GA, Torres SE, Stern-Ginossar N, Brandman O, Whitehead EH, Doudna JA, et al. CRISPR-mediated modular RNA-guided regulation of transcription in eukaryotes. Cell. 2013;154:442–451. doi: 10.1016/j.cell.2013.06.044. [DOI] [PMC free article] [PubMed] [Google Scholar]
- Hahne F, Ivanek R. Visualizing Genomic Data Using Gviz and Bioconductor. Methods Mol Biol. 2016;1418:335–351. doi: 10.1007/978-1-4939-3578-9_16. [DOI] [PubMed] [Google Scholar]
- Hansen KD, Langmead B, Irizarry RA. BSmooth: from whole genome bisulfite sequencing reads to differentially methylated regions. Genome Biol. 2012;13:R83. doi: 10.1186/gb-2012-13-10-r83. [DOI] [PMC free article] [PubMed] [Google Scholar]
- He B, Lanz RB, Fiskus W, Geng C, Yi P, Hartig SM, Rajapakshe K, Shou J, Wei L, Shah SS, et al. GATA2 facilitates steroid receptor coactivator recruitment to the androgen receptor complex. Proc Natl Acad Sci U S A. 2014;111:18261–18266. doi: 10.1073/pnas.1421415111. [DOI] [PMC free article] [PubMed] [Google Scholar]
- Heintzman ND, Stuart RK, Hon G, Fu Y, Ching CW, Hawkins RD, Barrera LO, Van Calcar S, Qu C, Ching KA, et al. Distinct and predictive chromatin signatures of transcriptional promoters and enhancers in the human genome. Nature genetics. 2007;39:311–318. doi: 10.1038/ng1966. [DOI] [PubMed] [Google Scholar]
- Herranz D, Ambesi-Impiombato A, Palomero T, Schnell SA, Belver L, Wendorff AA, Xu L, Castillo-Martin M, Llobet-Navas D, Cordon-Cardo C, et al. A NOTCH1-driven MYC enhancer promotes T cell development, transformation and acute lymphoblastic leukemia. Nature medicine. 2014;20:1130–1137. doi: 10.1038/nm.3665. [DOI] [PMC free article] [PubMed] [Google Scholar]
- Hon GC, Rajagopal N, Shen Y, McCleary DF, Yue F, Dang MD, Ren B. Epigenetic memory at embryonic enhancers identified in DNA methylation maps from adult mouse tissues. Nature genetics. 2013;45:1198–1206. doi: 10.1038/ng.2746. [DOI] [PMC free article] [PubMed] [Google Scholar]
- Hong JA, Neel DV, Wassaf D, Caballero F, Koehler AN. Recent discoveries and applications involving small-molecule microarrays. Curr Opin Chem Biol. 2014;18:21–28. doi: 10.1016/j.cbpa.2013.09.020. [DOI] [PMC free article] [PubMed] [Google Scholar]
- Horn S, Figl A, Rachakonda PS, Fischer C, Sucker A, Gast A, Kadel S, Moll I, Nagore E, Hemminki K, et al. TERT promoter mutations in familial and sporadic melanoma. Science (New York, NY) 2013;339:959–961. doi: 10.1126/science.1230062. [DOI] [PubMed] [Google Scholar]
- Huang FW, Hodis E, Xu MJ, Kryukov GV, Chin L, Garraway LA. Highly recurrent TERT promoter mutations in human melanoma. Science (New York, NY) 2013;339:957–959. doi: 10.1126/science.1229259. [DOI] [PMC free article] [PubMed] [Google Scholar]
- Korthauer K, Chakraborty S, Benjamini Y, Irizarry RA. Detection and accurate false discovery rate control of differentially methylated regions from whole genome bisulfite sequencing. Biostatistics. 2018 doi: 10.1093/biostatistics/kxy007. [DOI] [PMC free article] [PubMed] [Google Scholar]
- Krueger F, Andrews SR. Bismark: a flexible aligner and methylation caller for Bisulfite-Seq applications. Bioinformatics. 2011;27:1571–1572. doi: 10.1093/bioinformatics/btr167. [DOI] [PMC free article] [PubMed] [Google Scholar]
- Kumar A, Coleman I, Morrissey C, Zhang X, True LD, Gulati R, Etzioni R, Bolouri H, Montgomery B, White T, et al. Substantial interindividual and limited intraindividual genomic diversity among tumors from men with metastatic prostate cancer. Nature medicine. 2016;22:369–378. doi: 10.1038/nm.4053. [DOI] [PMC free article] [PubMed] [Google Scholar]
- Kundaje A, Meuleman W, Ernst J, Bilenky M, Yen A, Heravi-Moussavi A, Kheradpour P, Zhang Z, Wang J, Ziller MJ, et al. Integrative analysis of 111 reference human epigenomes. Nature. 2015;518:317–330. doi: 10.1038/nature14248. [DOI] [PMC free article] [PubMed] [Google Scholar]
- Langmead B, Salzberg SL. Fast gapped-read alignment with Bowtie 2. Nat Methods. 2012;9:357–359. doi: 10.1038/nmeth.1923. [DOI] [PMC free article] [PubMed] [Google Scholar]
- Langmead B, Trapnell C, Pop M, Salzberg SL. Ultrafast and memory-efficient alignment of short DNA sequences to the human genome. Genome Biol. 2009;10:R25. doi: 10.1186/gb-2009-10-3-r25. [DOI] [PMC free article] [PubMed] [Google Scholar]
- Lawrence M, Gentleman R, Carey V. rtracklayer: an R package for interfacing with genome browsers. Bioinformatics. 2009;25:1841–1842. doi: 10.1093/bioinformatics/btp328. [DOI] [PMC free article] [PubMed] [Google Scholar]
- Mansour MR, Abraham BJ, Anders L, Berezovskaya A, Gutierrez A, Durbin AD, Etchin J, Lawton L, Sallan SE, Silverman LB, et al. Oncogene regulation. An oncogenic super-enhancer formed through somatic mutation of a noncoding intergenic element. Science (New York, NY) 2014;346:1373–1377. doi: 10.1126/science.1259037. [DOI] [PMC free article] [PubMed] [Google Scholar]
- Mei S, Qin Q, Wu Q, Sun H, Zheng R, Zang C, Zhu M, Wu J, Shi X, Taing L, et al. Cistrome Data Browser: a data portal for ChIP-Seq and chromatin accessibility data in human and mouse. Nucleic Acids Res. 2017;45:D658–D662. doi: 10.1093/nar/gkw983. [DOI] [PMC free article] [PubMed] [Google Scholar]
- Miele A, Gheldorf N, Tabuchi TM, Dostie J, Dekker J. Mapping chromatin interactions by chromosome conformation capture. Curr Protoc Mol Biol. 2006;Chapter 21(Unit 21.11) doi: 10.1002/0471142727.mb2111s74. [DOI] [PubMed] [Google Scholar]
- Northcott PA, Lee C, Zichner T, Stutz AM, Erkek S, Kawauchi D, Shih DJ, Hovestadt V, Zapatka M, Sturm D, et al. Enhancer hijacking activates GFI1 family oncogenes in medulloblastoma. Nature. 2014;511:428–434. doi: 10.1038/nature13379. [DOI] [PMC free article] [PubMed] [Google Scholar]
- Oldridge DA, Wood AC, Weichert-Leahey N, Crimmins I, Sussman R, Winter C, McDaniel LD, Diamond M, Hart LS, Zhu S, et al. Genetic predisposition to neuroblastoma mediated by a LMO1 super-enhancer polymorphism. Nature. 2015;528:418–421. doi: 10.1038/nature15540. [DOI] [PMC free article] [PubMed] [Google Scholar]
- Pomerantz MM, Ahmadiyeh N, Jia L, Herman P, Verzi MP, Doddapaneni H, Beckwith CA, Chan JA, Hills A, Davis M, et al. The 8q24 cancer risk variant rs6983267 shows long-range interaction with MYC in colorectal cancer. Nature genetics. 2009;41:882–884. doi: 10.1038/ng.403. [DOI] [PMC free article] [PubMed] [Google Scholar]
- Pomerantz MM, Li F, Takeda DY, Lenci R, Chonkar A, Chabot M, Cejas P, Vazquez F, Cook J, Shivdasani RA, et al. The androgen receptor cistrome is extensively reprogrammed in human prostate tumorigenesis. Nature genetics. 2015;47:1346–1351. doi: 10.1038/ng.3419. [DOI] [PMC free article] [PubMed] [Google Scholar]
- Puente XS, Bea S, Valdes-Mas R, Villamor N, Gutierrez-Abril J, Martin-Subero JI, Munar M, Rubio-Perez C, Jares P, Aymerich M, et al. Non-coding recurrent mutations in chronic lymphocytic leukaemia. Nature. 2015;526:519–524. doi: 10.1038/nature14666. [DOI] [PubMed] [Google Scholar]
- Robinson D, Van Allen EM, Wu YM, Schultz N, Lonigro RJ, Mosquera JM, Montgomery B, Taplin ME, Pritchard CC, Attard G, et al. Integrative clinical genomics of advanced prostate cancer. Cell. 2015;161:1215–1228. doi: 10.1016/j.cell.2015.05.001. [DOI] [PMC free article] [PubMed] [Google Scholar]
- Ross-Innes CS, Stark R, Teschendorff AE, Holmes KA, Ali HR, Dunning MJ, Brown GD, Gojis O, Ellis IO, Green AR, et al. Differential oestrogen receptor binding is associated with clinical outcome in breast cancer. Nature. 2012;481:389–393. doi: 10.1038/nature10730. [DOI] [PMC free article] [PubMed] [Google Scholar]
- Spisak S, Lawrenson K, Fu Y, Csabai I, Cottman RT, Seo JH, Haiman C, Han Y, Lenci R, Li Q, et al. CAUSEL: an epigenome- and genome-editing pipeline for establishing function of noncoding GWAS variants. Nature medicine. 2015;21:1357–1363. doi: 10.1038/nm.3975. [DOI] [PMC free article] [PubMed] [Google Scholar]
- Strahl BD, Allis CD. The language of covalent histone modifications. Nature. 2000;403:41–45. doi: 10.1038/47412. [DOI] [PubMed] [Google Scholar]
- Sur I, Taipale J. The role of enhancers in cancer. Nature reviews Cancer. 2016;16:483–493. doi: 10.1038/nrc.2016.62. [DOI] [PubMed] [Google Scholar]
- Tilley WD, Marcelli M, McPhaul MJ. Expression of the human androgen receptor gene utilizes a common promoter in diverse human tissues and cell lines. The Journal of biological chemistry. 1990;265:13776–13781. [PubMed] [Google Scholar]
- Visakorpi T, Hyytinen E, Koivisto P, Tanner M, Keinanen R, Palmberg C, Palotie A, Tammela T, Isola J, Kallioniemi OP. In vivo amplification of the androgen receptor gene and progression of human prostate cancer. Nature genetics. 1995;9:401–406. doi: 10.1038/ng0495-401. [DOI] [PubMed] [Google Scholar]
- Viswanathan SR, Ha G, Hoff AM, Wala JA, Carrot-Zhang J, Whelan C, Haradhvala N, Freedman S, Reed S, Rhoades J, et al. Structural alterations driving castration-resistant prostate cancer revealed by linked-read genome sequencing. Manuscript submitted. 2018 doi: 10.1016/j.cell.2018.05.036. [DOI] [PMC free article] [PubMed] [Google Scholar]
- Wang J, Zou JX, Xue X, Cai D, Zhang Y, Duan Z, Xiang Q, Yang JC, Louie MC, Borowsky AD, et al. ROR-gamma drives androgen receptor expression and represents a therapeutic target in castration-resistant prostate cancer. Nature medicine. 2016;22:488–496. doi: 10.1038/nm.4070. [DOI] [PMC free article] [PubMed] [Google Scholar]
- Wang LG, Ossowski L, Ferrari AC. Androgen receptor level controlled by a suppressor complex lost in an androgen-independent prostate cancer cell line. Oncogene. 2004;23:5175–5184. doi: 10.1038/sj.onc.1207654. [DOI] [PubMed] [Google Scholar]
- Wang Q, Li W, Zhang Y, Yuan X, Xu K, Yu J, Chen Z, Beroukhim R, Wang H, Lupien M, et al. Androgen receptor regulates a distinct transcription program in androgen-independent prostate cancer. Cell. 2009;138:245–256. doi: 10.1016/j.cell.2009.04.056. [DOI] [PMC free article] [PubMed] [Google Scholar]
- Wang T, Wei JJ, Sabatini DM, Lander ES. Genetic screens in human cells using the CRISPR-Cas9 system. Science (New York, NY) 2014;343:80–84. doi: 10.1126/science.1246981. [DOI] [PMC free article] [PubMed] [Google Scholar]
- Wang Z, Zang C, Rosenfeld JA, Schones DE, Barski A, Cuddapah S, Cui K, Roh TY, Peng W, Zhang MQ, et al. Combinatorial patterns of histone acetylations and methylations in the human genome. Nature genetics. 2008;40:897–903. doi: 10.1038/ng.154. [DOI] [PMC free article] [PubMed] [Google Scholar]
- Weischenfeldt J, Dubash T, Drainas AP, Mardin BR, Chen Y, Stutz AM, Waszak SM, Bosco G, Halvorsen AR, Raeder B, et al. Pan-cancer analysis of somatic copy-number alterations implicates IRS4 and IGF2 in enhancer hijacking. Nature genetics. 2017;49:65–74. doi: 10.1038/ng.3722. [DOI] [PMC free article] [PubMed] [Google Scholar]
- Winter GE, Buckley DL, Paulk J, Roberts JM, Souza A, Dhe-Paganon S, Bradner JE. DRUG DEVELOPMENT. Phthalimide conjugation as a strategy for in vivo target protein degradation. Science (New York, NY) 2015;348:1376–1381. doi: 10.1126/science.aab1433. [DOI] [PMC free article] [PubMed] [Google Scholar]
- Yu YP, Ding Y, Chen R, Liao SG, Ren BG, Michalopoulos A, Michalopoulos G, Nelson J, Tseng GC, Luo JH. Whole-genome methylation sequencing reveals distinct impact of differential methylations on gene transcription in prostate cancer. Am J Pathol. 2013;183:1960–1970. doi: 10.1016/j.ajpath.2013.08.018. [DOI] [PMC free article] [PubMed] [Google Scholar]
- Zhang X, Choi PS, Francis JM, Gao GF, Campbell JD, Ramachandran A, Mitsuishi Y, Ha G, Shih J, Vazquez F, et al. Somatic super-enhancer duplications and hotspot mutations lead to oncogenic activation of the KLF5 transcription factor. Cancer discovery. 2017 doi: 10.1158/2159-8290.CD-17-0532. [DOI] [PMC free article] [PubMed] [Google Scholar]
- Zhang X, Choi PS, Francis JM, Imielinski M, Watanabe H, Cherniack AD, Meyerson M. Identification of focally amplified lineage-specific super-enhancers in human epithelial cancers. Nature genetics. 2016;48:176–182. doi: 10.1038/ng.3470. [DOI] [PMC free article] [PubMed] [Google Scholar]
- Zhang Y, Liu T, Meyer CA, Eeckhoute J, Johnson DS, Bernstein BE, Nusbaum C, Myers RM, Brown M, Li W, et al. Model-based analysis of ChIP-Seq (MACS) Genome Biol. 2008;9:R137. doi: 10.1186/gb-2008-9-9-r137. [DOI] [PMC free article] [PubMed] [Google Scholar]
Associated Data
This section collects any data citations, data availability statements, or supplementary materials included in this article.
Supplementary Materials
Figure S1: Putative AR enhancer demonstrates features consistent with a prostate cancer specific regulatory element, Related to Figure 1
(A) Correlation between AR gene copy number (x-axis) and enhancer copy number (y-axis). Each green symbol represents a metastatic CRPC tumor derived from 60 men (149 tumors); data from (Kumar et al., 2016). The area of the green symbols represents AR expression levels. Panels to the left and the right are examples of individual copy number plots where the x-axis is chromosome position and the y-axis represents copy number. The vertical red lines show the location of the candidate enhancer and the vertical green lines show the location of the AR gene.
(B) DNaseI hypersensitivity tracks in ENCODE cell lines reveal that the AR enhancer is cell type specific. Overlay of DHS signal from 104 cell lines in ENCODE in a 1.2 Mb region encompassing the AR enhancer. LNCaP is the only prostate cell line among the 104 lines.
(C) Conserved CTCF binding sites centromeric to the AR enhancer region (red box) and telomeric to the AR transcription start site (red line) as demonstrated by comparison of CTFC ChIP-seq from LNCaP cells and overlay from 52 ENCODE cell lines. Conserved CTCF binding is a common feature of topological associating domains.
Figure S2: Validation of AR enhancer screens and AR rescue experiments, Related to Figure 3
(A) Design of competition assay to validate gRNAs targeting Cas9 to AR enhancer. LNCaP cells are stably transduced to express either firefly or Renilla luciferase for monitoring in a competition assay (Giacomelli et al., 2018). The different isogenic lines are transduced separately with Cas9 and different gRNAs and mixed in a 1:1 ratio. Following serial passaging, the relative abundance of each gRNA is determined by measuring the ratio of firefly luciferase to Renilla luciferase using Promega Dual-Glo assay.
(B) Relative proliferation of LNCaP cells in competition assay following transduction of indicated gRNAs versus a nontargeting gRNA control. Ratio of firefly to Renilla luciferase activity is normalized to nontargeting gRNA. A gRNA targeting the essential gene U2AF1 is used as a positive control. Experiment was repeated switching the firefly and Renilla luciferase (right). Data represent the average and standard deviation of 3 biological replicates, and significance determined by Student’s t test, * p < 0.05, ** p < 0.01.
(C) T7 Endonuclease I assay for top scoring Cas9 screen gRNAs in order to demonstrate cleavage efficiency.
(D) H3K27ac at second DHS peak of AR enhancer as determined by ChIP qPCR following transduction of KRAB-dCas9 and indicated gRNAs. Primers that amplify regions outside of the AR enhancer were used as controls (Control_1 and Control_2).
(E) Recruitment of KRAB-dCas9 to AR enhancer suppresses AR transcriptional targets. Expression of genes upregulated by AR (KLK3 and TMPRSS2) and downregulated (AMIGO2 and PLD1) as measured by qRT-PCR following transduction of KRAB-dCas9 and indicated gRNAs. Transduction of gRNA targeting the unrelated gene HPRT1, and nontargeting gRNA (NT) were used as controls. AR expression was normalized to nontargeting gRNA. Data represent the average and standard deviation of 3 biological replicates, and significance determined by Student’s t test. * p < 0.05, ** p < 0.01
(F) Exogenous expression of AR rescues suppression of AR enhancer. Expression of KLK3 and PLD1 as measured by qRT-PCR after transduction of LNCaP cells or LNCaP cells expressing exogenous AR (LNCaP-AR) with KRAB-dCas9 and indicated gRNAs. Transduction of gRNA targeting the unrelated gene HPRT1, and nontargeting gRNA (NT) were used as controls. Expression is normalized to nontargeting gRNA. Data represent the average and standard deviation of 3 biological replicates, and significance determined by Student’s t test. * p < 0.05, ** p< 0.01.
(G) Exogeneous AR expression is unaffected by suppression of endogenous AR enhancer. Expression of endogenous AR or exogenous AR in LNCaP-AR cells as measured by qRT-PCR after transduction with KRAB-dCas9 and indicated gRNAs demonstrate suppression of AR enhancer is specific for endogenous AR mRNA. Transduction of gRNA targeting the unrelated gene HPRT1, and nontargeting gRNA (NT) were used as controls. Expression is normalized to nontargeting gRNA. Data represent the average and standard deviation of 3 biological replicates, and significance determined by Student’s t test. ** p< 0.01.
Figure S3: AR enhancer knock-in is acetylated, Related to Figure 4
H3K27Ac at AR enhancer as determined by ChIP-QPCR. Results are expressed as % input normalized to nonamplified control region. Primers that amplify regions outside of the AR enhancer were used as controls (Control_1 and Control_2). Data represent the average and standard deviation of 3 biological replicates, and significance determined by Student’s t test. * p < 0.05.
Figure S4: Multiple transcription factors relevant to prostate biology bind to the AR enhancer, Related to Figure 5
(A) Tracks depict binding of indicated transcription factors to the AR enhancer in LNCaP cells as determined by ChIP-seq data downloaded from the Cistrome Data Browser (URL: cistrome.org/db) accessed on November 2017 (Mei et al., 2017).
(B) Summary table of ChIP-seq results from (A) including total number of peaks and whether a peak in the enhancer was called as significant.
(C) Representative tracks of histone modifications. Histone modifications (H3K27ac, H3K4me2, H3K27me3) in primary prostate tissue samples as determined by ChIP-seq at the HoxD cluster to confirm technical success of experiment and data quality.
Figure S5: Proposed model for AR enhancer activation in CRPC, Related to Figure 5
Table S1: CRISPR Screening Library Sequences and Results, Related to STAR Methods