

SUMMARY
Visceral adipose tissue (VAT) hosts a population of regulatory T (Treg) cells, with a unique phenotype, that controls local and systemic inflammation and metabolism. Generation of a T-cell receptor transgenic mouse line, wherein VAT Tregs are highly enriched, facilitated study of their provenance, dependencies, and activities. We definitively established a role for T-cell receptor specificity, uncovered an unexpected function for the primordial Treg transcription-factor, Foxp3, evidenced a cell-intrinsic role for interleukin-33 receptor, and ordered these dependencies within a coherent scenario. Genesis of the VAT-Treg phenotype entailed a priming step in the spleen, permitting them to exit the lymphoid organs and surveil nonlymphoid tissues, and a final diversification process within VAT, in response to microenvironmental cues. Understanding the principles of tissue-Treg biology is a prerequisite for precision-targeting strategies.
Keywords: Immunometabolism, Immunoregulation, Regulatory T cell, Adipose tissue, Foxp3, IL-33, TCR transgenic mice, PPARγ
Graphical Abstract
INTRODUCTION
Regulatory T (Treg) cells, in particular the Foxp3+CD4+ subset, are critical elements of an organism’s defense against pathogens, responsible for reining in an over-exuberant immune response. In lymphoid organs such as the spleen and lymph nodes (LNs), Treg cells usually constitute 10–20% of the CD4+ T cell compartment. Until recently, our vision of Treg biology was heavily colored by information derived from this circulating pool and its response to an infectious or inflammatory insult.
However, it has become increasingly clear that Treg cells can also accumulate in a variety of nonlymphoid tissues, where they exert both anti-inflammatory and homeostatic functions (Panduro et al., 2016). A paradigmatic “tissue-Treg” population is that found in visceral adipose tissue (VAT) of male mice (Feuerer et al., 2009). VAT-Treg cells, which increase with age to as high as 60–80% of the local CD4+ T cell compartment, have a transcriptome distinct from those of lymphoid-organ and other nonlymphoid-tissue Treg populations (Feuerer et al., 2009; Cipolletta et al., 2015; Panduro et al., 2016). This unique phenotype depends critically on the nuclear receptor family member, PPARγ (Cipolletta et al., 2012), the “master-regulator” of adipocyte differentiation. VAT-Treg cells display a clonally expanded repertoire of antigen-specific receptors [T cell receptors (TCRs)] (Feuerer et al., 2009; Kolodin et al., 2015), suggestive of a response to one or more local antigens (Ags). According to several lines of evidence, these cells regulate local and systemic metabolic indices through a combined effect on both immunocytes and adipocytes (Feuerer et al., 2009; Vasanthakumar et al., 2015). While these studies (and others) concurred in attributing insulin-sensitizing effects to VAT Tregs in 25–35wk-old mice on lean chow, a recent study reported an opposing influence in old mice aged 55–110wks (Bapat et al., 2015).
Progress has been made in elucidating the provenance, dependencies and activities of VAT-Treg cells (Panduro et al., 2016), but a major stumbling block has been their rarity (~5000/mouse), exacerbated by an inopportune localization (within fat, classically toxic to T cells during isolation and culture). Hence, certain critical issues have remained unresolved, notably: what molecular and cellular factors drive VAT-Treg accumulation? and when, where, and how is the unique VAT-Treg phenotype established? To address these questions, we side-stepped the aforementioned experimental difficulties by engineering a transgenic (tg) mouse line carrying the pre-rearranged Tcra and Tcrb genes of an expanded VAT-Treg clone. These mice hosted an exaggerated population of VAT Tregs, the great majority of which expressed the transgene-encoded TCR chains, and had a substantially improved metabolic tenor. This model permitted us to definitively establish a role for TCR specificity, uncover an unexpected function for Foxp3, and evidence a cell-intrinsic role for the interleukin(IL)-33 receptor in VAT-Treg accumulation in adipose tissue. We also demonstrated that the definitive VAT-Treg phenotype emerged only in cells within adipose tissue, via a two-stage, two-site process.
RESULTS
Production and validation of vTreg53, a VAT-Treg TCR-tg mouse line
A VAT-Treg TCR-tg mouse line should afford several advantages: more VAT Tregs, a more homogeneous population, and identifiable precursors potentially accessible in the lymphoid organs. We previously identified multiple clones in the epididymal VAT-Treg population of 25–30wk-old C57BL/6J (B6) mice (Kolodin et al., 2015). Our primary criteria in choosing one of them for the generation of a TCR-tg line were the extent of its expansion and the availability of monoclonal antibodies (mAbs) specific for each of its TCR chains. Clone 53, which constituted 10% of the VAT-Treg population in one of the mice, expressed a TCR comprised of chains carrying the Vα2 and Vβ4 variable regions, for which mAbs are commercially available. Genomic DNA constructs encoding each of the chains were co-injected into B6 mouse embryos, and a VAT-Treg TCR-tg line (vTreg53) expressing both chains was derived and expanded.
In 20wk-old male Tg+ mice, both the frequency and number of total Tregs in VAT, but not in the spleen, were significantly elevated compared with corresponding values for Tg− littermates (Fig. 1A). Within the TCR-tg mice, there was a strong enrichment for clonotype+ Treg, but not Tconv, cells in VAT (vis-à-vis the spleen) (Fig. 1B). This augmentation was not seen for Tregs in most other nonlymphoid tissues (colon, lung, liver) of Tg+ mice; a slight increase in the fraction (though not number) for muscle Tregs most likely reflects fat marbling within that tissue (Fig. S1A). Of the various adipose depots, epididymal VAT hosted the greatest concentration of total and clonotype+ Treg cells, more so than ovarian VAT or peri-renal and subcutaneous adipose tissue (SAT) from either sex (Fig. 1C). Already at 5wks, clonotype+ Tregs were enriched in VAT of male Tg+ mice, a differential that increased with age (Fig. S1B, upper). In contrast, there were minimal age-related changes in the contribution of clonotype+ Tconv cells in VAT or spleen (Fig. S1B, lower). VAT Treg cells arise in the thymus during the first weeks of life (Kolodin et al., 2015); Vα2+Vβ4+ Tregs were most efficiently generated in the thymus of TCR-tg mice during this time-period (Fig. S1C), after which Tregs with secondary (i.e. non-tg) TCR rearrangements presumably began to emerge.
Figure 1. Characterization and validation of the vTreg53 TCR-tg mouse model.

(A, B) Flow cytometric analyses of Treg and Tconv cells from 20wk-old Tg− and Tg+ male mice (n≥10). A) Frequencies and numbers of total Tregs. B) Frequencies of Vα2+Vβ4+ cells.
(C) Numbers of total (left) and Vα2+Vβ4+ (right) Treg cells in various fat depots from 18wk-old Tg− and Tg+ mice (n=5).
(D) PPARγ expression in Tregs from 20wk-old Tg− and Tg+ Pparg-TdtKI/+Foxp3-GFPKI/y male mice (n≥7).
(E) Volcano plot comparing gene expression of Vα2hiVβ4hi VAT and splenic Tregs from 20wk-old Tg+ Foxp3-GFPKI/y male mice (n=3). VAT Treg signature genes (Cipolletta et al., 2015) are highlighted in red (induced) or blue (repressed). The number of genes from each signature preferentially expressed by one or the other population are shown at the top.
(F) Frequencies (left) and numbers (right) of inflammatory macrophages from 14–16wk-old Tg− and Tg+ male mice (n≥5). Exemplar dot-plots appear in Fig. S2E.
(G, H) Metabolic indices for 14–16wk-old Tg− and Tg+ male mice (n≥5). G) Intraperitoneal insulin-tolerance test (ITT). H) Intraperitoneal glucose-tolerance test (GTT). Data represent two independent experiments.
Summary plots show data pooled from two to four independent experiments. Mean ±SD. Spl, spleen; VAT, visceral adipose tissue; eVAT, epididymal VAT; pVAT, peri-renal VAT; oVAT, ovarian VAT; iSAT, inguinal subcutaneous adipose tissue; Tdt, Td-tomato; AU, arbitrary units. See also Fig. S1, S2 and Table S1.
Similar conclusions came from studying vTreg53 TCR-tg mice of Rag−/− genotype in order to avoid secondary rearrangements at the endogenous Tcrα and/or Tcrb loci (S1D, E). Treg frequencies in VAT and SAT were similar, but the density was much higher in the former case.
A major driver of the VAT-Treg phenotype is PPARγ (Cipolletta et al., 2012). Unfortunately, no existing anti-PPARγ mAb is suitable for histologic or flow-cytometric analyses. Therefore, we generated a PPARγ-reporter mouse line by introducing an IRES-Tdtomato (Tdt) cassette at the beginning of the 3′ UTR of the Pparg locus. The resulting allele reports expression of both the PPARγ1 and PPARγ2 isoforms (Fig. S2A). We crossed Pparg-Tdt and Foxp3-GFP reporter alleles into the vTreg53 TCR-tg line to allow us to follow the emergence and accumulation of true VAT-Treg cells. In clear contrast to the spleen, the vast majority (~80%) of Tregs in VAT from 20wk-old non-tg mice expressed the PPARγ reporter (Fig. 1D). This value rose even higher (to ~98%) in clonotype+ VAT Tregs from TCR-tg littermates, while it sank (to ~35%) in corresponding clonotype− cells. Similar results were obtained using mAbs to quantify expression of three additional proteins reported to preferentially mark VAT Tregs: ST2, KLRG1 and GATA3 (Feuerer et al., 2009; Cipolletta et al., 2012; Vasanthakumar et al., 2015; Kolodin et al., 2015) (Fig. S2B). Some PPARγ+ Treg cells were found in muscle and the liver, but levels remained well below those in VAT (Fig. S2C). For a global perspective, we used RNA-seq to compare the gene-expression profiles of clonotypehi splenic and VAT Tregs from 20wk-old Tg+ Foxp3-GFP reporter mice. The previously defined VAT-Treg up-signature (Cipolletta et al., 2015) was highly over-represented in TCR-tg VAT Tregs, whereas the down-signature was strongly under-represented (Fig. 1E).
VAT-Treg cells improve insulin sensitivity and other metabolic indicators through effects on local adipocytes and immunocytes, particularly macrophages (MFs) (Feuerer et al., 2009; Vasanthakumar et al., 2015). Corresponding to elevated frequencies and numbers of VAT Tregs in TCR-tg vs non-tg littermates at 14–16wks of age (Fig. S2D), the frequencies and numbers of VAT CD11chiCD11bhi inflammatory MFs were significantly reduced (Figs. S2E, 1F), as was expression of most of a panel of inflammatory gene markers (Fig. S2F). The body and VAT weights of Tg+ and Tg− littermates were comparable (Fig. S2G). Nonetheless, the Tg+ mice showed significantly improved insulin sensitivity (Fig. 1G), glucose tolerance (Fig. 1H), and homeostatic model assessment of insulin resistance (HOMA-IR) values (Fig. S2H).
In brief, we were successful at generating a VAT-Treg TCR-tg mouse line with an enriched Treg population specifically in epididymal adipose tissue, dominated by bona fide VAT Tregs displaying the transgene-encoded Vα2+Vβ4+ TCR specificity. vTreg53 TCR-tg mice showed substantially improved inflammatory and metabolic indices.
Accumulation of VAT-Treg cells is dependent on the TCR specificity
The specific enrichment of Treg cells in VAT of male vTreg53 TCR-tg mice, including those on a Rag−/− background, argued that the TCR specificity had an important influence on VAT-Treg accumulation. In support of this notion, a higher fraction of clonotype+ than clonotype− Treg cells in the TCR-tg mice were cycling, as estimated from Ki67 staining (Fig. 2A); and clonotype+ Treg cells had a longer half-life, assessed from BrdU long-term-incorporation followed by chase experiments (Fig. 2B).
Figure 2. TCR specificity was a critical driver of VAT Treg accumulation.

(A, B) Proliferation and decay rate of clonotype− (non-Vα2+Vβ4+) and clonotype+ (Vα2+Vβ4+) VAT Treg cells. A) Frequencies of Ki67+ VAT Treg cells from 10wk-old Tg+ male mice (n=6). Data for Vα2+Vβ4+ VAT Tregs also appear in Fig. 3E. B) 10wk-old Tg+ male mice were given BrdU in the drinking water for 4 weeks, and BrdU+ VAT Treg cells were detected at various time points after drug removal (n≥3).
(C–E) CD4+ T cells from pooled spleen and LNs of Tg− or Tg+ CD45.2+ male mice were iv-transferred into B6.CD45.1+ male mice. C) Frequencies and numbers of CD45.2+ Treg cells at 12wks after transfer (n=5). D) Frequencies of Vα2+Vβ4+ cells in CD45.2+ TCR-tg Treg cells at 12wks after transfer (n=5). E) Time course analysis following transfer of TCR-tg CD4+ T cells (n=5).
(F) Treg cells sorted from Tg− and Tg+ CD45.2+ Foxp3-GFPKI/y male mice were transferred into B6.CD45.1+ male mice. Frequencies and numbers of CD45.2+ Treg cells at 12wks after transfer (n≥7).
(G) PPARγ (above) and ST2 (below) expression in Tconv cells from 20wk-old Tg− and Tg+ Pparg-TdtKI/+Foxp3-GFPKI/y male mice (n≥6).
(H, I) Experimental set-up as per panels C–E. H) Frequencies of CD45.2+ cells in Tconv cells at 12wks after transfer (n=5). I) Time course analysis following transfer of TCR-tg CD4+ T cells (n=5).
(J, K) Tconv cells sorted from Tg− and Tg+ CD45.2+ Foxp3-GFPKI/y male mice were transferred into B6.CD45.1+ male mice. J) Frequencies of CD45.2+ cells in CD4+ T cells at 12wks after transfer (n=5). K) Frequencies of Treg cells converted from CD45.2+ Tconv cells at 12wks after transfer (n=5).
Summary plots show data pooled from two to four independent experiments. Mean ± SD.
To address this issue in a more definitive manner, we turned to adoptive-transfer approaches. Administration of total CD4+ T cells from pooled spleen and LNs of male CD45.2+ Tg− mice into male B6.CD45.1+ recipients resulted in insignificant accumulation of the polyclonal donor Tregs in spleen, VAT, or SAT 12wks later (Fig. 2C). In contrast, contemporaneous transfer of CD4+ T cells from Tg+ littermates engendered a robust donor Treg population in VAT, though not in spleen or SAT (Fig. 2C). There was a strong enrichment of clonotype+ Tregs in the donor-derived VAT (compared with spleen) population; the few TCR-tg Treg cells recovered in SAT were also enriched for those displaying high levels of Vα2+Vβ4+ TCRs (Fig. 2D). Tg+ donor Treg cells accumulated in VAT progressively over time, beginning at about 4wks after administration (Fig. 2E). Transfer of Foxp3+CD4+ Treg cells isolated from TCR-tg donors recapitulated the effect of administering total CD4+ T cells (Fig. 2F). These findings definitively established that the TCR specificity was a critical driver of Treg accumulation in VAT: Treg cells displaying the vTreg53 specificity were much more “VATophilic” than were polyclonal Tregs.
Accumulation of CD4+ T-cells in VAT depends on Foxp3
Although Foxp3−CD4+ Tconv cells in the TCR-tg mice expressed the vTreg53 TCR specificity, they did not accumulate in VAT like Foxp3+CD4+ Treg cells did (Fig. 1A, B). Moreover, only a small fraction of the few Tconv cells recovered from VAT expressed PPARγ and ST2 (Fig. 2G), factors that promote specific accumulation of Tregs at that site (Cipolletta et al., 2012; Kolodin et al., 2015). TCR-tg Tconv cells were also not enriched in VAT 12wks after transfer of CD4+ T cells from pooled lymphoid organs of male CD45.2+ Tg+ mice into male B6.CD45.1+ recipients (Fig. 2H). The lack of VAT accumulation was not a matter of timing: the representation of transferred TCR-tg Tconv cells in the spleen peaked a few days after their administration and then crashed, while they occurred at low levels for at least 12wks in VAT and SAT (Fig. 2I). Introduction of Tconv cells sorted from pooled lymphoid organs of TCR-tg mice also failed to engender a robust VAT-Tconv population 12wks later (Fig. 2J). Nor did the transferred cells convert to VAT Tregs (Fig. 2K).
Foxp3 is the most important transcription factor (TF) distinguishing Treg and Tconv cells, although it actually accounts for less than half of the classical Treg signature (Hill et al., 2007). To determine whether Foxp3 might somehow arm Tconv cells for accumulation in VAT, we retrovirally transduced an empty expression vector or one carrying a Foxp3 cDNA into Tconv cells from pooled lymphoid organs of CD45.2+ Tg+ donors and transferred them into B6.CD45.1+ recipients. 8wks later, there was a preferential accumulation of Foxp3-transduced but not control-transduced cells in VAT though not in the spleen (Fig. 3A). The kinetics of enrichment were very similar to those observed for Treg accumulation after transfer of total CD4+ T cells from TCR-tg mice (compare Figs. 3B and 2E).
Figure 3. Foxp3 expression was important for accumulation of CD4+ T cells in VAT.

(A–D) Tconv cells from Tg+ CD45.2+ Foxp3-GFPKI/y male mice were transduced with indicated retrovirus and transferred into B6.CD45.1+ male mice. A) Frequencies of CD45.2+ cells in CD4+ T cells at 8wks after transfer (n≥5). B) Time course analysis after transfer of Foxp3-transduced cells (n≥4). C) FC/FC plots comparing gene-expression values in 10wk-old Tg+ Vα2hiVβ4hi splenic Treg vs Tconv cells (x-axis) with Tg+ Vα2hiVβ4hi Tconv cells transduced with a Foxp3-expression vector vs an empty vector control, sorted from spleens of recipient B6.CD45.1 male mice 1wk after transfer (y-axis). D) FC/FC plot comparing gene-expression values in 10wk-old Tg+ Vα2hiVβ4hi VAT vs splenic Tregs (x-axis) and Tg+ Vα2hiVβ4hi Foxp3-transduced Tconv cells sorted from VAT vs spleens of recipient B6.CD45.1 male mice 6wks after transfer. VAT Treg signature genes are highlighted in red (induced) or blue (repressed).
(E) Frequencies of Ki67+ cells in 10wk-old Tg+ mice (n=6). Data for Vα2+Vβ4+ VAT Tregs were also shown in Fig. 2A.
(F) PPARγ− Tconv cells from Tg+ CD45.2+ Pparg-TdtKI/+Foxp3-GFPKI/y male mice were transduced and transferred as in panel A. Frequencies of PPARγ(Tdt)+ cells at 8wks after transfer (n≥4).
(G) Experimental set-up as per panel A. Frequencies of ST2+ cells at 8wks after transfer (n=5).
(H) Experimental set-up as per panel A except that cells were transduced with different retrovirus as indicated. Frequencies of CD45.2+ cells in CD4+ T cells at 8wks after transfer (n≥5).
Summary plots show data pooled from two to four independent experiments. Mean ± SD. ND, not detectable.
To explore what functions might be endowed by expression of Foxp3 in ex vivo Tconv cells, we sorted Foxp3-transduced and control-transduced Vα2hiVβ4hi CD4+ T cells recovered from the spleen of recipient mice 1wk after transfer and performed RNA-seq analysis. As anticipated (Hill et al., 2007), a fold-change/fold-change (FC/FC) plot revealed that only a subset of the loci up-regulated at least two-fold in Tg+ splenic Treg vs Tconv cells (genes on the right side of the plot) was also up-regulated by Foxp3 expression in ex vivo Tconv cells (genes in the upper-right section of the plot) (Fig. 3C). Interestingly, once the Foxp3-transduced Tconv cells were installed in VAT (6wks post-transfer), they had up-regulated essentially the entire VAT Treg signature (Fig. 3D).
To address the relevance of differential cycling-gene transcription (Fig 3C), we stained T cell populations from 10wk-old TCR-tg mice with the cell-cycle marker, Ki67. Clonotype+ Treg cells cycled more actively in VAT than in spleen or SAT (Fig. 3E). At all three of these sites, clonotype+ Tconv cells were in cycle significantly less frequently than were their clonotype+ Treg counterparts.
Notably, Foxp3-transduced Tconv cells near-universally expressed PPARγ and ST2 within VAT (Fig. 3F, G). Since these two factors promote Treg accumulation specifically in VAT, we asked whether transduction of either one of them alone could replace Foxp3. This proved not to be the case (Fig. 3H). Thus, quite unexpectedly, Foxp3 is also essential for T cell enrichment in VAT, upstream of PPARγ and ST2.
VAT-Treg cells rely on cell-intrinsic IL-33 signaling
Two groups have argued that IL-33 has a substantial and direct influence on VAT Treg accumulation (Vasanthakumar et al., 2015; Kolodin et al., 2015); however, another group maintained that any influence of IL-33 on VAT Treg cells was primarily indirect, operating via an innate lymphoid cell (ILC)-2 intermediate (Molofsky et al., 2015). None of these studies examined mice with a Treg-specific ablation of the IL-33 receptor, ST2 (encoded by Il1rl1), and all were confounded by potential replacement of bona fide VAT Treg cells with lymphoid-organ Tregs circulating through and pausing within an empty VAT compartment. Therefore, we generated vTreg53 TCR-tg mice with a homozygous Il1rl1-null mutation specifically in Treg cells. There was a clear, though not complete, loss of clonotype+ VAT Tregs in the mutant TCR-tg mice; and the few clonotype+ SAT Tregs were reduced to even lower levels (Fig. 4A). No significant loss of Tregs was detected in the spleen of the same mice (Fig. 4A). Nor was there a change in the representation of VAT ILC-2s (Fig. S3A). Loss of ST2 in Treg cells from non-tg littermates also resulted in a significant reduction in VAT Tregs (Fig. S3B).
Figure 4. IL-33 was also required for VAT Treg accumulation.

(A) Frequencies and numbers of KLRG1+ Vα2+Vβ4+ Treg cells from 10wk-old Tg+Il1rl1+/+Foxp3-Cre and Tg+Il1rl1f/fFoxp3-Cre male littermates (n=4).
(B–D) IL-33 expression in VAT vs SAT of 8–10wk-old male B6 mice. B) PCR quantification of Il33 transcripts in whole tissue (n=4). C,D) Flow cytometric quantification of the frequencies (C) and numbers (D) of IL-33+ stromal cells (n=8).
(E) Fraction ST2+ of clonotype+ Treg cells in 10wk-old Tg+ males (n=5).
Summary plots show data pooled from two to three independent experiments. Mean ± SD. SVF, stromal vascular fraction. See also Fig. S3.
We asked whether the relative dearth of Treg cells in SAT vis-à-vis VAT might reflect a reduction in the level of this cytokine alarmin. Quantification of Il33 transcripts in whole adipose tissue (Fig. 4B), the percentage of stromal vascular fraction (SVF) cells expressing IL-33 (Fig. 4C), and the number of IL-33+ mesenchymal stromal cells (Fig. 4D) in 8–10wk-old mice all pointed to reduced IL-33 expression in SAT. In concert with this finding, as well as past observations of a feed-back loop (Schiering et al., 2014), SAT Treg cells displayed levels of the IL-33 receptor lower than those of VAT Tregs (Fig. 4E).
In brief, we can now state without equivocation that accumulation of Treg cells in epididymal VAT depends to a substantial degree on a direct effect of IL-33. This finding does not rule out an additional, indirect, effect of IL-33-responding ILC2s on Tregs.
PPARγ-reporter mice reveal two-step, two-site acquisition of the VAT-Treg phenotype
When, where, and how the definitive phenotype of VAT-Treg cells is acquired are important questions that have been difficult to answer, first, because of the heterogeneity of the Foxp3+CD4+ population in VAT, hosting both true VAT Tregs and circulating Tregs that display a diversity of TCR specificities (Cipolletta et al., 2015; Kolodin et al., 2015); and, second, because there has been no accessible marker for tagging VAT-Treg precursors.
As concerns when: flow-cytometric analysis indicated that cells with a VAT-Treg phenotype were present in Tg+ mice from an early age (Fig. 5A), consistent with our previous, more indirect, arguments (Kolodin et al., 2015). Certain of the phenotypic markers known to distinguish VAT and spleen Treg cells (e.g. ST2) were expressed in clonotype+ VAT Tregs at near-maximum frequencies already at 5wks of age (the earliest time-point we could examine), while others (e.g. PPARγ, KLRG1) showed a substantial increase with age. In both cases, the fraction of marker-positive VAT-Treg cells was higher in Tg+ than Tg− littermates.
Figure 5. The VAT Treg phenotype was acquired in two stages.

(A) Frequencies of PPARγ+, ST2+, and KLRG1+ cells in Treg cells from Tg− (total Tregs) or Tg+ (Vα2+Vβ4+ Tregs) male mice across various ages (n≥5).
(B) PCA of transcriptomes of Treg cells from various tissues of Tg− (total Tregs) or Tg+ (Vα2hiVβ4hi Tregs) Foxp3-GFPKI/y mice across various ages (n=3).
(C) Volcano plots comparing transcriptomes of Treg cells from Tg− (total Tregs) or Tg+ (Vα2hiVβ4hi Tregs) Foxp3-GFPKI/y male mice across various ages (n=3).
(D) Mean fluorescence intensity (MFI) of PPARγ(Tdt)+ Treg cells from 20wk-old Tg− (total Tregs) or Tg+ (Vα2+Vβ4+ Tregs) Pparg-TdtKI/+ Foxp3-GFPKI/y male mice (n≥7).
(E) FC/FC plots of gene-expression values for Treg cells from 8–10wk-old mice: Tg+ Vα2hiVβ4hi VAT Tregs vs splenic Tregs (x-axis) compared with Tg+ Vα2hiVβ4hi PPARγlo vs PPARγ− splenic Tregs (y-axis) (n=4). VAT Treg signature genes (Left) or those minus CD44hi Treg signature genes (Right) highlighted in red (induced) or blue (repressed). Numbers on the side represent the number of corresponding signature genes induced (right) or repressed (left) in VAT Tregs changed (top and bottom) or not changed (middle) by more than two-fold in PPARγlo compared with PPARγ− splenic Treg cells.
(F, G) 4×10⁵ PPARγ(Tdt)− Tregs from Tg+ CD45.2+ Pparg-TdtKI/+ Foxp3-GFPKI/y male mice were transferred into B6.CD45.1+ male mice. F) Frequencies of CD45.2+ CD4+ T cells and PPARγ(Tdt)+ cells, and MFI of PPARγ(Tdt)+ Treg cells at 8wks after transfer (n=6). G) Time-course analysis (n≥5).
(H) 5×10⁴ PPARγ(Tdt)− or PPARγ(Tdt)+ Treg cells from Tg+ CD45.2+ Pparg-TdtKI/+ Foxp3-GFPKI/y male mice were transferred into B6.CD45.1+ male mice. Numbers of CD45.2+ Vα2+Vβ4+ Treg cells at 4wks after transfer (n=3).
(I, J) 4×10⁵ PPARγ(Tdt)− Tregs were transferred as per panel (F). I) Recipient mice were iv-injected with isotype control or α-MHCII mAb every 3 days for 2wks. J) Recipient mice were i.p.-injected with PBS or IL-33 every 3 days for 2wks. Frequencies of PPARγ(Tdt)+ in donor-derived Tg+ cells from spleen at 2wks after transfer.
Summary plots show data pooled from two to three independent experiments. Mean ± SD. PCA, principal component analysis. See also Fig. S4.
As concerns where: we began with a population-level view. RNA-seq analysis was performed on thymic and splenic Treg cells from 2wk-old TCR-tg and non-tg littermates, as well as on splenic and VAT clonotypehi Tregs from 10wk- and 20wk-old Tg+ and Tg− littermates. Principal component analysis (PCA) indicated that the definitive VAT-Treg phenotype was not achieved until the cells were installed in the epididymal fat depot, and that there was additional evolution of the bulk VAT-Treg transcriptome between 10 and 20wks of age for both Tg+ and Tg− mice (Fig. 5B). At these two ages, the VAT-Treg transcriptome appeared to be slightly different in TCR-tg and non-tg littermates. However, it is not possible to say whether the differences seen with advancing age or with transgene positivity reflect changing transcriptional programs or a higher representation of true VAT-Treg cells (as opposed to circulating Tregs). Importantly, at both 10wks and 20wks of age, the transcriptomes of spleen and VAT-Treg cells appeared to be as different from each other in non-tg mice as they were in TCR-tg littermates, the latter presumably enriched in VAT-destined Treg precursors. In addition, for both mature (20wks-old) and young (2wks-old) mice, there was no enrichment of the VAT up- or down-signature in clonotype+ splenic Tregs from vTreg53 TCR-tg mice vis-à-vis those of their transgene-negative littermates (Fig. 5C, left and center). This finding held for clonotype+ thymic Tregs from 2wk-old TCR-tg mice [a time of active VAT-Treg generation (Fig, S1C)] as well (Fig. 5C, right).
For a single-cell view, we exploited the phenotype-tracing potential of PPARγ-reporter mice. Unexpectedly, a minor fraction of splenic Foxp3+CD4+ cells expressed PPARγ, although at a lower frequency (Fig. 1D) and reduced level (Fig. 5D) in comparison with their VAT counterparts. The representation of PPARγlo cells in the splenic Treg compartment varied little with transgene or clonotype status, consistently at <10%, while the VAT-Treg compartment was enriched in PPARγ expressors only if they were clonotype+ and came from vTreg53 TCR-tg mice (Fig. 1D). This observation evokes the possibility of a limiting niche for the PPARγlo Treg population in the spleen.
To assess to what extent splenic PPARγlo Treg cells had taken on the mantle of true VAT Tregs, we performed RNA-seq analysis. Almost half of the classical VAT-Treg up-signature genes (red) failed to be induced (≥2-fold) in PPARγlo compared with PPARγ− Treg cells from spleens of TCR-tg mice (Fig. 5E, left). Subtraction of an activated (CD44hi) Treg up-signature (Levine et al., 2014) from the uninduced gene-set indicated that only about 10% of it (14/126) was activation-associated (Fig. 5E, right). Instead, there was an enrichment for genes tied to lipid metabolism (e.g. Dgat, Nsdhl, Coq10b, Dhcr24). Those VAT-Treg up-signature genes that were induced in PPARγlo vs PPARγ− splenic Treg cells appeared as an off-diagonal cloud in the FC/FC plot of Fig. 5E (left), indicating that their expression in PPARγlo cells did not attain VAT-Treg levels. Amongst this set of genes were Klrg1, Cd44 and Prdm1, consistent with an activated Treg phenotype. Indeed, 40% of the off-diagonal cloud of VAT-Treg up-signature genes (59/144) disappeared when the activated Treg up-signature was subtracted (Fig. 5E, right). Parallel trends were noted concerning the distribution of VAT-Treg down-signature genes (blue); and overall very similar results were obtained on non-tg littermates (Fig. S4A).
The transcriptomic data argued that the small population of splenic PPARγlo Treg cells had been activated. Indeed, a small fraction of Treg cells from peripheral lymphoid organs has been reported to exhibit an “effector-like” (Cretney et al., 2011) or activated (Levine et al., 2014) phenotype, marked by Prdm1 or Cd44 gene expression, respectively. Furthermore, it has been documented that, upon TCR engagement, lymphoid-organ Tregs show moderate induction of Pparg gene expression (Vasanthakumar et al., 2015). However, it was not known whether the induction reflected an actual increase in Pparg expression by previously PPARγ− cells or, instead, resulted from selective expansion of pre-existing PPARγ+ cells. Therefore, we double-sorted PPARγ− Treg cells from spleens of TCR-tg mice or their non-tg littermates and stimulated them in vitro with anti-CD3/28-coated beads in the presence of IL-2. TCR engagement did, in fact, induce Pparg gene expression by previously PPARγ− splenic Treg cells, regardless of whether they came from Tg− or Tg+ mice (Fig. S4B).
The above findings suggested that part of the VAT-Treg signature, in particular the component induced by cell activation, was already turned on in a subset of the splenic Treg population marked by low levels of PPARγ expression, and was further turned up in VAT; whereas most of the component unique to VAT Tregs was not simply activation-associated, and was not induced until the cells were installed in VAT. To evaluate this scenario, we performed two types of adoptive-transfer experiments. First, we introduced double-sorted PPARγ− Treg cells from pooled lymphoid organs of CD45.2+ Tg+ donors into B6.CD45.1+ recipients. By 8wks post-transfer, a small fraction of clonotype+ donor Treg cells in the spleen had been induced to express low levels of PPARγ, suggestive of activation (Fig. 5F). This low fraction appeared within the first 2wks, and was maintained at this low level over the 2–8wk period examined (Fig. 5G). In contrast, clonotype+ donor Treg cells expressing high levels of PPARγ accumulated in VAT over time starting at around 4wks after transfer; by 8wks, almost all donor Tregs had become PPARγhi at this site (Fig. 5F, G). Thus, lymphoid organ PPARγ− Treg cells can engender both splenic PPARγlo and VAT PPARγhi cells. Second, we directly compared the VAT-seeding potential of PPARγ− and PPARγlo Treg cells isolated from the spleen of TCR-tg mice. Double-sorted cells were pooled from multiple Tg+ mice and transferred into B6.CD45.1 recipients. The PPARγlo Treg cells were clearly superior to PPARγ− Treg cells at giving rise to PPARγhi Tregs in VAT (but not spleen) at 4wks post-transfer (Fig. 5H, lower).
We also asked to what extent the splenic PPARγlo population depended on the factors we found to drive accumulation of PPARγhi Tregs in VAT, i.e. on the TCR, Foxp3 and IL-33. Transfer of double-sorted PPARγ− Treg cells from lymphoid organs of TCR-tg mice into non-tg recipients in the presence of an anti-MHCII-blocking mAb greatly reduced accumulation of the PPARγlo Treg population that usually installed in the spleen 2wks after administration (Fig. 5I), pointing to a requirement for TCR:MHCII interactions. In contrast, a parallel transfer in the presence of exogenous IL-33 (and absence of anti-MHCII mAb) strongly promoted accumulation of the splenic PPARγlo Treg population (Fig. 5J). Lastly, the splenic PPARγlo population also depended on Foxp3 expression, evidenced by the fact that transfer of lymphoid-organ Tconv cells from TCR-tg mice did not engender PPARγlo splenic CD4+ T cells in the absence of Foxp3 transduction (Fig. 3F).
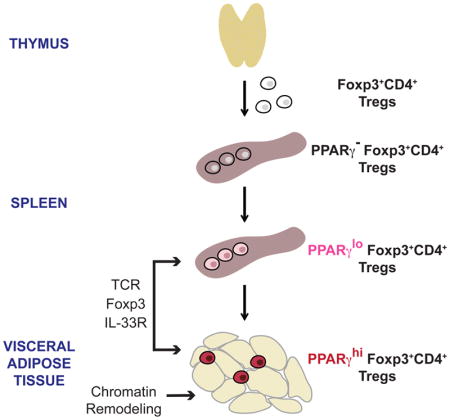
Overall, the data argued for a two-stage scenario for VAT-Treg diversification. Treg cells displaying a VATophilic TCR were initially induced to express low levels of PPARγ and a slice of the VAT-Treg signature within the spleen, but did not take on the definitive VAT-Treg phenotype until installed in adipose tissue.
scRNA-seq and ATAC-seq data also pointed to a two-step, two-site model
scRNA-seq provided an orthogonal approach to addressing where VAT-Treg cells diversify. Splenic and VAT Tregs were sorted from 20wk-old TCR-tg (Vα2hiVβ4hi Tregs) or non-tg (total Tregs) littermates, and single cells from each of the four sorted populations were encapsulated and prepped for RNA sequencing using the InDrop platform (Zilionis et al., 2017). A total of 4,945 single Treg cells was ultimately analyzed (see quality-control details in STAR methods. Compiled data were visualized using t-Distributed Stochastic Neighbor Embedding (t-SNE), which permits dimensionality reduction. K-means clustering distinguished seven Treg groupings (Fig. 6A). Splenic Treg cells were encompassed mainly within three groups (black, red, and green), while VAT Tregs fell mostly within five groups (green, yellow, turquoise, brown, and blue). Importantly, the pattern of Nur77 expression, a well-established correlate of TCR signal-strength (Moran et al., 2011), was essentially indistinguishable in TCR-tg vs non-tg single Treg cells (Fig. 6B).
Figure 6. Single-cell RNA-seq data also argued for Treg phenotypic finalization in VAT.

(A–E) scRNA-seq analysis of splenic and VAT Tregs from 20wk-old Tg− (total Tregs) or Tg+ (Vα2hiVβ4hi Tregs) Foxp3-GFPKI/y mice. A) Left: two-dimensional t-SNE plot of all of the single-Treg transcriptomes. Right: disentangled t-SNE plots of the indicated single-Treg datasets. B) Heat-map of Nr4a1 expression overlain on the t-SNE plot of panel A. C) Cardinal VAT-Treg transcripts. Left: An expression heat-map of the VAT Treg signature overlain on the t-SNE plot of panel A. Center: as per the left panel, but data from splenic Tregs of Tg− (above) or Tg+ (below) mice were distilled out. Right: same t-SNE plot with cells expressing diagnostic VAT-Treg signature genes highlighted in red. D) Cell-density differential between single-Treg profiles of Tg− and Tg+ mice. E) Heat-map showing relative expression of the indicated genes across the five major VAT-Treg clusters.
(F, G) VAT Treg cells from 20wk-old Tg− or Tg+ Foxp3-GFPKI/y male mice (n≥6): F) Frequencies of ST2hiCD69med/hi cells; G) Frequencies of ST2loCXCR3hi cells.
(H) Frequencies of IFNγ+ Tconv cells from 20wk-old Tg− and Tg+ Foxp3-GFPKI/y male mice following 3.5hrs of stimulation with PMA and ionomycin (n≥6).
Summary plots show data pooled from two to three independent experiments. Mean ± SD.
Superimposing the VAT-Treg signature onto the t-SNE plot of the compiled data, in heat-map mode, revealed strong induction in the four VAT-dominated clusters, in particular in the turquoise and brown groups; weak induction in VAT:spleen-bridging clusters, mainly in the green group but also in some cells within the blue and black groups; and minimal expression in the bulk of cells in the two spleen-dominated clusters (Fig. 6C, left). To focus on potential splenic precursors of VAT Treg cells, we split out the heat-map data on splenic Tregs (Fig. 6C, center). For both Tg+ and Tg− mice, about 6% of the cells showed weak, but detectable, expression of the VAT Treg signature, a value quite similar to the <10% splenic PPARγlo Treg cells documented above (Fig. 1D). Similarly, diagnostic VAT transcripts – e.g. Pparg and IL1rl1 – were largely restricted to the four VAT-dominated clusters, although there were a few positive cells in the VAT:spleen-bridging clusters as well (Fig. 6C, right).
Next, we rationalized that a direct comparison of the scRNA-seq profiles of Tregs from Tg− and Tg+ mice could prove illuminating because, expressing both Foxp3 and an appropriate TCR, essentially all of the latter cells had the potential to become bona fide VAT Tregs. A differential heat-map (Fig. 6D) revealed striking similarity, with a few notable exceptions: a clear transcript enrichment in the presumably most mature (turquoise and brown) cell clusters in VAT, a less evident enrichment in the bridging region of the splenic black cluster, and an impoverishment in the spleen:VAT-shared (green) cluster in VAT but not spleen. The lack of a more impressive increase in potential splenic precursors fits well with the observation that there seemed to be a cap on the fraction of splenic PPARγlo cells (Fig. 1D).
We then identified a set of mAbs that would permit us to distinguish key VAT Treg subpopulations by flow cytometry. Cells of the turquoise and brown clusters should be ST2hiCD69med/hi (Fig. 6E) and, indeed, this subpopulation was enriched in TCR-tg VAT Tregs displaying high levels of clonotype+ TCRs (Fig. 6F). On the other hand, cells of the green cluster should be ST2loCXCR3hi (Fig. 6E), and they were largely absent from clonotype+ VAT Tregs (Fig. 6G). Since it has been reported that CXCR3+ Treg cells differentiate in response to interferon (IFN)-γ generated during a Th1 response (Koch et al., 2012), we wondered whether there might be a dearth of Th1 cells in VAT of vTreg53 TCR-tg mice. This proved to be the case (Fig. 6H), providing an explanation for the reduction in green-cluster Tregs in VAT of Tg+ mice.
Lastly, we addressed whether and to what extent VAT Tregs were preprogrammed epigenetically, an issue more amenable to testing in the TCR-tg line given that essentially all clonotype+ Treg cells should have the potential to become VAT Tregs. Genome-wide chromatin-accessibility profiling of thymic, splenic, and VAT Treg cells from Tg+ and Tg− littermates of various ages was performed using the Assay for Transposase-Accessible Chromatin (ATAC)-seq. Merging high-confidence peaks yielded a total of 89,791 open-chromatin regions (OCRs). PCA revealed that the majority of open-chromatin variation, regardless of whether all Treg OCRs or only those near (±100 kb) VAT-Treg signature genes were included, segregated Treg cells according to their tissue source, but not their age or transgene status (Fig. 7A). A heat-map plotting the 75 most variable OCRs near signature genes confirmed that the majority of them were acquired specifically in VAT (Fig. 7B). Some examples of genes exhibiting this pattern were Pparg (Fig. 7C) and Ctsh (Fig. S5A), which showed minimal local OCR signals in thymic and splenic Tregs, but strong signals in VAT Tregs. However, it is also worth noting that a substantial fraction of the OCRs near VAT-Treg signature genes were already accessible in the thymus and spleen (TSV-High and TSV-Med) (Fig. S5B). Given the increasing evidence of long-distance chromatin interactions, it is possible that many of these OCRs do not actually control expression of the nearby VAT-Treg signature genes. Alternatively, some of them might be “primed” by a common Treg or more general T cell program for a baseline of gene expression, which is then induced upon acquisition of one or more additional key OCRs specifically in VAT. Examples of this pattern were Klrg1, Il1rl1 (Fig. 7C), and Cxcl2, Pcyt1a (Fig. S5A), each of which had OCRs unique to VAT as well as common across the tissues examined. Overall, these ATAC-seq data argued for final acquisition of the VAT-Treg phenotype in adipose tissue. (Note that the small fraction of PPARγlo splenic Tregs would not have been detected in such an assay.)
Figure 7. Finalization of the VAT-Treg open chromatin landscape in the adipose tissue.

(A–C) ATAC-seq analysis of thymic, splenic, and VAT Treg cells from Tg− (total Tregs) or Tg+ (Vα2hiVβ4hi Tregs) Foxp3-GFPKI/y male mice. OCR, open-chromatin region. A) Above: PCA using all Treg OCRs. Below: PCA using OCRs ±100Kb of the transcriptional start-site of VAT Treg up-signature genes. B) Chromatin accessibility of the 75 most variable OCRs associated with VAT-Treg up-signature genes. Each column represents an OCR, with its closest gene annotated.. C) Genome-browser tracks of Tg+ Treg ATAC-seq reads at three paradigmatic VAT Treg signature genes.
(D–F) ATAC-seq analysis of PPARγ− and PPARγlo Vα2hiVβ4hi splenic Treg cells from Tg+ male mice. D) PCA using OCRs ±100Kb of the transcriptional start-site of VAT Treg up-signature genes. E) Heat-map of seven variable clusters (delineated by k-means clustering) of Tg+ Treg cells from 8–10wk-old male mice, based on OCRs ±100Kb of the transcriptional start-site of VAT Treg-unique up-signature genes. F) Genome-browser tracks of Tg+ Treg ATAC-seq reads at Zeb2 and Plin2 loci. See also Fig. S5.
One potential confounder was recirculation of VAT Tregs to the spleen and subsequent dampening of the VAT-Treg signature, giving rise to the PPARγlo splenic Treg population. So, we extended the ATAC-seq analysis to include the PPARγ− and PPARγlo Treg populations from spleens of vTreg53 TCR-tg mice. If the PPARγlo cells were recirculating from VAT, the profiles of OCRs near their VAT-Treg signature genes should have more closely resembled those of VAT Tregs than of total or PPARγ− splenic Tregs. However, according to both PCA (Fig. 7D) and heat-map analysis (Fig. 7E), the opposite was true: the OCR profile of PPARγlo splenic Tregs was very similar to those of their total or PPARγ− splenic counterparts, and was very different from that of VAT Tregs. Zeb2 exemplifies the most common pattern, i.e. PPARγlo cells were very different from VAT-Tregs, while Plin2 is an example of the much more rare case where PPARγlo cells were more similar to VAT Tregs (Fig. 7F). In brief, then, these genome-wide approaches provided additional support for the notion that diversification of VAT Tregs was not finalized until adipose-tissue residence.
DISCUSSION
The TCR, Foxp3 and IL-33 control VAT-Treg cell accumulation
Given the previously documented expansion of specific Treg clones in epididymal fat (Feuerer et al., 2009; Kolodin et al., 2015), we speculated that TCR:Ag recognition was an important factor driving the accumulation of Tregs in VAT. However, there was no direct evidence to support this notion. By monitoring the localization of Treg cells in vTreg53 TCR-Tg mice at steady-state and after adoptive transfer, we established that a particular “VATophilic” TCR could drive specific expansion and/or retention of Treg cells in epididymal VAT. Unlike most Tconv cells, Tregs are thought to recognize “self” (Josefowicz et al., 2012). So their TCRs could allow them to install in select nonlymphoid tissues in response to local self-Ags, permitting them to carry out unique functions through direct or indirect interactions with other cell-types in the surrounding microenvironment. Similarly, TCR-tg Treg cells recognizing a prostate Ag preferentially accumulate in the prostate gland (Malchow et al., 2013).
The identification of Foxp3 as another driver of VAT-Treg accumulation uncovered an unanticipated function for this primordial Treg TF. Unlike Tregs, Tconv cells from vTreg53 TCR-tg mice could not expand and/or be retained in VAT. There were several possible explanations for this difference. First, the exact repertoire of TCRs displayed by Vα2+Vβ4+ Treg and Tconv cells might not be identical due to different extents of secondary rearrangement of the endogenous Tcra/b genes. However, even on a Rag1−/− background, the VAT CD4+ T cell compartment was dominated by Treg cells. Second, Vα2+Vβ4+ Tconv cells might not be able to expand in VAT due to strong suppression by the enriched fat-Treg population in the TCR-tg mice. However, sorted Tconv cells from Tg+ mice were still unable to expand in VAT upon transfer into standard B6 recipients. Ectopic expression of Foxp3 was sufficient to drive accumulation of naïve TCR-tg Tconv cells in VAT and to promote their acquisition of a bona fide VAT Treg phenotype. Foxp3 and PPARγ partake in a common multi-protein complex (Cipolletta et al., 2012), so it is possible that they act in concert to promote cell enrichment in VAT. Indeed, transduction of PPARγ was not able to replace Foxp3 transduction in driving accumulation. The repertoire of chemokine and adhesion receptors induced by Foxp3 expression is another element of potential importance in the differential capacity of Treg and Tconv cells to accumulate in VAT.
IL-33 also regulates VAT-Treg enrichment, but whether and to what extent this is a direct effect has been a controversial issue (Vasanthakumar et al., 2015; Kolodin et al., 2015; Molofsky et al., 2015; Panduro et al., 2016). By abrogating expression of the IL-33 receptor, ST2, specifically in Tregs of vTreg53 TCR-tg mice, we established that ST2 has a substantial cell-intrinsic influence on the accumulation of bona fide VAT Tregs, thus refuting the contention that IL-33 acts on VAT Tregs only via an ILC2 intermediary. Age-dependent enrichment of Treg cells was much reduced in SAT in comparison with VAT (Feuerer et al., 2009), and our data suggest that differences in IL-33 levels might underlie this difference.
VAT Treg cells acquire their unique phenotype in two stages at two sites
At the outset of these studies, two scenarios of VAT-Treg generation seemed most likely: that they were imprinted with a distinct phenotype in the thymus, perhaps reflecting a specific type or site of TCR:MHC-Ag engagement; or that their phenotype was not manifest until VAT residence, reflecting microenvironmental adaptation. Our findings revealed that neither of these scenarios was entirely correct.
Unexpectedly, we identified a small population of PPARγlo Treg cells in the spleen. These cells might have been recirculating VAT Tregs, but this seems unlikely because the population’s size did not increase with age; in fact, it was present (even somewhat over-represented) in 2wk-old Tg+ mice (data not shown). In addition, transfer of splenic PPARγ− Tregs into standard B6 mice resulted in the appearance of PPARγ+ cells first in the spleen and then in VAT. Lastly, the epigenetic landscape of PPARγlo Treg cells from the spleen was much more like that of their PPARγ− splenic counterparts than that of VAT Tregs.
Transcriptomic analysis of PPARγlo splenic Treg cells revealed that they had up-regulated a component of the defining VAT-Treg transcriptional program, particularly those transcripts associated with Treg activation. We speculate that this PPARγlo Treg population arose in response to presentation of limiting amounts of cognate self-Ag –possibly in combination with a particular combination of cytokines – prompting the cells to take on an activated phenotype and exit the secondary lymphoid organs to survey parenchymal tissues. Those Tregs expressing an appropriate TCR, such as vTreg53, would be retained in VAT when they re-encounter their Ag (perhaps at higher concentrations) and would then fully acquire the unique VAT phenotype in response to local cues. Interestingly, Tg+ mice did not harbor more of the PPARγlo splenic Treg population than did their Tg− littermates, hinting that a limiting niche might control the size of the splenic PPARγlo Treg population, perhaps reflecting the availability of Ag, particular cytokines, and/or PPARγ ligands. Overall, these data argue for a scenario that entails layered acquisition of the definitive VAT-Treg gene-expression program, segregated into an activation component induced in secondary lymphoid organs and a tissue-specific component enforced by unique local cues.
Interest in boosting or impairing Treg compartments for therapeutic ends continues to grow. In general, the approach has been to modulate Treg cells in a tissue-agnostic manner, not accounting for the different sites that need to be targeted in different disease contexts. Such approaches appear to be less than optimum because they risk provoking generalized immunosuppression or immunostimulation, and because they are often poorly adapted for accessing critical Treg cells within the pathologic lesion of interest. Thus, it is imperative to understand how the Treg populations within tissues distinguish themselves so that we can devise effective precision-targeting strategies.
STAR METHODS
KEY RESOURCE TABLE
| REAGENT or RESOURCE | SOURCE | IDENTIFIER |
|---|---|---|
| Antibodies | ||
| anti-CD45.1 (clone A20) | Biolegend | Cat# 110724 |
| anti-CD45.2 (clone 104) | Biolegend | Cat# 109824 |
| anti-CD3 (clone 17A2) | Biolegend | Cat# 100214 |
| anti-CD4 (clone GK1.5) | Biolegend | Cat# 100422 |
| anti-CD8 (clone 53-6.7) | Biolegend | Cat# 100730 |
| anti-CD25 (clone PC61) | Biolegend | Cat# 102026 |
| anti-KLRG1 (clone 2F1/KLRG1) | Biolegend | Cat# 138416 |
| anti-CD69 (clone H1.2F3) | Biolegend | Cat# 104539 |
| anti-CXCR3 (clone CXCR3-173) | Biolegend | Cat# 126512 |
| anti-TCR Vα2 (clone B20.1) | Biolegend | Cat# 127806 |
| anti-CD45 (clone 30-F11) | Biolegend | Cat# 103126 |
| anti-CD11b (clone M1/70) | Biolegend | Cat# 101230 |
| anti-CD11c (clone N418) | Biolegend | Cat# 117310 |
| anti-F4/80 (clone BM8) | Biolegend | Cat# 123114 |
| anti-ARTC2 (Treg-Protector, clone S+16a) | Biolegend | Cat# 149802 |
| anti- IFN-γ (clone XMG1.2) | Biolegend | Cat# 505826 |
| anti-ST2 (clone RMST2-2) | eBioscience | Cat# 46-9335-80 |
| anti-Foxp3 (clone FJK-16s) | eBioscience | Cat# 17-5773-82 |
| anti-Gata3 (clone TWAJ) | eBioscience | Cat# 12-9966-42 |
| anti-TCR Vβ4 (clone KT4) | BD Biosciences | Cat# 553366 |
| anti-Thy1.1 (clone OX-7) | BD Biosciences | Cat# 561409 |
| anti-Thy1.2 (clone 53-2.1) | BD Biosciences | Cat#561641 |
| anti-ki67 (clone B56) | BD Biosciences | Cat#561277 |
| anti-Siglec-F (clone E50-2440) | BD Biosciences | Cat# 562068 |
| anti-mouse MHC Class II (clone M5/114) | BioXCell | Cat# BE0108 |
| rat IgG2b isotype control (clone LTF-2) | BioXCell | Cat# BE0090 |
| anti-IL-33 | R&D Systems | Cat# AF3626 |
| Goat IgG | R&D Systems | Cat# AB-108-C |
| Donkey anti-goat Cy3 | Jackson Immunoresearch | Cat# 705-165-147 |
| Bacterial and Virus Strains | ||
| Biological Samples | ||
| Chemicals, Peptides, and Recombinant Proteins | ||
| Recombinant murine IL-2 | Peprotech | Cat# 212-12 |
| Carrier-free recombinant mouse IL-33 | Biolegend | Cat# 580506 |
| BrdU | Sigma | Cat# B5002 |
| D-Glucose | Thermo Fisher SCIENTICIFC | Cat# D16-500 |
| Insulin | Eli Lilly | Humulin R U-100 |
| Collagenase type II | Sigma | Cat# C6885 |
| Collagenase type IV | Gibco | Cat#17104019 |
| DNase I | Sigma | Cat# DN25 |
| 2-Mercaptoethanol | Sigma | Cat# M7522 |
| Critical Commercial Assays | ||
| Foxp3 / Transcription Factor Staining Buffer Set | eBioscience | Cat# 00-5523-00 |
| True-Nuclear Transcription Factor buffer set | Biolegend | Cat# 424401 |
| APC BrdU Flow Kit | BD Biosciences | Cat# 552598 |
| gBlocks Gene Fragment Customize Synthesis | Integrated DNA Technologies | N/A |
| Treg-Protector | Biolegend | Cat# 149802 |
| Percoll | GE Healthcare | Cat# 17089109 |
| Buffer TCL | Qiagen | Cat# 1031576 |
| OptiPrep Density Gradient Medium | Sigma | Cat# D1556 |
| Ultra Sensitive Mouse Insulin ELISA Kit | Crystal Chem | Cat# 90080 |
| Nextera DNA Sample Prep Kit | Illumina | Cat# FC-121-1030 |
| HiScribe T7 High Yield RNA Synthesis Kit | NEB | Cat# E2040S |
| SuperScript™ III Reverse Transcriptase | Invitrogen | Cat# 18080093 |
| Magnesium RNA fragmentation kit | Ambion | Cat# AM8740 |
| PrimeScript Reverse Transcriptase | Takara Clontech | Cat# 2680B |
| RNAClean XP beads | Beckman Coulter | Cat# A63987 |
| Kapa 2× HiFi HotStart PCR mix | Kapa Biosystems | Cat# KK2601 |
| TransIT®-293 Transfection Reagent | Mirus | Cat# MIR 2705 |
| RNeasy Lipid Tissue Mini Kit | Qiagen | Cat# 74804 |
| Dynabeads™ Untouched™ Mouse CD4 Cells Kit | Thermo Fisher SCIENTICIFC | Cat# 11415D |
| Dynabeads™ Mouse T-Activator CD3/CD28 for T-Cell Expansion and Activation | Thermo Fisher SCIENTICIFC | Cat# 11453D |
| Deposited Data | ||
| RNA-Seq data | This paper | GSE113393 |
| ATAC-Seq data | This paper | GSE113412 |
| ScRNA-Seq data | This paper | GSE110692 |
| VAT Treg microarray data | Cipolletta et al., 2015 | GSE37535 |
| CD44hi activated Treg microarray data | Levine et al., 2014 | GSE61077 |
| Experimental Models: Cell Lines | ||
| Platinum-E Retroviral Packaging Cell Line | CELL BIOLABS | RV-101 |
| VAT Treg clone, 53 | This paper | N/A |
| Experimental Models: Organisms/Strains | ||
| Mouse: vTreg53 TCR Tg / B6 | This paper | N/A |
| Mouse: Pparg-Tdt / B6 | This paper | N/A |
| Mouse: CD45.1+ / B6 | Jackson Laboratory | 002014 |
| Mouse: CD45.2+ / B6 | Jackson Laboratory | 000664 |
| Mouse: RAG1−/− / B6 | Jackson Laboratory | 002216 |
| Mouse: Foxp3-GFP backcrossed to B6 | Bettelli et al., 2006 | N/A |
| Mouse: Foxp3-Cre backcrossed to B6 | Rubtsov et al., 2008 | N/A |
| Mouse: Il1rl1flox backcrossed to B6 | Chen et al., 2015 | N/A |
| Oligonucleotides | ||
| sgRNA targeting Pparg locus protospacer sequence: 5′ GGAACACGTTGTCAGCGGGT | This paper | N/A |
| Cas9 mRNA | TriLInk Biotechnologies | L-6125 |
| See Table S1 for PCR primers | This paper | N/A |
| Recombinant DNA | ||
| Plasmid: pTαcass- vTreg53α | This paper | N/A |
| Plasmid: pTβcass- vTreg53β | This paper | N/A |
| Plasmid: MSCV-IRES-Thy1.1 | Wu et al., 2006 | Addgene: 17442 |
| Plasmid: MSCV-Foxp3-IRES-Thy1.1 | Wu et al., 2006 | Addgene: 17443 |
| Plasmid: MSCV-Pparg-Thy1.1 | This paper | N/A |
| Plasmid: MSCV-Il1rl1-Thy1.1 | This paper | N/A |
| Pparg5ARM-IRES-Tdt-3ARM | This paper | N/A |
| Software and Algorithms | ||
| Cuffquant version 2.2.1 | Trapnell et al., 2012; | http://cole-trapnell-lab.github.io/cufflinks/install/ |
| GenePattern software package | Broad Institute | http://software.broadinstitute.org/cancer/software/genepattern/ |
| sickle | UC Davis | https://github.com/ucdavis-bioinformatics/sickle |
| Picard v1.130 | Broad Institute | https://github.com/broadinstitute/picard |
| tophat2 | Johns Hopkins University | https://github.com/infphilo/tophat |
| Bowtie v2.2.4 | Langmead and Salzberg, 2012 | http://bowtie-bio.sourceforge.net/bowtie2/index.shtml |
| HOMER (v4.6) | Heinz et al., 2010 | http://homer.ucsd.edu/homer/ |
| Bedtools | Quinlan and Hall, 2010 | http://bedtools.readthedocs.io/en/latest/index.html |
| t- SNE | van der Maaten and Hinton, 2008 | https://lvdmaaten.github.io/tsne/ |
| R v3.2.1 | The R Foundation | https://www.r-project.org |
| PRISM | GraphPad | https://www.graphpad.com |
| FlowJo software | FlowJo, LLC | https://www.flowjo.com |
| Other | ||
| Picolab Mouse Diet 20 (no. 5058) | LabDiet | Cat# 0007689 |
| Hydrogel beads | Zilionis et al., 2017 | N/A |
CONTACT FOR REAGENT AND RESOURCE SHARING
Further information and requests for resources and reagents should be directed to and will be fulfilled by the Lead Contact, Diane Mathis (dm@hms.harvard.edu).
EXPERIMENTAL MODEL AND SUBJECT DETAILS
Mice
Male (and, where indicated, female) mice of various ages were produced in our specific pathogen-free facilities at Harvard Medical School, and were fed a chow diet (no. 5058, Lab Diet Picolab Mouse Diet 20). B6.CD45.2+, B6.CD45.1+ (i.e., standard B6), and B6.Rag1−/− mice were purchased from the Jackson Laboratory. Foxp3-GFP (Bettelli et al., 2006), Foxp3-Cre (Rubtsov et al., 2008), and Il1rl1flox (Chen et al., 2015) mice were obtained from Drs V. Kuchroo, A. Rudensky, and R. Lee, respectively, and were backcrossed, then maintained on the B6 background. Mice lacking ST2 specifically on Treg cells were generated by appropriate crossing of the Foxp3-Cre and Il1rl1flox lines. All experiments were performed using littermate controls.
For generation of the VAT Treg TCR-Tg line (vTreg53), rearranged genomic DNA fragments encoding TRAV14N-3*01 (Vα2) TRAJ21*01 (CDR3 sequence: tgtgcagcaagtcctaattacaacgtgctttacttc; Amino acid: CAASPNYNVLYF) and TRBV2*01 (Vβ4) TRBJ2-5*01 (CDR3 sequence: tgtgccagcagccaagaagacacccagtacttt; Amino acid: CASSQEDTQYF) were synthesized as gBlocks Gene Fragments (Integrated DNA Technologies), then amplified and cloned, respectively, into the pTαcass and pTβcass TCR-tg vectors (Kouskoff et al., 1995). These Tcra and Tcrb sequences derived from the expanded VAT Treg clone, 53 (Kolodin et al., 2015). DNA fragments driving expression of TCRα and β were excised, purified, and co-injected into fertilized B6 eggs. Genotyping of the tg mice was performed by polymerase chain reaction (PCR) amplification of rearranged Tcra and Tcrb fragments. The TCR tg mice were further crossed with Foxp3-GFP, Il1rl1floxFoxp3-Cre, or Rag−/− mice. In all cases, the Tcra plus Tcrb transgene was maintained in the heterozygous state.
For generation of the Pparg-Tdt mice, a 4kb homology DNA construct (Pparg5ARM-IRES-Tdt-3ARM) was cloned, comprised of the 5′ homology arm (1096bp upstream of and including the stop codon of Pparg), the IRES-Tdtomato-Cassette (2006bp), and the 3′ homology arm (930bp downstream of the stop codon of Pparg). A double-stranded DNA break was introduced close to the start of the 3′ UTR of the Pparg locus by Cas9 and a single-guide (sg) RNA (protospacer sequence: 5′ GGAACACGTTGTCAGCGGGT 3′). On the day of injection, the sgRNA (2.5ng/ul), Cas9 mRNA (5 ng/ul, TriLInk Biotechnologies), and linearized double-stranded DNA template (2.5ng/ul) were mixed in 10 mM Tris/0.1 mM EDTA, pH 7.4, and immediately injected into B6 embryos. Resulting founder mice were genotyped by PCR amplification, confirming knocking-in of the IRES-Tdtomato cassette into the start of the 3′UTR of the Pparg locus. The Pparg-Tdt mice were further crossed with TCR-tg Foxp3-GFP mice to generate dual-reporter mice.
All experimentation was performed following animal protocols approved by the HMS Institutional Animal Use and Care Committee (protocol IS00001257).
T-cell transfers
For transfer of total CD4+ T cells: 5×10⁶ CD4+ T cells purified from pooled spleen and lymph nodes of 6–8wk-old male CD45.2+Tg− or Tg+ littermates, using the Dynabeads Untouched Mouse CD4 Cells Kit (Thermo Fisher Scientific), were injected i.v. into 6–8wk-old B6.CD45.1+ male mice. Engraftment and enrichment of donor-derived cells in the spleen, epididymal VAT, or inguinal SAT of recipient mice were analyzed at various time-points after transfer. For purified Treg or Tconv cell transfers: 0.25×10⁶ Treg cells or 1 million Tconv cells were sorted from pooled spleen and lymph nodes of 6–8wk-old male CD45.2+Tg− or Tg+ Foxp3- GFPKI/y mice by Moflo, and were i.v.-injected into 6–8wk old male B6.CD45.1+ mice. 12 wks after transfer, engraftment and enrichment of donor-derived cells in spleen and VAT (epididymal) of recipient mice were analyzed by flow cytometry. For transfer of PPARγ− or PPARγ+ Treg cells: the number of cells stated in the relevant figure legend were sorted from pooled spleen and lymph nodes of 8wk-old male CD45.2+Tg+ Foxp3-GFPKI/y. Pparg-TdtKI/+ mice by Moflo, and were injected i.v. into 6–8wk-old male B6.CD45.1+ mice. When very low numbers of Tregs were transferred (e.g.: 50,000 cells), 50ug Treg-Protector (Biolegend) was i.v. injected into donor mice 30min before harvesting lymphoid organs to protect against cell death. In certain experiments, recipient mice were also i.v. injected every 3 days for 2wks with 200ug anti-mouse MHC Class II (M5/114) or rat IgG2b isotype control (LTF-2) (BioXCell) antibody, or i.p. with 2ug recombinant mouse IL-33 (Biolegend) or PBS. Engraftment and induction of Pparg gene expression from donor-derived cells in spleen and VAT (epididymal) of recipient mice were analyzed at various time-points after transfer.
Primary T cell cultures and retroviral transductions
Tconv cells sorted from pooled spleen and lymph nodes of 6–8wk-old male CD45.2+Tg+ Foxp3-GFPKI/y mice were cultured in complete RPMI medium, and were stimulated by Dynabeads Mouse T-Activator CD3/CD28 (Thermo Fisher Scientific) at a 1:1 ratio. 24–36 hours later, cells were “spin infected” with a retrovirus carrying an empty control vector (MSCV-IRES-Thy1.1), Foxp3 (MSCV-Foxp3-IRES-Thy1.1), Pparg (MSCV-Pparg-Thy1.1), or Il1rl1 (MSCV-Il1rl1-Thy1.1), which was packaged in the Platinum-E Retroviral Packaging Cell Line (CELL BIOLABS) using the TransIT®-293 Transfection Reagent (Mirus) following the manufacturer’s instructions. Transduced cells were further cultured for 36–48 hours in the presence of CD3/CD28 beads and 50U/ml recombinant murine IL-2 (Peprotech), and then transferred i.v. into 6–8wk-old male B6.CD45.1+ mice at 1×10⁶ cells per recipient mouse. Engraftment and enrichment of donor-derived cells in spleen and VAT (epididymal) of recipient mice were analyzed at various time-points after transfer. Vα2+Vβ4+CD45.2+Thy1.1+CD4+ T cells were double-sorted from the spleens of recipient mice one wk after transfer (both control-vector-and Foxp3-transduced groups), or from VAT of recipient mice six wks after transfer (only the Foxp3-transduced group), and were subjected to RNA-seq analysis.
Long-term BrdU labeling and chase
10wk-old TCR Tg+ male mice were given BrdU (Sigma) in the drinking water (0.8mg/ml) and protected from the light for 4 weeks. BrdU-containing water was changed every 2 days. After 4 weeks of continuous labeling, BrdU was removed from the drinking water and cells from the mice were processed and staining for BrdU at various times following the manufacturer’s instructions (APC BrdU Flow Kit, BD Biosciences). Data was expressed as percent of the starting BrdU+ Treg pool on day 0 of chase. An exponential decay line was fitted to each data set to calculate the half-life of cells.
METHODS DETAILS
Cell isolation and flow cytometry
Mice were asphyxiated with CO2 and perfused with 30ml of PBS containing 5mM EDTA. Epididymal VAT, peri-renal VAT, inguinal SAT, liver, hindlimb muscles, lung, and colon from male mice, or ovarian VAT, peri-renal VAT, and inguinal SAT from female mice were excised, minced and digested in a 37°C water bath with shaking as follows: adipose tissues were digested for 20 min with 1.5 mg/ml collagenase type II (Sigma) in Dulbecco’s Modified Eagle’s Medium (DMEM) supplemented with 2% fetal calf serum (FCS); liver was digested in DMEM containing 0.5mg/ml collagenase IV (Gibco) and 150 ug/ml DNase I (Sigma) for 30 min; skeletal muscle was digested in DMEM containing 2 mg/ml collagenase II (Gibco) and 150 ug/ml DNase I (Sigma) for 30 min; lung was digested in RPMI containing 4% fetal calf serum (FCS), 10 mM HEPES, 3mg/ml collagenase IV (Gibco), and 300 ug/mL DNase I (Sigma) for 45 min; the entire colon was incubated in RPMI containing 1mM DTT, 20mM EDTA, and 2% FCS, at 37°C for 15 min to remove epithelial cells. The colon was then minced and dissociated in RPMI containing 1.5mg/ml collagenase II (Gibco), 0.5mg/ml Dispase (Gibco), and 1% FCS, at 37°C for 45 min with constant stirring. For all tissues, the digested materials were filtered through a sieve and then a 70um nylon cell strainer. For adipose tissues, the SVF was collected after centrifugation at 450g for 10 min. For liver and muscle, cells were further enriched for a leukocyte fraction by 40% Percoll (GE Healthcare), underlain with 80% Percoll, and spun for 25 min at 1126g. For T lymphocyte analysis, cells were stained with anti-CD45.1 (A20), -CD45.2 (104), -CD3 (17A2), -CD4 (GK1.5), -CD8 (53-6.7), -CD25 (PC61), -KLRG1 (2F1/KLRG1), -CD69 (H1.2F3), -CXCR3 (CXCR3-173), -TCR Vα2 (B20.1) mAbs (all from Biolegend); anti-ST2 (RMST2-2) (eBioscience); and/or anti-TCR Vβ4 (KT4), -Thy1.1 (OX-7), -Thy1.2 (53-2.1) mAbs (all from BD Biosciences), as detailed in experiment descriptions. Cells were fixed, permeabilized and intracellularly stained for Ki67 (B56, BD Biosciences), Foxp3 (FJK-16s), Gata3 (TWAJ) (both from eBioscience), and/or IFN-γ (XMG1.2, Biolegend) according to the manufacturer’s (eBioscience’s) instructions. For myeloid cell analysis, cells were stained with anti-CD45 (30-F11), -CD11b (M1/70), -CD11c (N418), -F4/80 (BM8) mAbs (all from Biolegend); and anti-Siglec-F (E50-2440) (BD Biosciences) mAb. Intracellular IL-33 staining was performed with the True-Nuclear Transcription Factor buffer set from BioLegend. Goat IgG or polyclonal anti-IL-33 (both from R&D Systems) were used as primary antibodies and Donkey anti-goat Cy3 served as the secondary antibody (Jackson Immunoresearch). BrdU staining was performed following the manufacturer’s instructions (APC BrdU Flow Kit, BD Biosciences). Cells were acquired with an LSRII flow cytometer (BD Biosciences), and data were analyzed using FlowJo software.
Metabolic studies
14–16wk-old Tg− and Tg+ littermates fed a chow diet (no. 5058, Lab Diet Picolab Mouse Diet 20, contains 9 gm% fat) were subjected to metabolic assays. For the glucose-tolerance test (GTT), mice were fasted for 15 hours overnight, weighed, and then tested for fasting blood-glucose and insulin concentrations (Crystal Chem Ultra Sensitive Mouse Insulin ELISA Kit), which were used to calculate the HOMA-IR using the HOMA Calculator (The University of Oxford). Glucose (2.0 g per kg body weight) was administered by intraperitoneal (i.p.) injection. Blood-glucose levels were measured before and 20, 40, 60, 90, and 120 minutes after glucose injection. For the insulin-tolerance test (ITT), mice were fasted for 4 hours before being injected i.p. with insulin (0.75 U, Humulin R, Lilly). Blood-glucose levels were measured before and 20, 40, 60, 90, and 120 minutes after insulin injection, and were normalized to the blood-glucose levels before insulin injection. The area under the curve (AUC) was calculated using GraphPad Prism 7.0.
Quantification of gene expression by RT-qPCR
RNA from adipose tissues was extracted and purified using RNeasy Lipid Tissue Mini Kit (Qiagen), according to the manufacturer’s instructions. cDNA was synthesized using SuperScript II Reverse Transcriptase (Thermo Fischer Scientific). Real-time quantitative PCR was performed using TaqMan- or SYBR Green-based assays (Applied Biosystems). Transcript values were normalized to those from the mouse Tbp gene.
Ultra-low-input RNA-seq library preparation and data analysis
Biological triplicates of 1×10³ thymic, splenic, or VAT Treg or Tconv cells from 2-, 10-, or 20wk-old Tg− or Tg+ Foxp3-GFPKI/y male littermates, or splenic PPARγ+ and PPARγ− Treg cells from 8–10wk-old Tg− or Tg+ Foxp3-GFPKI/y. Pparg- TdtKI/+ male littermates were double-sorted by Moflo into 5ul Buffer TCL (Qiagen) with 1% 2-Mercaptoethanol (Sigma). For Tg+ mice, Vα2hiVβ4hi cells were sorted and processed. For the retroviral transduction experiments: Tconv cells from CD45.2+Tg+ Foxp3-GFPKI/y mice were transduced with a retrovirus carrying an empty control vector (MSCV-IRES-Thy1.1) or Foxp3 in the same vector (MSCV-Foxp3-IRES-Thy1.1), and were transferred into B6.CD45.1+ mice. Biological duplicates of 1×10³ Vα2hiVβ4hi CD45.2+Thy1.1+CD4+ T cells were double-sorted from the spleens of recipient mice one wk after transfer (both control- and Foxp3-transduced groups), or from VAT of recipient mice six wks after transfer (only the Foxp3-transduced group). Smart-Seq2 libraries were prepared by the Broad Technology Labs, and were sequenced using the Broad Genomics Platform (Picelli et al., 2014). Briefly, total RNA was captured and purified on RNAClean XP beads (Beckman Coulter). Polyadenylated mRNA was then selected using an anchored oligo(dT) primer and converted to cDNA via reverse transcription. First-strand cDNA was subjected to limited PCR amplification followed by transposon-based fragmentation using the Nextera XT DNA Library Preparation Kit (Illumina). Samples were then PCR-amplified using barcoded primers such that each sample carried a specific combination of Illumina P5 and P7 barcodes, and were pooled prior to sequencing. Sequencing was performed on an Illumina NextSeq500 using 2 × 25bp reads. Transcripts were quantified by the Broad Technology Labs computational pipeline with Cuffquant version 2.2.1 (Trapnell et al., 2012). Normalized reads were further filtered by minimal expression and analyzed by Population PCA and Multiplot Studio in the GenePattern software package. Compilation of the VAT Treg signature gene-sets was described previously (Cipolletta et al., 2015). For generation of the CD44hi activated Treg signature gene-sets: microarray data from GSE61077 was analyzed by the GenePattern software package, and the CD44hi Treg up- and down-signatures were generated using a two-fold cutoff comparing gene expression from CD44hi and CD62Lhi subsets of Treg cells.
ATAC-seq library preparation and data analysis
Construction of ATAC-seq libraries was based on published protocols (Buenrostro et al., 2013; Lara-Astiaso et al., 2014). Briefly, 1×10⁴ thymic (3wk-old), splenic (3, 10, or 20wk-old), or VAT (10 or 20wk-old) Foxp3(GFP)+CD4+ T cells from 3-, 10-, or 20wk-old Tg− (total Tregs) or Tg+ (Vα2hiVβ4hi Tregs) Foxp3-GFPKI/y male littermates, or PPARγ− and PPARγlo splenic Vα2hiVβ4hi Tregs from 8–10wk-old Tg+ Foxp3-GFPKI/y. Pparg-TdtKI/+ mice were sorted into 400μl of MACS buffer [1× phosphate-buffered saline (PBS), 0.5% bovine serum albumin (BSA), 2mM EDTA] and pelleted by centrifugation at 500g for 15 min. Cell pellets were re-suspended in 100μl of cold hypotonic lysis buffer [10mM Tris-HCl (pH 7.5), 10mM NaCl, 3mM MgCl2 and 0.1% NP40], followed by immediate centrifugation at 550g for 30 min. The pellet was resuspended in 5μl of transposition reaction mix [1μl of Tagment DNA Enzyme, 2.5μl of Tagment DNA Buffer from Nextera DNA Sample Prep Kit (Illumina), 1.5μl H2O], and was incubated at 37°C for 60 min. For library prepa ration, two sequential 7-cycle PCRs were performed. After the first PCR, the libraries were selected for small fragments (<600bp) using SPRI beads, followed by a second round of PCR under the same conditions. Libraries were sequenced on a NextSeq500 (Illumina) to generate paired-end reads (50bp, forward; 34bp, reverse). ATAC-seq reads from two biological replicates per sample were filtered for quality (sickle), adapter-trimmed (cutadapt –e 0.1 – m 20), and mapped to the mouse genome (mm9) using Bowtie v2.2.4, keeping only mate pairs that mapped to a single best location using samtools v1.3; and were non-duplicates using Picard v1.130. OCRs were identified by HOMER (v4.6) findPeaks –dnase, using a false discovery rate of 0.001. Only OCRs called in both replicates were used in further analyses, yielding 40–68,000 per sample, which were merged into a union of 89,791 unique OCRs using HOMER mergePeaks. All OCRs falling within 100Kb of a VAT Treg up-signature gene [defined vis-à-vis splenic Tregs in (Cipolletta et al., 2015)] or VAT Treg-unique up-signature genes (126 genes uniquely up-regulated in Tg+ VAT Tregs (vis-à-vis splenic Tregs) but not in PPARγ+ splenic Tregs (vis-à-vis PPARγ− splenic Tregs)) were found using bedtools window (v2.2.6). These OCRs were used for PCA, and for hierarchical clustering or K-means clustering based on their pair-wise Euclidean distances (R v3.2.1). For analysis of the most variable OCRs, all of those falling within 10Kb of VAT up-signature genes were found and ranked by their variance in ATAC signal across all samples. The top 75 most variable were plotted in a heat map using heatmap.2 from the gplots package in R, and were annotated with their closest VAT up-signature gene. Genome browser tracks show bigwig file representations of sequencing reads on the Integrated Genome Viewer (IGV).
Single-cell RNA-seq library preparation and data analysis
scRNA-seq was performed following the InDrop protocol that has been previously described (Zilionis et al., 2017). In brief, 10,000 splenic or VAT Tregs from 20wk-old Tg− or Tg+ Foxp3-GFPKI/y male littermates were sorted into complete RPMI medium. Just before encapsulation, cells were pelleted by centrifugation at 500g for 5min and re-suspended in PBS-15% OptiPrep Density Gradient Medium (OptiPrep; Sigma-Aldrich) at a concentration of 80,000 cells/ml. Around 5,000 single cells per sample were then encapsulated in droplets of 3–4 nl containing a primer hydrogel bead and the reverse transcriptase (RT) buffer (SuperScriptIII, Invitrogen). RT was performed immediately after encapsulation. After purification of the DNA/RNA duplex with 1.2× AMPure beads (Beckman), second-strand cDNA synthesis was performed (NEB) for 2.5 h at 16°C. The library was then amplified using T7 in vitro transcription for 15h at 37°C (HiScribe T7 High Yield RNA Synthesis Kit, NEB). After purification, half of the amplified RNA was used for further processing. First, the amplified (a)RNA was fragmented for 3 min at 70°C (magnesium RNA fragmentation kit, Ambio n) and purified using AMPure Beads (1.2X). Then reverse transcription with random hexamers was done for 1h at 42°C (PrimeScript Reverse Transcriptase, Takara Clo ntech). A final PCR was done to amplify the library and to add the P5–P7 and Illumina index primers (Kapa 2× HiFi HotStart PCR mix, Kapa Biosystems). Library size was analyzed with a Tapestation (High Sensitivity D1000 ScreenTape, Agilent technologies), quantified by qPCR, and sequenced using NextSeq 500 and custom primers (read 1: 40bp, index: 7bp, read 2: 51 bp). For data analysis, Fastq reads were first filtered for quality (>80% with Sanger Q>20) and on the expected structure of the reads. Single-cell demultiplexing was performed against the possible barcode space, and only reads mapping unambiguously and with less than 2 mismatches were kept. For each single-cell library, the reads were then mapped against the mouse mm10 transcriptome (complemented with the sequence of the Foxp3-GFP transgene) using tophat2. Reads mapping to multiple regions or having a low alignment score (MAPQ <10) were filtered out (flag 256). Duplicate reads were also filtered. A final matrix with genes in rows and cells in columns was then constructed. Total unique molecular identifier (UMI) count normalization was performed and scaled to the median UMI count. Contaminant cells and doublets were removed.
Data were visualized using the t-Distributed Stochastic Neighbor Embedding (t-SNE) dimensionality reduction algorithm (van der Maaten and Hinton, 2008). A PCA was first performed on the top 100 most variable genes that were expressed in more than 1% of the cells. The Fano factor (variance/mean) was used as a metric for variability because of its independence from the mean in Poisson distributed data. The number of significant PCs was determined by comparison with PCA over a randomized matrix as described by Klein et al. (Klein et al., 2015). Two-dimensional tSNE was run using the Rtsne function (Grun et al., 2015), on the significant PCs, setting the seed for reproducibility and using the following parameters (perplexity = 50, max_iter = 1000). Clustering was done using k-means. Differential gene expression was performed using the DESeq statistical model (Love et al., 2014). Density of cells in the two-dimensionality tSNE space was calculated on 1000 Tg+ and 1000 Tg− Tregs using densCols function from the grDevice package on R (R Development Core Team, 2017). The VAT Treg signature score for each single cell was computed by summing the counts for the up-regulated genes and subtracting the counts for the down-regulated genes, and was plotted after Z-score scaling.
QUANTIFICATION AND STATISTICAL ANALYSIS
Data were routinely presented as mean ± SD. Unless stated otherwise, significance was assessed by Student’s t-test or ANOVA using GraphPad Prism 7.0. To determine the enrichment of certain gene signatures in RNA-seq data-sets, we used a Chi-squared test. p= *, <0.05; **, <0.01; ***, <0.001; ****, <0.0001.
DATA AND SOFTWARE AVAILABILITY
The accession numbers for the RNA-seq, ATAC-seq and scRNA-seq data reported in this paper are GEO: GSE113393, GSE113412, GSE110692.
Supplementary Material
(A) Frequencies of Vα2+Vβ4+ cells in Treg, Tconv, and CD8+ T cells (left) and numbers of total Tregs (right) from various tissues of 20wk-old Tg− and Tg+ mice (n=8).
(B) Frequencies of Vα2+Vβ4+ Treg (above) or Tconv (below) cells from Tg+ male mice at various ages (n≥5).
(C) Frequencies of thymic Vα2+Vβ4+ Treg and Tconv cells from male Tg+ mice at various ages (n≥4).
(D) Representative dot-plots of T cells from 10wk-old male Tg+Rag1+/+ (left) or Tg+ Rag1−/−mice (right).
(E) Summary data showing frequencies (left) and numbers (right) of Treg cells from various tissues of 10–12wk-old Tg+Rag1−/− male mice (n=7). Numbers refer to the fraction of cells in the indicated gate. Thy, thymus; LN, lymph node. Other abbreviations as per Fig. 1.
(A) Validation of the Pparg-Tdt reporter mice. VAT from 16wk-old Pparg-TdtKI/KI or wild-type B6 mice were extracted for total RNA and subjected to reverse transcription for cDNA synthesis using the Tdt-RT-REV primer. The isoforms of Pparg were identified by PCR using oligonucleotides specific to either Pparg1 (Pparg1-FWD) or Pparg2 (Pparg2-FWD) in combination with Tdt-RT-REV. Above: scheme of the design. Below: representative agarose gel electrophoresis of the PCR products.
(B) ST2, KLRG1, and GATA3 expression in splenic and VAT Tregs from 20wk-old Tg− and Tg+ male mice (n≥5).
(C) PPARγ expression in Treg cells from various tissues of 20wk-old Tg− and Tg+ male mice (n=5). N.D., not detectable (due to low cell numbers).
(D) Frequencies (left) and numbers (right) of total VAT Tregs from 14–16wk-old Tg− and Tg+ male mice (n≥5).
(E) Representative dot-plots showing the gating strategy for identification of inflammatory MFs from VAT of 14–16wk-old Tg− and Tg+ male mice. Numbers indicate fraction of cells within the designated gate. Corresponding summary data appear in Fig. 1F.
(F) PCR quantification of inflammatory gene transcripts in VAT from 14–16wk-old Tg− and Tg+ male mice (n=8).
(G) Body (left) and VAT (right) weights of 14–16wk-old Tg− and Tg+ male mice (n≥5).
(H) Correlation of homeostatic model assessment of insulin resistance (HOMA-IR) with number of VAT Tregs in 14–16wk-old Tg− and Tg+ male mice (n≥5). Numbers refer to the fraction of cells in the indicated gate. Abbreviations as per Fig. 1.
(A) Frequencies and numbers of VAT ILC2s from 10wk-old Tg+ Il1rl1+/+ or Tg+ Il1rl1f/f Foxp3-Cre male mice (n=4).
(B) Frequencies of KLRG1+ Treg cells from VAT of 36wk-old Tg− Il1rl1+/+Foxp3-Cre and Il1rl1f/f Foxp3-Cre male littermates (n≥6). Numbers refer to the fraction of cells in the indicated gate. Abbreviations as per Fig. 1.
(A) FC/FC plot of gene-expression values in 8–10wk-old Tg− VAT vs spleen Tregs compared with Tg− PPARγlo versus PPARγ− splenic Tregs (n=3). Left: VAT-Treg signature genes highlighted in red (induced) or blue (repressed). Right: VAT-Treg signature genes minus CD44hi Treg signature genes highlighted in red (induced) or blue (repressed). Bold values to the side indicate the number of signature genes induced (right) or repressed (left) in VAT Tregs that were changed (top and bottom) or not changed (middle) by more than two-fold in PPARγlo compared with PPARγ− splenic Tregs.
(B) PPARγ− Treg cells were sorted from pooled spleen and LNs of 8wk-old Tg− or Tg+ CD45.2+ Pparg-TdtKI/+ Foxp3-GFPKI/y male mice and cultured with 1000U/mL IL-2 alone or in combination with anti-CD3/28 beads at a 1:2 ratio for 3 days (n=3). Left: representative dot-plots for PPARγ induction. Numbers refer to the fraction of PPARγ+ cells within the gate. Right: corresponding summary plots. Abbreviations as per Fig. 1.
(A) Genome-browser tracks of Tg+ Treg ATAC-seq reads at some PPARγ-dependent genes, as defined in (Cipolletta et al., 2012).
(B) Hierarchical clustering of all OCRs ±100Kb of VAT up-signature genes. Delineation of five clusters, labeled by their accessibility signal in thymic (T), splenic (S), or VAT (V) Tregs.
Acknowledgments
We thank Drs. A. Klein, A.S. Banks and J. Mohan for discussions; Y. Yang, J. Hall, N. Asinovski, A. Ortiz-Lopez, K. Hattori, A. Rhoads, A. Mann, D. Ramanan, M. Panduro, G. Buruzula, C. Arane, L. Du, L. Yang, and A. Cook for experimental help; and Drs. V. Kuchroo, A. Rudensky, and R. Lee for mouse lines. Cell sorting was at the HSCI/DRC Flow Core (NIH P30 DK036836); pronuclei injection at the Transgenic Mouse Core of Harvard Medical School; and InDrop was at the Single Cell Core of Harvard Medical School. Supported by grants from the NIH (2R01 DK092541) and the JPB foundation to DM. CL is a Cancer Research Institute Irvington fellow; JRD and RGS were funded by American Diabetes Association Postdoctoral Fellowships (1-16-PDF-028 and 1-17-PMF-005); DZ by a PhD fellowship from the Boehringer Ingelheim Fonds; and WK by NIH fellowships (T32-GM007753 and F30AG046045).
Footnotes
DECLARATION OF INTERESTS
The authors declare no competing interests
AUTHOR CONTRIBUTIONS
Conceptualization: CL, JD, DZ, CB DM; Experimentation: CL, JD, DZ, RGS, WK; Original draft: CL, DM; Review & Editing: all authors. Supervision: CB, DM; Funding Acquisition: DM.
Publisher's Disclaimer: This is a PDF file of an unedited manuscript that has been accepted for publication. As a service to our customers we are providing this early version of the manuscript. The manuscript will undergo copyediting, typesetting, and review of the resulting proof before it is published in its final citable form. Please note that during the production process errors may be discovered which could affect the content, and all legal disclaimers that apply to the journal pertain.
References
- Bapat SP, Myoung SJ, Fang S, Liu S, Zhang Y, Cheng A, Zhou C, Liang Y, LeBlanc M, Liddle C, et al. Depletion of fat-resident Treg cells prevents age-associated insulin resistance. Nature. 2015;528:137–141. doi: 10.1038/nature16151. [DOI] [PMC free article] [PubMed] [Google Scholar]
- Bettelli E, Carrier Y, Gao W, Korn T, Strom TB, Oukka M, Weiner HL, Kuchroo VK. Reciprocal developmental pathways for the generation of pathogenic effector TH17 and regulatory T cells. Nature. 2006;441:235–238. doi: 10.1038/nature04753. [DOI] [PubMed] [Google Scholar]
- Buenrostro JD, Giresi PG, Zaba LC, Chang HY, Greenleaf WJ. Transposition of native chromatin for fast and sensitive epigenomic profiling of open chromatin, DNA-binding proteins and nucleosome position. Nat Methods. 2013;10:1213–1218. doi: 10.1038/nmeth.2688. [DOI] [PMC free article] [PubMed] [Google Scholar]
- Chen WY, Hong J, Gannon J, Kakkar R, Lee RT. Myocardial pressure overload induces systemic inflammation through endothelial cell IL-33. Proc Natl Acad Sci U S A. 2015;112:7249–7254. doi: 10.1073/pnas.1424236112. [DOI] [PMC free article] [PubMed] [Google Scholar]
- Cipolletta D, Cohen P, Spiegelman BM, Benoist C, Mathis D. Appearance and disappearance of the mRNA signature characteristic of Treg cells in visceral adipose tissue: age, diet, and PPARgamma effects. Proc Natl Acad Sci U S A. 2015;112:482–487. doi: 10.1073/pnas.1423486112. [DOI] [PMC free article] [PubMed] [Google Scholar]
- Cipolletta D, Feuerer M, Li A, Kamei N, Lee J, Shoelson SE, Benoist C, Mathis D. PPAR-γ is a major driver of the accumulation and phenotype of adipose tissue Treg cells. Nature. 2012;486:549–553. doi: 10.1038/nature11132. [DOI] [PMC free article] [PubMed] [Google Scholar]
- Cretney E, Xin A, Shi W, Minnich M, Masson F, Miasari M, Belz GT, Smyth GK, Busslinger M, Nutt SL, et al. The transcription factors Blimp-1 and IRF4 jointly control the differentiation and function of effector regulatory T cells. Nat Immunol. 2011;12:304–311. doi: 10.1038/ni.2006. [DOI] [PubMed] [Google Scholar]
- Feuerer M, Herrero L, Cipolletta D, Naaz A, Wong J, Nayer A, Lee J, Goldfine AB, Benoist C, Shoelson S, et al. Lean, but not obese, fat is enriched for a unique population of regulatory T cells that affect metabolic parameters. Nat Med. 2009;15:930–939. doi: 10.1038/nm.2002. [DOI] [PMC free article] [PubMed] [Google Scholar]
- Grun D, Lyubimova A, Kester L, Wiebrands K, Basak O, Sasaki N, Clevers H, van OA. Single-cell messenger RNA sequencing reveals rare intestinal cell types. Nature. 2015;525:251–255. doi: 10.1038/nature14966. [DOI] [PubMed] [Google Scholar]
- Heinz S, Benner C, Spann N, Bertolino E, Lin YC, Laslo P, Cheng JX, Murre C, Singh H, Glass CK. Simple combinations of lineage-determining transcription factors prime cis-regulatory elements required for macrophage and B cell identities. Mol Cell. 2010;38:576–589. doi: 10.1016/j.molcel.2010.05.004. [DOI] [PMC free article] [PubMed] [Google Scholar]
- Hill JA, Feuerer M, Tash K, Haxhinasto S, Perez J, Melamed R, Mathis D, Benoist C. Foxp3 transcription-factor-dependent and -independent regulation of the regulatory T cell transcriptional signature. Immunity. 2007;27:786–800. doi: 10.1016/j.immuni.2007.09.010. [DOI] [PubMed] [Google Scholar]
- Josefowicz SZ, Lu LF, Rudensky AY. Regulatory T cells: mechanisms of differentiation and function. Annu Rev Immunol. 2012;30:531–564. doi: 10.1146/annurev.immunol.25.022106.141623. [DOI] [PMC free article] [PubMed] [Google Scholar]
- Klein AM, Mazutis L, Akartuna I, Tallapragada N, Veres A, Li V, Peshkin L, Weitz DA, Kirschner MW. Droplet barcoding for single-cell transcriptomics applied to embryonic stem cells. Cell. 2015;161:1187–1201. doi: 10.1016/j.cell.2015.04.044. [DOI] [PMC free article] [PubMed] [Google Scholar]
- Koch MA, Thomas KR, Perdue NR, Smigiel KS, Srivastava S, Campbell DJ. T-bet(+) Treg cells undergo abortive Th1 cell differentiation due to impaired expression of IL-12 receptor beta2. Immunity. 2012;37:501–510. doi: 10.1016/j.immuni.2012.05.031. [DOI] [PMC free article] [PubMed] [Google Scholar]
- Kolodin D, van PN, Li C, Magnuson AM, Cipolletta D, Miller CM, Wagers A, Germain RN, Benoist C, Mathis D. Antigen- and cytokine-driven accumulation of regulatory T cells in visceral adipose tissue of lean mice. Cell Metab. 2015;21:543–557. doi: 10.1016/j.cmet.2015.03.005. [DOI] [PMC free article] [PubMed] [Google Scholar]
- Kouskoff V, Signorelli K, Benoist C, Mathis D. Cassette vectors directing expression of T cell receptor genes in transgenic mice. J Immunol Methods. 1995;180:273–280. doi: 10.1016/0022-1759(95)00002-r. [DOI] [PubMed] [Google Scholar]
- Langmead B, Salzberg SL. Fast gapped-read alignment with Bowtie 2. Nat Methods. 2012;9:357–359. doi: 10.1038/nmeth.1923. [DOI] [PMC free article] [PubMed] [Google Scholar]
- Lara-Astiaso D, Weiner A, Lorenzo-Vivas E, Zaretsky I, Jaitin DA, David E, Keren-Shaul H, Mildner A, Winter D, Jung S, et al. Chromatin state dynamics during blood formation. Science. 2014;345:943–949. doi: 10.1126/science.1256271. [DOI] [PMC free article] [PubMed] [Google Scholar]
- Levine AG, Arvey A, Jin W, Rudensky AY. Continuous requirement for the TCR in regulatory T cell function. Nat Immunol. 2014;15:1070–1078. doi: 10.1038/ni.3004. [DOI] [PMC free article] [PubMed] [Google Scholar]
- Love MI, Huber W, Anders S. Moderated estimation of fold change and dispersion for RNA-seq data with DESeq2. Genome Biol. 2014;15:550. doi: 10.1186/s13059-014-0550-8. [DOI] [PMC free article] [PubMed] [Google Scholar]
- Malchow S, Leventhal DS, Nishi S, Fischer BI, Shen L, Paner GP, Amit AS, Kang C, Geddes JE, Allison JP, et al. Aire-dependent thymic development of tumor-associated regulatory T cells. Science. 2013;339:1219–1224. doi: 10.1126/science.1233913. [DOI] [PMC free article] [PubMed] [Google Scholar]
- Molofsky AB, Van GF, Liang HE, Van Dyken SJ, Nussbaum JC, Lee J, Bluestone JA, Locksley RM. Interleukin-33 and interferon-gamma counter-regulate group 2 innate lymphoid cell activation during immune perturbation. Immunity. 2015;43:161–174. doi: 10.1016/j.immuni.2015.05.019. [DOI] [PMC free article] [PubMed] [Google Scholar]
- Moran AE, Holzapfel KL, Xing Y, Cunningham NR, Maltzman JS, Punt J, Hogquist KA. T cell receptor signal strength in Treg and iNKT cell development demonstrated by a novel fluorescent reporter mouse. J Exp Med. 2011;208:1279–1289. doi: 10.1084/jem.20110308. [DOI] [PMC free article] [PubMed] [Google Scholar]
- Panduro M, Benoist C, Mathis D. Tissue Tregs. Annu Rev Immunol. 2016;34:609–633. doi: 10.1146/annurev-immunol-032712-095948. [DOI] [PMC free article] [PubMed] [Google Scholar]
- Picelli S, Faridani OR, Bjorklund AK, Winberg G, Sagasser S, Sandberg R. Full-length RNA-seq from single cells using Smart-seq2. Nat Protoc. 2014;9:171–181. doi: 10.1038/nprot.2014.006. [DOI] [PubMed] [Google Scholar]
- Quinlan AR, Hall IM. BEDTools: a flexible suite of utilities for comparing genomic features. Bioinformatics. 2010;26:841–842. doi: 10.1093/bioinformatics/btq033. [DOI] [PMC free article] [PubMed] [Google Scholar]
- Rubtsov YP, Rasmussen JP, Chi EY, Fontenot J, Castelli L, Ye X, Treuting P, Siewe L, Roers A, Henderson WR, Jr, et al. Regulatory T cell-derived interleukin-10 limits inflammation at environmental interfaces. Immunity. 2008;28:546–558. doi: 10.1016/j.immuni.2008.02.017. [DOI] [PubMed] [Google Scholar]
- Schiering C, Krausgruber T, Chomka A, Frohlich A, Adelmann K, Wohlfert EA, Pott J, Griseri T, Bollrath J, Hegazy AN, et al. The alarmin IL-33 promotes regulatory T-cell function in the intestine. Nature. 2014;513:564–568. doi: 10.1038/nature13577. [DOI] [PMC free article] [PubMed] [Google Scholar]
- Trapnell C, Roberts A, Goff L, Pertea G, Kim D, Kelley DR, Pimentel H, Salzberg SL, Rinn JL, Pachter L. Differential gene and transcript expression analysis of RNA-seq experiments with TopHat and Cufflinks. Nat Protoc. 2012;7:562–578. doi: 10.1038/nprot.2012.016. [DOI] [PMC free article] [PubMed] [Google Scholar]
- van der Maaten L, Hinton G. Visualizing high-dimensional data using t-SNE. Journal of Machine Learning Research. 2008;9:2579–2605. [Google Scholar]
- Vasanthakumar A, Moro K, Xin A, Liao Y, Gloury R, Kawamoto S, Fagarasan S, Mielke LA, Afshar-Sterle S, Masters SL, et al. The transcriptional regulators IRF4, BATF and IL-33 orchestrate development and maintenance of adipose tissue-resident regulatory T cells. Nat Immunol. 2015;16:276–285. doi: 10.1038/ni.3085. [DOI] [PubMed] [Google Scholar]
- Wu Y, Borde M, Heissmeyer V, Feuerer M, Lapan AD, Stroud JC, Bates DL, Guo L, Han A, Ziegler SF, et al. FOXP3 controls regulatory T cell function through cooperation with NFAT. Cell. 2006;126:375–387. doi: 10.1016/j.cell.2006.05.042. [DOI] [PubMed] [Google Scholar]
- Zilionis R, Nainys J, Veres A, Savova V, Zemmour D, Klein AM, Mazutis L. Single-cell barcoding and sequencing using droplet microfluidics. Nat Protoc. 2017;12:44–73. doi: 10.1038/nprot.2016.154. [DOI] [PubMed] [Google Scholar]
Associated Data
This section collects any data citations, data availability statements, or supplementary materials included in this article.
Supplementary Materials
(A) Frequencies of Vα2+Vβ4+ cells in Treg, Tconv, and CD8+ T cells (left) and numbers of total Tregs (right) from various tissues of 20wk-old Tg− and Tg+ mice (n=8).
(B) Frequencies of Vα2+Vβ4+ Treg (above) or Tconv (below) cells from Tg+ male mice at various ages (n≥5).
(C) Frequencies of thymic Vα2+Vβ4+ Treg and Tconv cells from male Tg+ mice at various ages (n≥4).
(D) Representative dot-plots of T cells from 10wk-old male Tg+Rag1+/+ (left) or Tg+ Rag1−/−mice (right).
(E) Summary data showing frequencies (left) and numbers (right) of Treg cells from various tissues of 10–12wk-old Tg+Rag1−/− male mice (n=7). Numbers refer to the fraction of cells in the indicated gate. Thy, thymus; LN, lymph node. Other abbreviations as per Fig. 1.
(A) Validation of the Pparg-Tdt reporter mice. VAT from 16wk-old Pparg-TdtKI/KI or wild-type B6 mice were extracted for total RNA and subjected to reverse transcription for cDNA synthesis using the Tdt-RT-REV primer. The isoforms of Pparg were identified by PCR using oligonucleotides specific to either Pparg1 (Pparg1-FWD) or Pparg2 (Pparg2-FWD) in combination with Tdt-RT-REV. Above: scheme of the design. Below: representative agarose gel electrophoresis of the PCR products.
(B) ST2, KLRG1, and GATA3 expression in splenic and VAT Tregs from 20wk-old Tg− and Tg+ male mice (n≥5).
(C) PPARγ expression in Treg cells from various tissues of 20wk-old Tg− and Tg+ male mice (n=5). N.D., not detectable (due to low cell numbers).
(D) Frequencies (left) and numbers (right) of total VAT Tregs from 14–16wk-old Tg− and Tg+ male mice (n≥5).
(E) Representative dot-plots showing the gating strategy for identification of inflammatory MFs from VAT of 14–16wk-old Tg− and Tg+ male mice. Numbers indicate fraction of cells within the designated gate. Corresponding summary data appear in Fig. 1F.
(F) PCR quantification of inflammatory gene transcripts in VAT from 14–16wk-old Tg− and Tg+ male mice (n=8).
(G) Body (left) and VAT (right) weights of 14–16wk-old Tg− and Tg+ male mice (n≥5).
(H) Correlation of homeostatic model assessment of insulin resistance (HOMA-IR) with number of VAT Tregs in 14–16wk-old Tg− and Tg+ male mice (n≥5). Numbers refer to the fraction of cells in the indicated gate. Abbreviations as per Fig. 1.
(A) Frequencies and numbers of VAT ILC2s from 10wk-old Tg+ Il1rl1+/+ or Tg+ Il1rl1f/f Foxp3-Cre male mice (n=4).
(B) Frequencies of KLRG1+ Treg cells from VAT of 36wk-old Tg− Il1rl1+/+Foxp3-Cre and Il1rl1f/f Foxp3-Cre male littermates (n≥6). Numbers refer to the fraction of cells in the indicated gate. Abbreviations as per Fig. 1.
(A) FC/FC plot of gene-expression values in 8–10wk-old Tg− VAT vs spleen Tregs compared with Tg− PPARγlo versus PPARγ− splenic Tregs (n=3). Left: VAT-Treg signature genes highlighted in red (induced) or blue (repressed). Right: VAT-Treg signature genes minus CD44hi Treg signature genes highlighted in red (induced) or blue (repressed). Bold values to the side indicate the number of signature genes induced (right) or repressed (left) in VAT Tregs that were changed (top and bottom) or not changed (middle) by more than two-fold in PPARγlo compared with PPARγ− splenic Tregs.
(B) PPARγ− Treg cells were sorted from pooled spleen and LNs of 8wk-old Tg− or Tg+ CD45.2+ Pparg-TdtKI/+ Foxp3-GFPKI/y male mice and cultured with 1000U/mL IL-2 alone or in combination with anti-CD3/28 beads at a 1:2 ratio for 3 days (n=3). Left: representative dot-plots for PPARγ induction. Numbers refer to the fraction of PPARγ+ cells within the gate. Right: corresponding summary plots. Abbreviations as per Fig. 1.
(A) Genome-browser tracks of Tg+ Treg ATAC-seq reads at some PPARγ-dependent genes, as defined in (Cipolletta et al., 2012).
(B) Hierarchical clustering of all OCRs ±100Kb of VAT up-signature genes. Delineation of five clusters, labeled by their accessibility signal in thymic (T), splenic (S), or VAT (V) Tregs.