

Summary
The seven transmembrane-spanning protein Smoothened is the central transducer in Hedgehog signaling, a pathway fundamental in development and cancer. Smoothened is activated by cholesterol binding to its extracellular cysteine-rich domain (CRD). How this interaction leads to changes in the transmembrane domain and Smoothened activation is unknown. Here, we report crystal structures of sterol-activated Smoothened. The CRD undergoes a dramatic reorientation, allosterically causing the transmembrane domain to adopt a conformation similar to active G protein-coupled receptors. We show that Smoothened contains a unique inhibitory π-cation lock, which is broken upon activation and is disrupted in constitutively active oncogenic mutants. Smoothened activation opens a hydrophobic tunnel, suggesting a pathway for cholesterol movement from the inner membrane leaflet to CRD. All Smoothened antagonists bind the transmembrane domain and block tunnel opening, but cyclopamine also binds the CRD, inducing the active transmembrane conformation. Together, these results define the mechanisms of Smoothened activation and inhibition.
In brief
Crystal structures of sterol-bound Smoothened molecules reveal active conformations reminiscent of other classes of G protein-coupled receptors.

Introduction
The Hedgehog (Hh) signaling pathway is one of a small number of core pathways (Gerhart, 1999) that orchestrate animal development (Ingham and McMahon, 2001; Lum and Beachy, 2004), and, when activated in uncontrolled manner, is involved in several cancers, including basal cell carcinoma (BCC) and medulloblastoma. Hh signals are transduced across the plasma membrane by the seven-transmembrane (7TM) domain oncoprotein Smoothened (SMO) (Alcedo et al., 1996; van den Heuvel and Ingham, 1996). In the resting state of the Hh pathway, SMO is inhibited by the tumor suppressor membrane protein PATCHED (PTCH) (Nakano et al., 1989), ensuring that no Hh signals are transmitted to the cytoplasm. In the stimulated state of the Hh pathway, the secreted HH ligand binds PTCH and inhibits it, leading to SMO activation. Active SMO then triggers the downstream chain of signal transduction events, which culminates with the execution of a specific transcriptional program.
How SMO is regulated has long been a central question in Hh signaling. SMO belongs to Class F of the G protein-coupled receptor (GPCR) superfamily, characterized by an extracellular cysteine-rich domain (CRD), followed by an extracellular linker domain (LD) that leads to the 7TM domain. Similar to classical GPCRs, it was proposed that SMO output is governed by the equilibrium between active and inactive conformations, under the control of a small molecule ligand, which, in turn, is regulated by PTCH (Taipale et al., 2002). Recently, cholesterol was identified as the endogenous SMO ligand (Byrne et al., 2016; Huang et al., 2016). Cholesterol activates SMO by binding to a site in the CRD. Conversely, cholesterol is necessary for SMO activation during Hh signaling, as demonstrated by CRD mutations that abolish binding to cholesterol (Byrne et al., 2016; Huang et al., 2016). Interestingly, in addition to the sterol-binding site in CRD, vertebrate SMO harbors a second small molecule-binding site in the 7TM domain, referred to as orthosteric site, by analogy to the primary agonist-binding site of GPCRs. Although its role in Hh signaling is uncertain (Huang et al., 2016), the 7TM site binds numerous synthetic SMO modulators, including antagonists (SANT1 (Frank-Kamenetsky et al., 2002), LY2940680 (Chen et al., 2002a; Wang et al., 2013), and vismodegib (Robarge et al., 2009)) and agonists (SAG (Chen et al., 2002b; Frank-Kamenetsky et al., 2002) and purmorphamine (Sinha and Chen, 2006)). A unique SMO modulator is the sterol alkaloid, cyclopamine, which binds both CRD (Huang et al., 2016; Nachtergaele et al., 2013) and 7TM (Chen et al., 2002a) sites. Although cyclopamine acts as an antagonist at the 7TM site, it displays partial agonist properties: it induces SMO accumulation in primary cilia (Rohatgi et al., 2009; Wang et al., 2009; Wilson et al., 2009), a hallmark of SMO activation (Corbit et al., 2005), while cyclopamine binding to the CRD activates a SMO mutant in which binding to the 7TM site is abolished (Huang et al., 2016).
Recently, insight into SMO regulation has been obtained from a number of crystal structures of constructs consisting of the LD and 7TM (referred to as SMOΔCRD) (Wang et al., 2014; Wang et al., 2013; Weierstall et al., 2014), or the CRD, LD and 7TM together (referred to as full-length SMO) (Byrne et al., 2016; Zhang et al., 2017a). Without exception, the reported structures capture the 7TM domain in inactive conformation, which is similar to the inactive conformation of Class A and B GPCRs. This can be explained by the use of small molecule antagonists (Byrne et al., 2016; Wang et al., 2014; Wang et al., 2013; Weierstall et al., 2014; Zhang et al., 2017a) or of an inactivating mutation (Byrne et al., 2016), to stabilize the 7TM domain and improve yield during protein purification and crystallization. More surprisingly, agonist-bound SMOΔCRD also crystallizes with the 7TM in inactive conformation (Wang et al., 2014). Finally, the structure of full-length SMO is essentially the same whether the CRD is bound to cholesterol or not (Byrne et al., 2016; Zhang et al., 2017a), leaving the agonist function of cholesterol unexplained.
Many critical questions regarding SMO remain thus open. It is unknown how binding of cholesterol leads to SMO activation and what is the nature of the active conformation. It is also unclear where the activating cholesterol molecule comes from during Hh signaling. Furthermore, in the absence of structural information for active SMO, the mechanism of small molecule modulators remains poorly understood, hampering drug design, in particular for inhibitors of constitutively active, oncogenic SMO mutants. Lastly, the mechanistic basis for the unique behavior of cyclopamine is unknown.
Here, we use structural and functional approaches to address these critical questions in Hh signaling. We solve two X-ray structures of active full-length SMO, one bound to cholesterol and the other to cyclopamine. In both structures, the CRD undergoes a dramatic reorientation, suggesting a mechanism for how sterol-bound CRD activates the 7TM domain; we provide evidence for such allosteric communication. The 7TM domain undergoes a conformational change reminiscent of Class A and Class B GPCR activation, which is surprising, given the low sequence homology, and the lack of conservation in SMO of residues critical for the interaction between “classical” GPCRs and heterotrimeric G proteins. We discover that SMO activation breaks a π-cation interaction conserved in Class F GPCRs, and we use structure-guided mutagenesis to demonstrate that this interaction acts as an essential lock that stabilizes the inactive state. Importantly, this lock is destroyed in the oncogenic SMO-M2 mutant that causes sporadic BCC (Xie et al., 1998), explaining its constitutive activity. By comparing active and inactive SMO, we provide an explanation for the mechanism of SMO modulation by 7TM site ligands. We also find that SMO binds simultaneously two molecules of cyclopamine, and that the cyclopamine-bound CRD induces the 7TM domain to adopt an active conformation; this explains the unusual effects of cyclopamine in Hh signaling. Finally, we discover that active SMO harbors a conserved longitudinal tunnel, lined with mostly hydrophobic residues. The tunnel has one opening towards the inner leaflet of the plasma membrane and the other towards the extracellular space. We speculate that this unique feature is involved in SMO regulation, by allowing cholesterol transport to the CRD site.
Results
Structures of sterol-activated full-length SMO
To elucidate the mechanism of SMO activation, we set out to determine the structure of SMO in complex with sterols. We designed a crystallization construct consisting of wild type full-length Xenopus laevis SMO (xSMO, Fig. S1), with its intracellular loop 3 (ICL3) replaced by thermostabilized apocytochrome b562RIL (BRIL), as used for hSMO (Byrne et al., 2016). The protein was expressed and purified from baculovirus-infected Sf9 cells, and was crystallized in lipidic cubic phase (LCP) using the twin-syringe reconstitution method (Caffrey and Cherezov, 2009).
We first determined the X-ray structure of xSMO in complex with cyclopamine (3.7Å resolution, Figs.1A, B, and Table S1), chosen because of its partial agonist properties. The asymmetric unit contains one copy of xSMO, displaying type-I packing typical for LCP crystals (Fig. S2A). Clear electron density maps were observed and were of sufficient quality to enable structure refinement for the entire xSMO polypeptide, including the CRD, LD, 7TM domain, and BRIL fusion (Fig. S2B–D). Analysis of electron density showed that each xSMO molecule binds two molecules of cyclopamine, one occupying the CRD site (Fig. S2E, F) and the other the 7TM site (Fig. S2G, H). Individually, the CRD and LD have similar structures to those previously seen in human SMO (hSMO) (Byrne et al., 2016; Zhang et al., 2017a). As expected, the 7TM domain adopts the heptahelical bundle fold characteristic for the GPCR superfamily.
Figure 1.

Structures of sterol-activated full-length SMO
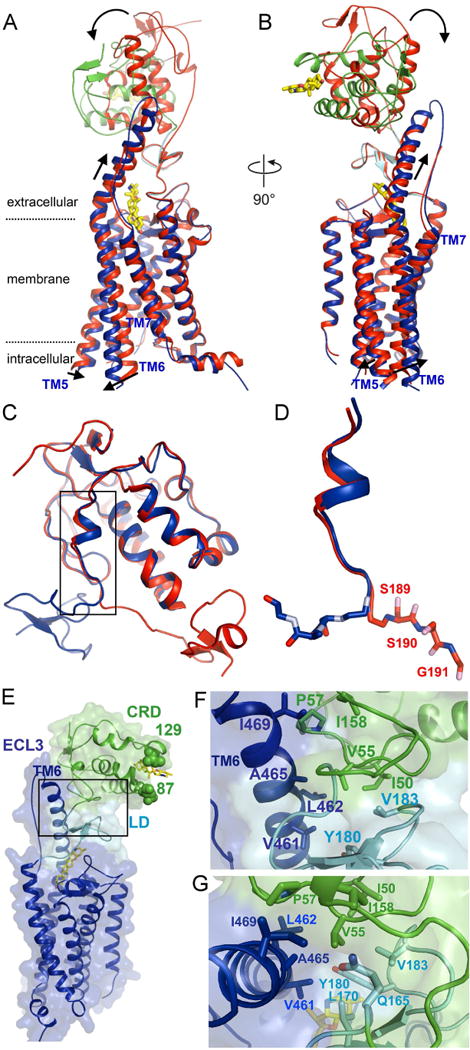
(A) Ribbon model showing overall structure of cyclopamine-bound full-length Xenopus SMO. The CRD is shown in green, LD in cyan, and 7TM domain in blue. The two bound cyclopamine molecules are shown as yellow sticks. Individual transmembrane (TM) helices are numbered. Also shown are the intracellular amphipatic helix H8, and the third extracellular loop (ECL3). The membrane bilayer is indicated by the dotted lines. See also Fig. S1 for an alignment of SMO homologs, showing the various domains and structure elements.
(B) As in (A), but showing a view rotated by 90 degrees.
(C) Overlay of cyclopamine-bound and cholesterol-bound active xSMO. For the cyclopamine-bound structure, the domains are colored as in (A). The cholesterol-bound structure is shown in light blue. Cyclopamine and cholesterol are shown as yellow sticks. The two structures are nearly identical.
We also solved the structure of xSMO bound to cholesterol, the endogenous SMO activator in Hh signaling (3.9Å resolution, Fig. 1C and Table S1). This structure shows a cholesterol molecule in the CRD site (Fig. S2I, J), while the 7TM site is unoccupied. The cyclopamine- and cholesterol-bound xSMO structures are nearly identical, including CRD orientation, domain-domain interface, and 7TM conformation (Fig. 1C); below, we discuss them together.
Sterol-bound CRD undergoes dramatic reorientation in active SMO
Recent structures of full-length hSMO are almost identical (Fig. S3A), irrespective of whether the CRD is bound to cholesterol or not (Byrne et al., 2016; Zhang et al., 2017a). This is surprising, given that cholesterol activates SMO, so it is reasonable to expect significant change in CRD position. Gratifyingly, in our sterol-activated structures, the CRD rotates approximately 100 degrees, moving from directly on top of the LD, to a position closer to the membrane, leaning against TM6 (Fig. 2A, B). The sterol-binding site is completely exposed to solvent, and the sterol molecule is oriented parallel to the membrane (Fig. 1B). The back surface of the CRD contacts the extracellular portion of TM6, which adopts an elongated α-helical conformation, with additional turns as compared to inactive SMO (Fig. 1A, B).
Figure 2.
Sterol binding induces dramatic reorientation of the CRD of SMO
(A) Ribbon model showing the structure of cyclopamine-bound, active xSMO, superimposed on the structure of vismodegib-bound, inactive hSMO (PDB ID: 5L7I). For the active SMO structure, the CRD is shown in green, LD in cyan, 7TM domain in blue, and cyclopamine is yellow. The inactive SMO structure is in red. CRD rotation and 7TM opening upon SMO activation are indicated with arrows. See also Movie S1 illustrating sterol-induced conformational changes.
(B) As in (A), but showing a view rotated by 90 degrees.
(C) Overlay of cyclopamine-bound xSMO (blue) and vismodegib-bound hSMO (red), showing their ectodomains, consisting of CRD, connector and LD. The last residues in the connector are responsible for sterol-induced CRD reorientation. See also Fig. S3B for a zoomed out view showing the entire receptors.
(D) As in (C), but showing a close up view of the connector, with the SSG switch motif shown in sticks. The residue numbers correspond to hSMO.
(E) Overall structure of cyclopamine-bound active xSMO, showing the tri-domain interface between CRD, LD and TM6. Domain colors are as in (A). Shown in sphere are residues 87 and 129, corresponding to residues 114 and 156 in hSMO, where introduction of a glycosylation site leads to constitutive activity. Note that these two positions are completely exposed in active xSMO, compatible with the presence of glycan chains. See also Fig. S3D, showing the same residues buried in inactive hSMO.
(F) As in (E), but showing a close up view of the tri-domain interface. The V55 residue of the CRD is at the center of a cavity formed by mostly hydrophobic residues in CRD, LD and the extracellular extension of TM6. (G) As in (F), but showing a view rotated by 90 degrees.
In spite of the dramatic reorientation of the CRD, most of the polypeptide chain that connects CRD and LD (the connector) remains unchanged. In both inactive and active SMO, the connector traverses a hydrophobic cleft along the CRD (Fig. 2C), and displays the same conformation for most of its length. The last three residues near the cleft exit (S162, S163 and G164, which we term “switch motif”, Fig. S1), however, adopt an altered conformation, a change responsible for reorientation of the entire CRD-connector globular domain upon activation (Figs.2C, 2D and S3B). In active SMO, the CRD-connector domain forms a new ternary junction with the LD (557.3 Å2 buried surface area) and the extracellular portion of TM6 (546.3 Å2 buried surface area) (Fig. 2E). In the center of this junction is residue V55 of xSMO CRD, surrounded by mostly hydrophobic residues from all three participating domains, thus stabilizing the overall architecture (Fig. 2F, G); in contrast, the corresponding V82 residue in inactive hSMO is completely exposed (Fig. S3C). Interestingly, by docking the structure of the xWNT8-mFRIZZLED8 CRD complex (Janda et al., 2012) on top of the CRD of active xSMO, we find that the “index finger” of xWNT8 is perched at the CRD-TM6 junction (Fig. S3D); this suggests a possible role of the unusually long TM6 in Class F receptors as a lever arm involved in transmitting ligand-induced extracellular interactions across the membrane (see below).
Active conformation of SMO 7TM domain reveals conservation with Class A and B GPCRs
The hallmark of activation in “classical” GPCRs is a conserved rearrangement of the 7TM domain, which generates the binding site for the downstream heterotrimeric G protein (Manglik and Kruse, 2017). In our sterol-activated SMO structures, the 7TM undergoes a conformational change (Figs. 3A, B) similar to that seen in all active GPCR structures reported to date, belonging to Class A and B. Specifically, TM6 of SMO displays a major outward movement, accompanied by a more minor movement of TM5. The result of these TM movements is the opening of a cavity on the cytoplasmic side of SMO. The 7TM conformational change in SMO most closely resembles that in rhodopsin (Choe et al., 2011) (Figs.3C, D) and in the M2 muscarinic acetylcholine receptor (Kruse et al., 2013) (Fig. S4A). The conformational rearrangement in SMO is less dramatic when compared to the active β2 adrenergic receptor (β2AR, Fig. S4B) and glucagon-like peptide 1 receptor (GLP-1R, Figs.S4C, D), both in complex with Gs protein (Rasmussen et al., 2011; Zhang et al., 2017b); in these structures, binding of the C-terminus of the Gα subunit further displaces the cytoplasmic end of TM6.
Figure 3.

Active conformation of SMO 7TM resembles active classical GPCRs
(A) Ribbon model showing the 7TM domain of cyclopamine-bound xSMO (blue), superimposed on the 7TM domain of vismodegib-bound hSMO (red, PDB ID: 5L7I). Note the movement of TM6 and TM5. See also Movie S1 illustrating 7TM conformational changes upon SMO activation.
(B) As in (A), but showing a view rotated by 90 degrees, from the cytoplasmic side.
(C) As in (A), but showing superposition of active (green, PDB ID: 3PQR) and inactive (pink, PDB ID: 1U19) rhodopsin. For active-inactive comparisons of other Class A and B GPCRs, see also Fig. S4A–D.
(D) As in (C), but showing a view rotated by 90 degrees, from the cytoplasmic side.
While the active conformations of SMO and Class A and B GPCRs are globally similar, the local details vary significantly, particularly close to the extracellular side, which harbors residues responsible for the distinct ligand-binding properties of the receptors. In active SMO, TM6 forms a long, tilted α-helical extension into the extracellular space, which moves slightly outward, in synchrony with the greater outward displacement of the cytoplasmic end of TM6 (Fig. 2A). In Class A GPCRs, the proline residue in the conserved NPxxY motif induces a kink in TM7, which is important for additional conformational switches upon activation (Manglik and Kruse, 2017). As this motif is absent in SMO, the corresponding region forms a straight helix and moves slightly upward in the active state, causing partial unwinding at the intracellular end of the helix, which connects to the short C-terminal amphipathic helix H8 (Figs.2A and 3A).
Taken together, the results above suggest that our two sterol-bound SMO structures capture the active state of the 7TM domain, and that the activation mechanism is remarkably conserved between SMO and “classical” GPCRs, despite low sequence similarity.
SMO activation breaks a π–cation lock essential for stabilizing the inactive state
All inactive GPCR structures reported to date show similar 7TM conformations, particularly the invariable “closed” state of TM6. Stabilization of the inactive conformation is critical for keeping GPCRs off in the absence of stimulation, and is accomplished by interactions referred to as “locks”. Mutations that disrupt these locks usually lead to increased basal activity. In Class A GPCRs, the arginine in the conserved E/DRY motif at the cytoplasmic end of TM3 forms a salt bridge with a glutamate in TM6 (Figs. S4E, F); this “ionic lock” prevents the outward opening of TM6 necessary for activation (Cherezov et al., 2007; Haga et al., 2012; Manglik and Kruse, 2017; Okada et al., 2004). In Class B GPCRs, the HETX motif serves to stabilize the inactive conformation by forming a hydrogen bond network that restricts TM6 movement (Jazayeri et al., 2016) (Figs. S4G, H).
Since these motifs are absent in Class F GPCRs, we asked if there is an analogous mechanism that stabilizes the inactive conformation of SMO. We noticed that, in all inactive hSMO structures, the positively charged guanidine group of R451 in TM6 (R424 in xSMO) is positioned close to the aromatic electron density of W535 (W508 in xSMO) in TM7, capable of forming a strong π–cation interaction (Fig. 4A). Strikingly, the side chain of xR424 rotates away from xW508 in active xSMO, breaking the interaction (Figs.4B, C). As π–cation interactions are frequently used as switches in signaling, for example in nuclear hormone receptors (Huang et al., 2010), we reasoned that the one we observed in SMO might define a “π–cation lock” that keeps SMO inactive. Interestingly, W535 is mutated to L in the oncogenic SMO-M2 mutant identified in sporadic BCC (Xie et al., 1998). Replacing an aromatic residue with an aliphatic one is expected to abolish π–cation interaction, suggesting an explanation for the constitutive activity of SMO-M2, which has long been an open question in Hh signaling.
Figure 4.

A conserved π-cation lock essential for stabilizing the inactive state of SMO
(A) Ribbon model of the inactive 7TM domain of vismodegib-bound hSMO (red, PDB ID: 5L7I), seen from the cytoplasmic side. Individual transmembrane helices are numbered. The conserved R451 and W535 residues from TM6 and TM7 are involved in a π-cation interaction.
(B) As in (A), but showing the active 7TM domain in cyclopamine-bound xSMO. The corresponding R424 and W508 residues have moved apart, breaking the π-cation interaction.
(C) Left panel: overall structure comparison between active cyclopamine-bound (blue) and vismodegib-bound (red) SMO, with the R and W residues shown in sticks. Right panel: close up, side view of the π-cation lock, and its breakage upon SMO activation.
(D) Mouse SMO (mSMO) constructs, tagged with mCHERRY, were expressed in 293T cells, and binding to BODIPY-cyclopamine was measured by automated fluorescence microscopy and image analysis. Ratio of bound BODIPY-cyclopamine to mCHERRY fluorescence intensities is shown as box plot. The upper and lower bounds of each box correspond to the 75th and 25th percentile of the distribution, and the horizontal line indicates the median. Mutations that disrupt the π-cation interaction between R455 and W539 reduce BODIPY-cyclopamine binding, indicative of mSMO shifting to an active conformation. The oncogenic SMO-M2 mutant corresponds to W539L. Drosophila SMO (dSMO) was used as negative control (Nedelcu et al., 2013). Between 600 and 1000 cells were measured per condition. ** p<5×10⁻⁸.
(E) As in (D), but with BODIPY-SANT1. Note the partial rescue of the W539L(M2) mutant by the T542D mutation. ** p<5×10⁻⁸. See also Fig. S5A–C for binding experiments using BODIPY-vismodegib, Fig. S5D for a model of the π-cation lock indicating the T542 residue, and Fig. S5E for a dose-response analysis of BODIPY-SANT1 binding to the partially rescued SMO-M2 mutant.
We used mutagenesis and functional assays to determine the role of the π–cation lock in controlling SMO. Briefly, mouse SMO (mSMO) mutants were expressed in cultured cells, and their conformation was assayed by binding to three different fluorescently labeled 7TM site antagonists: BODIPY-cyclopamine (Chen et al., 2002a), BODIPY-SANT1 (Nedelcu et al., 2013), and the novel BODIPY-vismodegib probe that we synthesized for this study (Figs. S5A, B). These antagonists were chosen because they occupy distinct positions in the 7TM orthosteric site. Replacing the W residue in mSMO with progressively smaller aromatic residues (W539F and W539H) leads to a gradual decrease in antagonist binding (Figs. 4D, 4E, and S5C); thus reducing the aromatic electron cloud weakens the π–cation interaction, causing a shift towards the active SMO conformation. Replacing W with L (W539L, corresponding to mSMO-M2) almost completely abolishes antagonist binding (Figs.4D, 4E, and S5C), consistent with SMO-M2 adopting the active conformation constitutively. We also assayed the effect of mutating the arginine residue involved in the π–cation lock. Antagonist binding to SMO was greatly decreased in mutants that remove or reverse the positive charge (R455A, R455Q and R455E), indicating that they adopt an active conformation (Figs.4D, 4E, and S5C). In contrast, antagonist binding was unaffected in a mutant that preserves the positive charge (R455K) and thus the π–cation interaction (Figs.4D, 4E, and S5C). Finally, we asked if providing additional stabilization to inactive SMO could reverse the constitutive activity of SMO-M2. We reasoned that introduction of a negative charge at T542 in mSMO will form a salt bridge with R455 (Fig. S5D), thereby re-enforcing the inactive conformation. Indeed, the double mutant mSMO W539L/T542D partially rescued antagonist binding (Figs.4D, 4E, and S5E); as expected, the T542D mutation by itself had no effect. We speculate that the relatively modest rescue might be due to the fact that T542D and R455 are exposed to solvent, which has a strong disruptive effect on salt bridges; in contrast, π–cation interactions are much less affected by the aqueous media (Gallivan and Dougherty, 1999). We also note that we did not observe rescue when using the closely related mSMO W539L/T542E double mutant (Figs.4D, 4E, and S5E), which illustrates the specificity of the compensatory mutation. Together, these results indicate that the π–cation lock between TM6 and TM7 is critical for maintaining SMO inactive and is broken upon activation, playing a similar role as the TM3-TM6 locks identified in “classical” GPCRs.
Allosteric activation of the 7TM domain by sterol-bound CRD
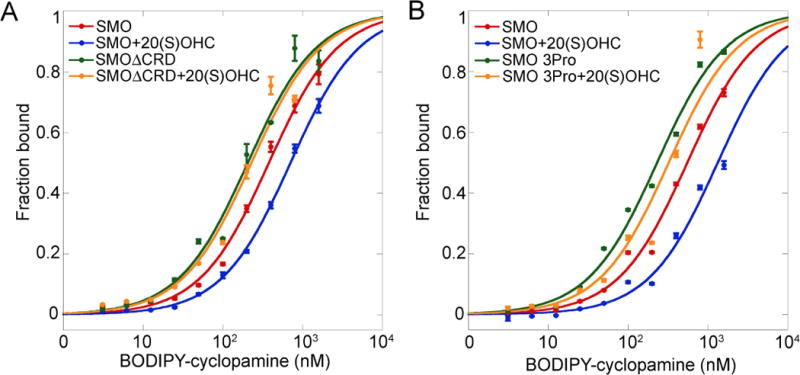
Cholesterol (Byrne et al., 2016; Huang et al., 2016) and oxysterols such as 20(S)-hydroxycholesterol [20(S)-OHC] (Corcoran and Scott, 2006; Dwyer et al., 2007; Nachtergaele et al., 2012) activate SMO, but how sterol binding to CRD leads to 7TM activation is unknown. SMO CRD has higher basal activity than full-length SMO, indicating that unliganded CRD represses the 7TM (Byrne et al., 2016; Myers et al., 2013). However, it is unclear if sterol binding only relieves repression, or whether sterol-bound CRD allosterically activates the 7TM. To distinguish between these possibilities, we measured binding of fluorescent 7TM antagonists to SMO, in the absence or presence of saturating levels of 20(S)-OHC. As expected, binding of all three tested antagonists was decreased by 20(S)-OHC, while 20(S)-OHC had no effect on antagonist binding to SMO CRD (Figs.5A, S5F and S5G). Importantly, 20(S)-OHC-activated SMO had lower affinity for the BODIPY antagonists than SMO CRD (Figs.5A, S5F and S5G), consistent with 20(S)-OHC-bound CRD allosterically activating the 7TM domain. Three observations deserve further mention. First, compared to SMO, SMO CRD shows reduced affinity for BODIPY-SANT1 and BODIPY-vismodegib (Figs.S5F, G), two “pure” 7TM antagonists; this is consistent with the idea that CRD removal increases SMO basal activity. Second, SMO CRD shows higher affinity than SMO for BODIPY-cyclopamine (Fig. 5A); this indicates that SMO CRD adopts a conformation, perhaps the TM5/6 open state, which favors binding to cyclopamine, a compound with partial agonist properties. Third, the fact that 20(S)-OHC reduces BODIPY-cyclopamine binding to SMO suggest that perhaps full activation of SMO involves an additional conformational change, which weakens cyclopamine binding (see Discussion).
Figure 5.
Allosteric activation of the 7TM domain of SMO by sterol-bound CRD
(A) 293T cells expressing HA-tagged mSMO or mSMO CRD were incubated with BODIPY-cyclopamine, in the absence or presence of 20(S)-OHC (10 μM). The cells were then stained with Alexa647-labeled mouse anti-HA antibodies, to reveal mSMO. Bound BODIPY-cyclopamine and mSMO expression were measured by flow cytometry. The graph shows ratios of BODIPY and Alexa647 intensities. Error bars indicate standard deviation. Activation of mSMO by 20(S)-OHC reduces affinity for BODIPY-cyclopamine. MSMO CRD is unaffected by 20(S)-OHC. See also Fig. S5F and S5G, for similar experiments using BODIPY-SANT1 and BODIPY-vismodegib.
(B) As in (A), but with an mSMO mutant in which the residues of the SSG “switch” motif were mutated to prolines. The mutant has a greatly reduced response to 20(S)-OHC.
The role of CRD reorientation in SMO activation
Several observations support the idea that the orientation of sterol-bound CRD observed in our structures corresponds to active SMO. First, mutations that introduce N-linked glycosylation sites at position 114 or 156 in hSMO CRD, lead to constitutive SMO activation (Byrne et al., 2016), indicating that the mutants are locked in active conformation. Glycan chains at these positions would sterically hinder the CRD arrangement seen in inactive hSMO (Fig. S3C), but they would be exposed to solvent and thus compatible with our xSMO structures (Fig. 2E). Second, the A86R mutation in the CRD of mSMO leads to enhanced binding to BODIPY-cyclopamine (Fig. S5H) and BODIPY-SANT1 (Fig. S5I), suggesting that the mutant is less active than wild type SMO. Introduction of a charged residue at this position is expected to destabilize the largely hydrophobic CRD-LD-TM6 interface seen in active SMO (Fig. 2F, G), while it should not affect the inactive SMO conformation (Byrne et al., 2016), in which this residue is solvent-exposed (Fig. S3C). Third, as pointed out before (Zhang et al., 2017a), cyclopamine binding to CRD is incompatible with the “common” architecture of inactive hSMO (Byrne et al., 2016; Zhang et al., 2017a), since it would partially clash with TM6. We find that cyclopamine-bound and cholesterol-bound CRD adopt identical orientations, consistent with our previous finding that cyclopamine functions as an agonist at the CRD site, activating a SMO mutant in which the 7TM site is destroyed (Huang et al., 2016).
We also asked if reorientation of sterol-bound CRD is required for 7TM activation. We reasoned that mutating the residues that comprise the switch motif (S162, S163 and G164 in mSMO) to prolines, which are conformationally restricted, should impair sterol-induced movement of CRD. As shown in Fig. 5B, the triple proline mutant behaves similar to SMO CRD, showing enhanced BODIPY-cyclopamine binding, which is largely unaffected by 20(S)-OHC. These results are consistent with CRD reorientation being required for allosteric activation of the 7TM domain by sterols. Finally, we note that, although SMO activation requires movement of the CRD away from the position it occupies in inactive SMO (Byrne et al., 2016; Zhang et al., 2017a), it is possible that the CRD orientation we observe is one among multiple active conformations, stabilized by specific crystal contacts.
The mechanistic basis for small molecule SMO antagonism
The structure of SMO has been determined in complex with a wide variety of 7TM ligands, including cyclopamine (Weierstall et al., 2014), the synthetic antagonists SANT1 (Wang et al., 2014), LY2940680 (Wang et al., 2013), Anta XV (Wang et al., 2014), TC114 (Zhang et al., 2017a), and vismodegib (Byrne et al., 2016), and the synthetic agonist SAG1.5 (Wang et al., 2014). These structures reveal an unusually deep cavity in the 7TM domain, and provide important insight into recognition of chemically diverse ligands. Here, by comparing these inactive structures with our active ones, we derive a mechanism for SMO modulation by 7TM ligands.
Cyclopamine represents a unique case, having been crystallized in complex with both inactive (Weierstall et al., 2014) and active SMO (this study). In both conformations, the 3β-hydroxyl of cyclopamine forms a hydrogen bond with the carboxylate of hE518/xE491 in TM7, which, in turn, stabilizes a hydrogen bond network located underneath (Figs.6A, B). This network involves hD473/xD446 from TM6, hR400/xR373 from TM5, hH470/xH443 from TM6, and hN521/xN494 from TM7, residues belonging to TM helices that undergo conformational movement upon activation in both SMO and Class A and B GPCRs. Upon SMO activation, the hydrogen bond is remodeled, to accommodate the Cα movements and side chain rotameric switches that accompany TM5/6 outward movement. This suggests that the same set of residues stabilize both inactive and active states, as seen for other GPCRs (Manglik and Kruse, 2017). Consistent with this idea, R400A, H470A and N521A mutations block binding of cyclopamine to hSMO (Wang et al., 2014), although these residues do not directly contact cyclopamine; this result underscores the dual role of the hydrogen bond network in stabilizing both conformations of SMO.
Figure 6.
Mechanism of SMO modulation by 7TM ligands
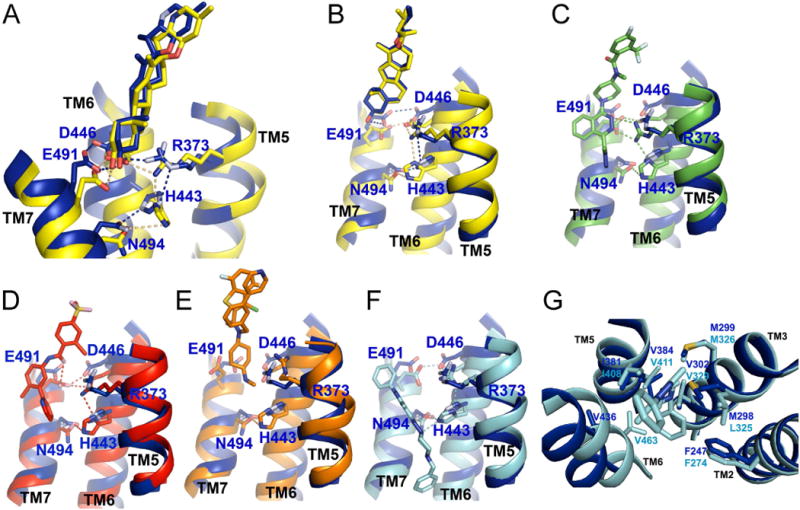
(A) Ribbon model showing the active cyclopamine-bound xSMO (blue) superimposed on inactive cyclopamine-bound hSMO (yellow, PDB ID: 4O9R). The 5 residues shown in sticks are connected by an adaptable hydrogen bond network, which stabilizes both inactive and active SMO conformations. The network is remodeled between the two conformations, but the participating residues are the same. Cyclopamine is unique among SMO antagonists, being compatible with both 7TM conformations. Note also the slight upward shift of TM7, and outward opening of TM5 and TM6. Residue numbers are from xSMO.
(B) As in (A), but showing a different view.
(C) As in (A), but with cyclopamine-bound xSMO (blue) superimposed on inactive LY2940680-bound hSMO (green, PDB ID: 4JKV).
(D) As in (A), but with cyclopamine-bound xSMO (blue) superimposed on inactive vismodegib-bound hSMO (red, PDB ID: 5L7I). See also Fig. S6A and S6B, showing inactive hSMO in complex with TC114 and ANTA XV.
(E) As in (A), but with cyclopamine-bound xSMO (blue) superimposed on SAG1.5-bound hSMO (orange, PDB ID: 4QIN). SAG1.5. Binding of SAG1.5 breaks the hydrogen bond network, and thus the TM coupling that stabilizes the inactive conformation.
(F) As in (A), but with cyclopamine-bound xSMO (blue) superimposed on inactive SANT1-bound hSMO (cyan, PDB ID: 4N4W). Note that SANT1 reaches much deeper into the 7TM site than the other ligands. (G) As in (F), but a different view, showing the insertion of the benzyl moiety of SANT1 in a hydrophobic cavity. This interaction strengthens inactive TM coupling, preventing TM6 from opening. Residues in blue are from xSMO, while residues in cyan are from hSMO. See also Fig. S6C, showing how the inactivating V329F mutation in hSMO mimics the benzyl moiety of SANT1.
Although details vary, all synthetic 7TM antagonists inhibit SMO by preventing activation-induced TM5/6 outward movement. Except for SANT1, the antagonists occupy overlapping positions in the upper portion of the 7TM site, close to the extracellular entrance, similar to cyclopamine. Antagonist binding to SMO involves rearrangement of the same hydrogen bond network, but unlike cyclopamine, antagonists reinforce only the inactive conformation. LY2940680 (Fig. 6C), TC114 (Fig. S6A) and Anta XV (Fig. S6B) stabilize hR400/xR373 through hydrogen bonds involving their phthalazine core; this, in turn, tethers hH470/xH443 in inactive conformation, preventing its outward movement upon SMO activation. In the case of vismodegib (Fig. 6D), although it doesn’t interact directly with hR400/xR373 and hH470/xH443, its carbonyl oxygen instead positions the side chain of hE518/xE491, which is relayed sequentially to hD473/xD446 and hR400/xR373, and then to hH470/xH443; this restricts the relative movement of TM5, TM6 and TM7 required for activation. The SAG1.5 agonist illustrates how disruption of the hydrogen bond network can lead to SMO activation (Fig. 6E). In the SAG1.5-bound structure, hE518/xE491 adopts an alternative conformation, breaking its interaction with hD473/xD446, while the guanidine group of hR400/xR373 rotates away due to steric hindrance, uncoupling from hH470/xH443. We speculate that, in the active state, reorientation of hR400/xR373 may instead force TM6 to move outward, explaining SMO activation.
Finally, SANT1 inhibits SMO by a dual mechanism. First, like other antagonists, SANT1 utilizes the nitrogen of its piperazine ring to form a hydrogen bond with hH470/xH443, preventing outward TM6 movement (Fig. 6F). Second, uniquely among antagonists, SANT1 extends much deeper into the 7TM domain, with the benzyl moiety reaching a hydrophobic cavity formed by hSMO residues F274 (TM2), L325, M326 and V329 (TM3), I408 and V411 (TM5), and V463 (TM6) (Fig. 6G). This “glues” TM5/6 to TM2/3 through hydrophobic interactions, preventing TM5/6 opening and stabilizing the inactive SMO conformation. A similar mechanism explains the inhibitory hSMO V329F mutation (Byrne et al., 2016), in which the phenylalanine side chain mimics the benzyl moiety of SANT1, filling the hydrophobic cavity (Fig. S6C).
A longitudinal tunnel in active SMO suggests a role in regulation by cholesterol
A notable feature of SMO is the ligand-inducible plasticity of the 7TM orthosteric site, which allows binding to structurally diverse modulators (Fig. S7A). In inactive SMO, the non-overlapping binding sites for cyclopamine and SANT1 define the full extent of the 7TM cavity (Fig. S7B). Compared to cyclopamine (Figs.7A and S7C), SANT1 inserts deep in the cavity, reshaping and shifting it towards TM6 (Figs.7B and S7D), as result of side chain movements of hL325/xM298 (TM3) and hM525/xM498 (TM7), two residues near the center of the 7TM (Fig. S7D). Strikingly, in our active xSMO structures, the outward rotation of TM6 further extends the SANT1 cavity, forming a passage that runs between TM5 and TM6, and then opens laterally towards the inner leaflet of the membrane (Figs.7C, 7D and S7E). Formation of this passage also requires movements of both the main chains and side chains of T466/xT439, V463/xV436, F460/xF433 and F457/xF430 in TM6, as well as the rotameric switch of hF332/xF305 in TM3 - residues that occlude the passage in inactive SMO (Figs.7E–G).
Figure 7.

A longitudinal tunnel in active SMO connects the membrane to the 7TM orthosteric site
(A) Surface of cyclopamine-bound inactive hSMO (yellow, PDB ID: 4O9R). The 7TM cavity is shown in red. See also Figure S7C for the corresponding ribbon model.
(B) As in (A), but showing SANT1-bound inactive hSMO (light blue, PDB ID: 4N4W). Note the remodeling of the 7TM site by SANT1. See also Figure S7D for the corresponding ribbon model.
(C) As in (A), but showing active cyclopamine-bound xSMO (blue). Note the appearance of a tunnel connecting the membrane to the bottom of the 7TM site. See also Figure S7E for the corresponding ribbon model, and Movie S2 for the 360-degree view of the tunnel.
(D) Superimposition of the inactive 7TM cavities for cyclopamine (yellow) and SANT1 (red), and the tunnel (blue).
(E) Close up view of the tunnel in active xSMO, superimposed on inactive cyclopamine-bound hSMO (yellow). Residues that obstruct the tunnel in inactive SMO are shown in sticks. Residue numbers are from hSMO.
(F) As in (E), but showing active cyclopamine-bound xSMO (blue). Movement of the depicted residues opens the tunnel. Residue numbers are from xSMO.
(G) The tunnel superimposed on both inactive (yellow) and active (blue) SMO. Note individual movements of residues involved in tunnel opening upon SMO activation.
The result of these rearrangements is that active SMO harbors a continuous tunnel, which starts in the membrane and extends through the 7TM bundle, reaching the extracellular opening of the orthosteric site (Movie S2). To our knowledge, this feature is unprecedented among GPCRs, which usually do not have such elongated ligand-binding cavities as SMO. We speculate that the tunnel is part of the mechanism by which SMO obtains cholesterol during Hh signaling. In this scenario, tunnel formation allows cholesterol to be transported from the cell membrane to CRD, as needed for activation. We note that the widest region of the tunnel is compatible with the size of cholesterol. The narrowest region of the tunnel is surrounded by H443, M298 and M498 of xSMO (Fig. S7E), residues that undergo significant conformational change in different liganded SMO structures (Byrne et al., 2016; Wang et al., 2014; Wang et al., 2013; Weierstall et al., 2014; Zhang et al., 2017a), suggesting they might have the flexibility to allow tunnel widening needed to accommodate cholesterol passage. Perhaps, these residues may function together as a “switch valve” that alternates between restricting and permitting upward cholesterol movement.
Discussion
Activation of SMO is the essential step by which Hh signals are transduced across the plasma membrane. Identification of cholesterol as the endogenous SMO activator (Huang et al., 2016) raised the critical question of how cholesterol binding to the CRD activates the 7TM domain. Elucidating this mechanism, however, has been hampered by the lack of a structure for sterol-activated SMO. All existing SMO structures show the 7TM in inactive conformation, including agonist-bound SMOΔCRD. More recently, the structure of full-length SMO bound to cholesterol was determined, but in this case the 7TM is locked in inactive state by an inhibitory mutation (Byrne et al., 2016). Since stabilizing the 7TM domain in inactive conformation with vismodegib leads to depletion of cholesterol from the CRD (Byrne et al., 2016), the functional significance of this unusual chimeric conformation of SMO (CRD bound to cholesterol, 7TM inactive) is unclear. Finally, full-length SMO adopts the same conformation with or without bound cholesterol (Byrne et al., 2016; Zhang et al., 2017a), indicating that existing structures do not capture SMO regulation by sterols.
Here, we report crystal structures of full-length SMO in complex with either cholesterol or cyclopamine, revealing, for the first time, the active conformation of a Class F GPCR. Upon sterol binding, the CRD undergoes dramatic reorientation and moves closer to the membrane (Movie S1). This CRD rearrangement is perhaps transmitted via the long extracellular extension of TM6, to the 7TM domain, which undergoes outward movement of TM5 and TM6 (TM5/6 open state), reminiscent of the active conformation of “classical” Class A and B GPCRs (Manglik and Kruse, 2017). Thus the movements that underlie 7TM conformational change upon activation are broadly conserved among GPCRs, in spite of low primary sequence conservation and even in spite of Class F GPCRs missing key residues involved in binding to the downstream heterotrimeric G proteins.
The CRD represses the 7TM domain in the absence of Hh signaling, but its role in SMO activation has been less clear. In one model, sterol binding to CRD simply relieves 7TM repression, which is sufficient for full Hh pathway activation. Alternatively, sterol-bound CRD activates the 7TM domain allosterically. Our data support the allosteric activation model. First, binding of 20(S)-OHC to CRD causes SMO activation above SMOΔCRD levels. Second, cyclopamine-bound full-length SMO adopts an active conformation, in contrast to cyclopamine-bound SMOΔCRD (Weierstall et al., 2014), suggesting that the liganded CRD activates the 7TM. Thus CRD participates in both SMO repression and activation, with sterol binding providing the switch between the two states. We speculate that the CRD rotation seen in our structures is the basis for allosteric 7TM activation. This CRD movement is reminiscent of how the large extracellular domain of Class B GPCRs moves upon activation (de Graaf et al., 2017). Remarkably, only three residues, comprising the SSG switch motif conserved in SMO orthologs, are required for CRD rotation. Finally, we note that the observed CRD rotation disproves the previously proposed “common architecture” for domain arrangement in full-length SMO (Byrne et al., 2016; Zhang et al., 2017a).
Comparing the active and inactive 7TM conformations provides insight into how SMO activity is controlled. We identify a π-cation interaction involving a W residue in TM7 and an R residue in TM6, which plays a critical role in stabilizing inactive SMO and is broken upon activation. Interestingly, the W residue is mutated to L in oncogenic SMO-M2; this mutation disrupts the π-cation interaction, providing an explanation for the constitutive activity of SMO-M2, which had been a long-standing mystery in Hh signaling. We use structure-guided mutagenesis to demonstrate that SMO-M2 activation can be partially reversed by a mutation that enhances stability of the inactive conformation. Importantly, the π-cation pair is found in all Class F GPCRs, suggesting a conserved mechanism for inactive state stabilization.
The 7TM orthosteric site binds numerous synthetic antagonists, but how they inhibit SMO has remained unexplained. The active-inactive comparison suggests a mechanism for SMO antagonism, for which we propose the term “TM coupling”. Similar to other GPCRs (Manglik and Kruse, 2017), both conformations of the SMO 7TM domain are stabilized by a hydrogen bond network that connects the TM helices. When SMO transitions from inactive to active conformation, this network is maintained but remodeled, to accommodate TM movements. SMO antagonists block activation by strengthening inactive state TM coupling. Most antagonists accomplish this by reinforcing the hydrogen bond network characteristic of the inactive conformation. Another antagonist strategy is illustrated by SANT1, which enhances inactive state TM coupling by filling a hydrophobic cavity in the 7TM bundle with its benzyl moiety, a mechanism mimicked by the phenylalanine chain provided by the V329F inhibitory mutation in hSMO (Byrne et al., 2016). Conversely, SMO agonists cause SMO activation by breaking the hydrogen bond network involved in inactive state TM coupling, as illustrated by SAG1.5 (Wang et al., 2014).
Our results provide insight into the unique mechanism of cyclopamine, which inhibits SMO while also displaying partial agonist properties. We find that, strikingly, cyclopamine binds both inactive and active conformations of SMO. When bound to SMOΔCRD (Weierstall et al., 2014), cyclopamine stabilizes the TM5/6 closed state of the 7TM domain, similar to all other 7TM antagonists. In contrast, when bound to full-length SMO, cyclopamine stabilizes the TM5/6 open state, a hallmark of activation. This difference between full-length SMO and SMOΔCRD can be explained by cyclopamine-bound CRD activating the 7TM allosterically, similar to cholesterol; indeed, we previously found that cyclopamine binding to CRD activates a SMO mutant that cannot bind cyclopamine at the 7TM site (Huang et al., 2016). The paradoxical behavior of cyclopamine can thus be explained by its mimicry of cholesterol at the CRD site and its compatibility with both TM5/6 open and closed conformations of the 7TM site.
Both SMO-M2 and 20(S)-OHC-activated SMO have reduced affinity for cyclopamine. This suggests that full SMO activation might involve a conformational change in addition to the TM5/6 open state stabilized by cyclopamine. We speculate that this additional change is the movement of TM7, similar to the active conformation of Class A and B GPCRs; this idea is consistent with the fact that the M2 mutation maps to TM7. Perhaps, the TM5/6 open state is sufficient for SMO accumulation in cilia, but triggering downstream signaling also requires TM7 movement. It is unclear why we have not observed such a movement in our cholesterol-bound SMO structure, which is almost identical to the cyclopamine-bound one. One possibility is that, as for most GPCRs, the fully active state of SMO is very dynamic, and capturing it might require stabilization by a downstream binding partner.
A striking observation is that SMO activation leads to the opening of a tunnel that runs from the inner leaflet of the membrane, through the 7TM orthosteric site, to an extracellular opening near the CRD. The role of this structural feature is currently mysterious. We propose that the tunnel provides a path for the cholesterol involved in SMO activation, to ascend from the membrane to the CRD. The portion of the tunnel that appears upon SMO activation (from the inner leaflet to the bottom of the orthosteric site) is lined with mostly hydrophobic residues, consistent with passage of a molecule like cholesterol. Several conserved glycines from TM5, TM6 and TM7 are either directly involved in the tunnel, or positioned in its close vicinity; perhaps these residues are important for conformational flexibility required for transport. We speculate that unliganded SMO is dynamic, similar to other GPCRs, and that perhaps the tunnel opens transiently by the movement of TM6, permitting access of cholesterol from the membrane; this process could be driven by cholesterol activity in the inner leaflet, itself under the control of PTCH. Once cholesterol enters the tunnel, it may trigger a series of conformational changes that result in its upward movement, eventually reaching the CRD and causing the 7TM to adopt an active conformation. It is unclear how cholesterol might “jump” from the extracellular opening of the orthosteric site to the CRD site. Perhaps, in the inactive state of SMO, the CRD site faces the extracellular vestibule of the 7TM site, thus enabling cholesterol transfer. Detailed structural and biochemical studies of SMO activation will be needed to test this model and the role of the tunnel in cholesterol transport.
STAR Methods
Detailed experimental methods are provided in the online version of this paper and include the following:
Key Resources Table
| REAGENT or RESOURCE | SOURCE | IDENTIFIER |
|---|---|---|
| Antibodies | ||
| Rabbit anti-mCHERRY | Nedelcu et al., 2013 | N/A |
| Rabbit anti-mouse SMO | Tukachinsky et al., 2010 | N/A |
| Mouse anti-acetylated tubulin | Sigma | Cat# T7451 |
| Mouse anti-HA, Alexa647-labeled | BioLegend | Cat# 682404 |
| Chemicals, Peptides, and Recombinant Proteins | ||
| SAG (≥98%) | Axxora | Cat# BV-1939 |
| SANT1 (≥95%) | Calbiochem | Cat# 559303 |
| Cyclopamine (>99%) | LC Laboratories | Cat# C-8700 |
| Vismodegib (>99%) | LC Laboratories | Cat# V-4050 |
| BODIPY-cyclopamine | TRC | Cat# B674800 |
| BODIPY-SANT1 | Nedelcu et al., 2013 | N/A |
| BODIPY-vismodegib | This paper | N/A |
| BODIPY-FL N-hydroxysuccinimide ester | ThermoFisher | Cat# D2184 |
| 20(S)-hydroxycholesterol [20(S)-OHC] (≥98%) | Steraloids | Cat# C6480-000 |
| Cholesteryl hemisuccinate | Sigma | Cat# C6512 |
| Cholesterol (≥99%) | Sigma | Cat# C8667 |
| N-dodecyl-beta-D-maltopyranoside (DDM) | Anatrace | Cat# D310 |
| Lauryl Maltose Neopentyl Glycol (LMNG) | Anatrace | Cat# NG310 |
| Monoolein | Hampton Research | Cat# HR2-435 |
| EDTA-free protease inhibitor cocktail tablets | Roche | Cat# 04 693 159 001 |
| Recombinant PreScission protease, GST-tagged | This paper | N/A |
| Critical Commercial Assays | ||
| Dual-Glo Luciferase assay system | Promega | Cat# E2920 |
| Bac-to-bac system | ThermoFisher | Cat# A11098 |
| Ni-NTA agarose | Qiagen | Cat# 30230 |
| Superdex 200 10/300 GL column | GE Healthcare | Cat# 17517501 |
| Mesh grid loops | MiTeGen | Cat# M3-L18SP-50 |
| Deposited Data | ||
| Atomic coordinates, xSMO-cyclopamine structure | Protein Data Bank | PDB ID 6D32 |
| Atomic coordinates, xSMO-cholesterol structure | Protein Data Bank | PDB ID 6D35 |
| Experimental Models: Cell Lines | ||
| NIH-3T3 cells | ATCC | Cat# CRL1658 |
| Shh Light II cells | ATCC | Cat# CRL2795 |
| HEK293T cells | ATCC | Cat# CRL3216 |
| Sf9 insect cells | ATCC | Cat# CRL1711 |
| Immortalized Smo−/− mouse embryonic fibroblasts | Nedelcu et al., 2013 | N/A |
| Recombinant DNA | ||
| pCS2-mSmo-mCherry | Nedelcu et al., 2013 | N/A |
| pCS2-mSmoΔCRD-mCherry | Nedelcu et al., 2013 | N/A |
| pCS2-mSmo-mCherry, various point mutants | This paper | N/A |
| pCS2-mSmo-HA, wild type and mutants | This paper | N/A |
| pCS2-hShhN (amino acids 1-197) | Nedelcu et al., 2013 | N/A |
| pFastBac-FlagHaloTag-xSMO-BRIL-His8 | This paper | N/A |
| Software and Algorithms | ||
| Metamorph image acquisition software | Applied Precision | www.moleculardevices.com |
| KaleidaGraph | Synergy Software | http://www.synergy.com |
| HKL-3000 | Minor et al., 2006 | http://www.hkl-xray.com |
| PHASER | McCoy et al., 2007 | http://www.phaser.cimr.cam.ac.uk |
| COOT | Emsley and Cowtan, 2004 | www2.mrc-lmb.cam.ac.uk |
| PHENIX | Adams et al., 2010 | www.phenix-online.org |
| Prism 5 | GraphPad | www.graphpad.com |
Contact for Reagent and Resource Sharing
Further information and reagent requests should be addressed to, and will be fulfilled by the corresponding author Adrian Salic (asalic@hms.harvard.edu).
Experimental Model and Subject Details
Cell lines and cell culture
Human HEK293T cells (female), mouse NIH-3T3 cells, Shh Light II cells, and Sf9 insect cells were obtained from ATCC. Smo−/− mouse embryonic fibroblasts (MEFs) were described before (Nedelcu et al., 2013). 293T cells and MEFs were grown in Dulbecco’s Modified Eagle’s Medium (DMEM) with 10% fetal bovine serum, penicillin and streptomycin. NIH-3T3 cells and Shh Light II cells (Taipale et al., 2000) were grown in DMEM with 10% bovine calf serum, penicillin and streptomycin. Sf9 cells were grown in serum-free ESF 921 medium (Expression Systems). Cell lines were purchased directly from the supplier and were not otherwise authenticated. Unless indicated, the sex of the cell lines is not available.
Method Details
Hh pathway reporter assays
Luciferase reporter assays were performed in Hh-responsive Shh Light II cells (Taipale et al., 2000), as described (Tukachinsky et al., 2012). Confluent cultures were starved overnight in DMEM, after which they were incubated for 36 hours in DMEM supplemented with the desired compounds, followed by luciferase activity measurements. To produce SHH ligand, an expression construct encoding amino acids 1-197 of human Shh was transiently transfected into 293T cells (Nedelcu et al., 2013), and serum-free conditioned medium was harvested 24 hours later. The conditioned medium was added to cells diluted in fresh DMEM. For luciferase experiments, four biological replicates were performed, and error bars indicate standard deviation.
DNA constructs
Expression constructs for mouse Smoothened (mSMO), tagged at the C-terminus with either mCHERRY or an influenza hemagglutinin (HA) tag, were assembled by PCR in a mammalian expression vector for lentiviral production (Tukachinsky et al., 2012). Xenopus SMO (xSMO) used for crystallization was expressed in Sf9 cells by baculovirus infection. Baculoviruses were generated using the Bac-to-bac system (ThermoFisher), according to the manufacturer’s instructions. The construct for expressing xSMO contained the signal sequence of influenza hemagglutinin, followed by a FLAG tag, a HaloTag (Promega), a PreScission protease cleavage site, the xSmo sequence [amino acids 35-528, with glycosylation sites removed, and the intracellular loop 3 between residues 402-415 replaced by thermostabilized apocytochrome b562 (BRIL)], and a His tag consisting of 8 histidine residues.
Cell-based fluorescent ligand binding assays
Binding of BODIPY-labeled ligands to mSMO was performed as described (Nedelcu et al., 2013). Briefly, mCHERRY-tagged mSMO constructs were expressed in 293T cells by transient transfection, using standard protocols. Twenty-four hours later, the cells were incubated for 1 hour in OptiMEM supplemented with BODIPY-labeled ligand (100 nM for BODIPY-cyclopamine, 200 nM for BODIPY-SANT1, or 1 μM for BODIPY-vismodegib), in the presence or absence of competitors. Cells were fixed in PBS with 3.6% formaldehyde, followed by three washes in TBST (10 mM Tris pH 7.5, 150 mM NaCl, 0.2% Triton X-100), to remove excess ligand. The cells were then imaged by fluorescence microscopy on a Nikon TE2000E microscope, using a 10x PlanApo 0.45NA air objective (Nikon). Fluorescence intensity of cell-bound BODIPY ligand was measured using automated image analysis software implemented in MATLAB (Nedelcu et al., 2013). Briefly, the software first identifies cells by local adaptive thresholding of mSMO-mCHERRY images, after which BODIPY intensity in each cell is corrected by local background subtraction. BODIPY ligand binding is then calculated as total corrected intensity, normalized to mSMO-mCHERRY fluorescence intensity in each cell. BODIPY fluorescence intensities are shown as box plots, with the lower and upper bounds corresponding to the 25th and the 75th percentile of the distribution, and the horizontal line indicating median intensity. For the experiments presented in this paper, between 600 and 1000 cells were analyzed per condition. For statistical testing, the median BODIPY:mCHERRY ratio was calculated for five random, non-overlapping subsamples of the cell population measured for each condition. A two-tailed Student’s t-test was then performed on the sets of five medians. Each cell-based fluorescent ligand binding experiment reported in this paper was repeated at least three times.
Flow cytometry-based ligand binding assays
HA-tagged mSMO constructs were expressed in 293T cells by transient transfection. Twenty-four hours later, the cells were incubated at 4°C for 2 hours with BODIPY-labeled ligand in OptiMEM, in the presence or absence of 20(S)-OHC (10 μM). The cells were harvested and were fixed in suspension in PBS with 3.6% formaldehyde. The cells were then permeabilized in TBST, and mSMO was stained by incubation with Alexa647-labeled mouse anti-HA antibodies (BioLegend). After washing with TBST, the cell suspension was filtered and analyzed by flow cytometry (BD Biosciences). Cells not expressing mSMO were used for background subtraction for both BODIPY and Alexa647 channels. Data is presented as the ratio of background-subtracted BODIPY intensity to Alexa647 intensity for mSMO-expressing cells. Data points were fitted in KaleidaGraph (Synergy Software), to calculate Kd values. Each flow cytometry-based ligand binding experiment was repeated at least twice.
Expression and purification of xSMO-BRIL fusion
Baculovirus encoding xSMO-BRIL was used to infect Sf9 cells at a density of 3×10⁶/mL. The cells were harvested 48-60 hours after infection, and were stored frozen at −80°C until use. Cell pellets were thawed and re-suspended in hypotonic buffer (20 mM HEPES pH 7.5) supplemented with EDTA-free protease inhibitor cocktail (Roche). Cell membranes were subsequently solubilized in high salt buffer [20 mM Tris pH 8, 500 mM NaCl, 10% glycerol, 20 mM imidazole, 1% (w/v) n-dodecyl-β-D-maltopyranoside (DDM, Anatrace) and 0.2% (w/v) cholesteryl hemisuccinate (CHS, Sigma)]. Solubilized xSMO-BRIL in the clarified supernatant was captured on Ni-NTA agarose (Qiagen), washed in high salt buffer with gradually reduced detergent concentrations, and then eluted in Ni-NTA elution buffer [20 mM Tris pH 8, 500 mM NaCl, 10% glycerol, 500 mM imidazole, 0.03% (w/v) DDM and 0.006% (w/v) CHS]. The Ni-NTA eluate was diluted 1:3 with dilution buffer [20 mM HEPES pH 7.5, 2 mM CaCl2, 0.1% (w/v) Lauryl Maltose Neopentyl Glycol (LMNG, Anatrace) and 0.01% (w/v) CHS], and xSMO-BRIL was further purified on an anti-FLAG M1 affinity column. The protein was eluted in FLAG elution buffer [20 mM HEPES pH 7.5, 150 mM NaCl, 5 mM EDTA, 100 μg/mL FLAG peptide, 0.01% (w/v) LMNG and 0.001% (w/v) CHS], and was digested overnight with PreScission protease, to remove the N-terminal FLAG and HaloTag tags. The protein was then concentrated and purified by size exclusion chromatography on a Superdex 200 10/300 GL column (GE Healthcare), in 20 mM HEPES pH 7.5, 150 mM NaCl, 0.01% (w/v) LMNG and 0.001% (w/v) CHS. For the xSMO-BRIL-cyclopamine complex, cyclopamine (20 μM) was present in all buffers during purification. For the xSMO-BRIL-cholesterol complex, no additional cholesterol was added during purification.
Crystallization, data collection and structure determination
Purified xSMO-BRIL (50 mg/mL) was reconstituted into lipidic cubic phase (LCP) by mixing with monoolein-cholesterol [10:1 (w:w)] at a protein to lipid ratio of 1.0:1.5 (w:w), using the coupled syringe method. The resulting sample was spotted as 30 nL drops onto a glass plate, and was overlaid with 600 nL precipitant solution, using a Gryphon LCP robot (Art Robbins Instruments). Both xSMO-BRIL-cyclopamine and xSMO-BRIL-cholesterol crystals were obtained from 35-45% PEG 300, 300-500 mM LiSO4, 0.1 M MES pH 6-6.5. Crystals were harvested using mesh grid loops (MiTeGen) and were stored in liquid nitrogen until data collection.
Initial crystals were tested at Advanced Photon Source (APS) SBC-CAT 19-ID beamline. The datasets used for structure determination were later collected at APS GM/CA 23ID-B beamline using a rastering strategy to optimally position the crystals. The data collection was performed with a 10 μm beam at the wavelength of 1.033 Å and in 0.2 degree oscillations. Diffraction data from multiple crystals were processed and merged using HKL-30002 to achieve the resulting complete datasets.
The xSMO-BRIL-cyclopamine structure was solved by molecular replacement using PHASER (McCoy et al., 2007). The structures of xSMO-CRD-cyclopamine (PDB ID: 5KZY), hSMO CRD-cyclopamine (PDB ID: 4O9R), and BRIL were used as search models for each individual domain. The initial model was manually rebuilt in COOT (Emsley and Cowtan, 2004) and was refined using PHENIX. The resulting model was then used to solve the xSMO-BRIL-cholesterol structure, following similar procedures. For structural analysis, cavities and tunnels were identified using the 3V program. All structure figures were prepared in PyMol. Data collection and refinement statistics are summarized in Table S1.
Chemical synthesis
General methods for synthesis
Solvents and reagents were obtained from commercial sources and were used without further purification. NMR spectra were recorded on a Varian Oxford AS600 600 MHz instrument. NMR chemical shifts are expressed in ppm relative to internal solvent peaks, and coupling constants are measured in Hz (br = broad). Mass spectra were recorded on a Waters Micromass ZQ instrument using an ESI source coupled to a Waters 2525 HPLC system operating in reverse mode with Waters SunfireTM C185 uM 4.6×50 mm column. Flash chromatography was performed using a Biotage Isolera One flash purification system.
Synthesis of BODIPY-vismodegib

1-Chloro-2-iodo-4-nitrobenzene (1)
2-Chloro-5-nitro-aniline (3.45 g, 20.0 mmol) was suspended in concentrated HCl (12 mL) and cooled to 0°C. Solution of sodium nitrite (1.52 g, 22.0 mmol) in water (15 mL) was added drop-wise while maintaining the temperature at 0~5°C. After stirring 60 min at 0~5°C, a solution of potassium iodide (6.64 g, 40.0 mmol) in water (25 mL) was added drop-wise over a period of 30 min. After standing overnight at room temperature, the reaction mixture was extracted with dichloromethane (3×60 mL). The combined organic layers were washed with saturated aqueous Na2S2O3 and then with brine, dried over Na2SO4, filtered, and concentrated. The residue was purified by flash column chromatography (SiO2, step-wise gradient from 100:1 to 4:1 hexanes/ethyl acetate) to afford 1 (pale yellow needle crystals, 5.1 g, 90 %).

2-(2-Chloro-5-nitrophenyl)pyridine (2)
2-Iodopyridine (164 mg, 0.8 mmol) was dissolved in dry THF (3 mL) and cooled to −70 °C. Then n-BuLi (0.35 mL of a 2.5 M solution in hexanes, 0.88 mmol) was added and the reaction mixture was stirred at −70 °C for 20 min. Subsequently, dry ZnCl2 (1.76 mL of a 0.5 M solution in THF, 0.88 mmol) was added, while keeping the temperature below −60 °C. The reaction mixture was then warmed to room temperature, Pd(PPh3)4 (4.6 mg, 0.004 mmol) and 1 (170 mg, 0.6 mmol) in dry THF (2 mL) were added, and the reaction was refluxed until complete conversion. The reaction mixture was poured into water (3 mL) and was extracted with ethyl acetate (3×3 mL). The crude material was purified by flash column chromatography (SiO2, step-wise gradient from 100:1 to 1:2 hexanes/ethyl acetate), yielding the biaryl compound 2 (yellow oil, 56.5 mg, 40 %).

4-Chloro-3-(pyridin-2-yl)aniline (3)
Tin (II) chloride dihydrate (270.8 mg, 1.2 mmol) was added to a stirred solution of 2 (56.5 mg, 0.24 mmol) in ethyl acetate (2 mL). The reaction mixture was stirred at 70 °C for 4 hours, then poured into saturated NaHCO3, filtered through celite, and washed with ethyl acetate. The ethyl acetate layers were washed with water and brine, dried over Na2SO4, and concentrated to yield an oily residue as the crude amine 3 (30.2 mg, 61%), which was used without further purification.

Methyl 4-amino-2-chlorobenzoate (4)
Acetyl chloride (2.6 mL) was added drop-wise to a stirred solution of 4-amino-2chlorobenzoic acid (2.06 g, 12.0 mmol) in methanol (70 mL). The mixture was heated to reflux for 20 h, cooled, and the solvent was evaporated under reduced pressure. The residue was taken up in ethyl acetate, washed with saturated NaHCO3 and brine, dried, and concentrated in vacuo to afford 4 (beige solid, 2.04 g, 92 %).
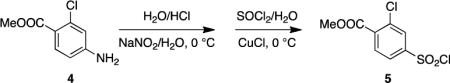
Methyl 2-chloro-4-(chlorosulfonyl)benzoate (5)
Step A: Hydrochloric acid (36% w/w, 2.0 mL) was added, with agitation, to 4 (371.2 mg, 2.0 mmol), while maintaining the temperature below 30°C. The mixture was cooled to −5 °C using an ice/acetone bath, and a solution of sodium nitrite (150 mg, 2.15 mmol) in water (0.6 mL) was added drop-wise over 10 min, maintaining the temperature below 0°C. The resultant slurry was cooled to −2°C and stirred for 10 min. Step B: Thionyl chloride (0.65 mL) was added drop-wise over 10 min to water (4 mL) cooled to 0°C, maintaining the temperature to 0-7°C. The solution was allowed to warm to room temperature overnight, after which copper (I) chloride (2.3 mg) was added, and the resultant yellow-green solution was cooled to −3°C on an acetone/ice bath. Step C: The slurry from step A was cooled to −5°C and was added over 10 min to the solution obtained from step B, maintaining the temperature of the reaction mixture between −3 and 0°C (the slurry from step A was maintained at −5°C throughout the addition). An orange oil began to form as the reaction proceeded. When addition was complete, the mixture was stirred at 0°C for 1.5 h. After removing most of the aqueous solution, the oil was dissolved in dichloromethane, washed with water and brine, dried over Na2SO4, concentrated under reduced pressure to yield 5 (yellow-orange oil, 407 mg, 76 %).

tert-Butyl (2-(2-(2-aminoethoxy)ethoxy)ethyl)carbamate (6)
Boc anhydride (4.4 g, 20 mmol) in 1,4-dioxane (30 mL) was added drop-wise to a solution of aminoethyloxyethyloxyethylamine (17.5 mL, 120 mmol) in 1,4-dioxane (90 mL) over 5 h. After additional stirring for 16 h at room temperature, the solvent was evaporated under reduced pressure. The resulting yellow oil was dissolved in water (50 mL) and extracted with dichloromethane (4×50 mL). The combined organic layers were washed with brine, dried over anhydrous Na2SO4 and concentrated to yield 6 (clear oil, 5.0 g, 100 %).

Methyl 2-chloro-4-(N-(2,2-dimethyl-4-oxo-3,8,11-trioxa-5-azatridecan-13-yl)sulfamoyl)benzoate (7)
To a solution of 6 (49.7 mg, 0.2 mmol) in dichloromethane (1 mL) was added 5 (53.8 mg, 0.2 mmol) in dichloromethane (0.5 mL) and diisopropylethylamine (0.105 mL, 0.6 mmol). The reaction mixture was stirred at room temperature for 12 h, the solvent was evaporated under reduced pressure, and the residue was purified by flash chromatography (SiO2, step-wise gradient from 7:3 to 1:4 hexanes/ethyl acetate), to afford 7 (yellow oil, 61 mg, 63 %).
1H NMR (600 MHz, CDCl3): δ 7.97 (s, 1H), 7.92 (d, J = 7.8 Hz, 1H), 7.80 (d, J = 7.8 Hz, 1H), 5.58 (br, 1H), 5.05 (br, 1H), 3.97 (s, 3H), 3.64-3.50 (m, 8H), 3.37-3.23 (m, 2H), 3.19 (dd, J = 10.2, 5.4 Hz, 2H), 1.44 (s, 9H); LC/MS: (ESI, m/z) 480.9 [M+H]+; calculated M+ for C19H29ClN2O8S: 480.1.

2-Chloro-4-(N-(2,2-dimethyl-4-oxo-3,8,11-trioxa-5-azatridecan-13-yl)sulfamoyl)benzoic acid (8)
The methyl ester 7 (56 mg, 0.12 mmol) was dissolved in 1:1 THF/water mixture (1 mL). LiOH (5.7 mg, 0.24 mmol) was added and the reaction mixture was stirred at room temperature for 16 h. The THF was evaporated under reduced pressure, the solution was acidified to pH=2 with 1N HCl and was then extracted with ethyl acetate (3×10 mL). The organic layers were washed with brine, dried over anhydrous Na2SO4, filtered and concentrated to yield 8 (clear oil, 54 mg, 99 %).
LC/MS: (ESI, m/z) 488.9 [M+H]+; calculated M+ for C18H27ClN2O8S: 488.1.

tert-Butyl (2-(2-(2-(3-chloro-4-((4-chloro-3-(pyridin-2-yl)phenyl)carbamoyl)phenylsulfonamido)ethoxy)ethoxy)ethyl)carbamate (9)
Compound 3 (128.0 mg, 0.63 mmol) was added to a mixture of 8 (321.3 mg, 0.69 mmol), HATU (261.6 mg, 0.69 mmol) and DIEA (0.22 mL, 1.25 mmol) in anhydrous DMF (4 mL). The reaction was stirred at room temperature for 18 h, then diluted with saturated NaHCO3, extracted into ethyl acetate (3×30 mL), and the combined organic layers were washed with brine, dried over Na2SO4, filtered and concentrated under reduced pressure. The residue was purified by flash chromatography (SiO2, step-wise gradient from 9:1 to 1:9 hexanes/ethyl acetate) to afford 9 (pale yellow solid, 45.6 mg, 11 %).
1H NMR (600 MHz, CDCl3): δ 9.63 (br, 1H), 8.49 (d, J = 4.2 Hz, 1H), 7.89 (dd, J = 8.4, 1.8 Hz, 1H), 7.81 (br, 1H), 7.78-7.73 (m, 2H), 7.69-7.63 (m, 2H), 7.55 (d, J = 8.4 Hz, 1H), 7.45 (d, J = 9.0 Hz, 1H), 7.26-7.22 (m, 1H), 5.94 (br, 1H), 5.10 (br, 1H), 3.67-3.47 (m, 8H), 3.34-3.20 (m, 2H), 3.15-3.06 (m, 2H), 1.42 (s, 9H); LC/MS: (ESI, m/z) 652.9 [M+H]+; calculated M+ for C29H34Cl2N4O7S: 652.2.

4-(N-(2-(2-(2-Aminoethoxy)ethoxy)ethyl)sulfamoyl)-2-chloro-N-(4-chloro-3-(pyridin-2-yl)phenyl)benzamide (10)
Compound 9 (45.6 mg, 0.07 mmol) was dissolved in methanol (0.4 mL). To this solution was added 4M HCl in 1,4-dioxane (1.0 mL, 4.0 mmol), and the reaction mixture was stirred at room temperature for 2 h. After solvent removal under reduced pressure, the residue was treated with triethylamine, dissolved in dichloromethane, concentrated, and subjected to flash chromatography (SiO2, step-wise gradient from 100:0:0.5 to 0:100:0.5 dichloromethane/methanol/triethylamine) to afford amine 10 (yellow solid, 36.3 mg, 94 %).
1H NMR (600 MHz, DMSO-d6): δ 10.95 (s, 1H), 9.23 (br, 1H), 8.72-8.68 (m, 1H), 8.04-7.90 (m, 3H), 7.88-7.83 (m, 2H), 7.76 (dd, J = 8.4, 2.4 Hz, 1H), 7.69 (d, J = 7.8 Hz, 1H), 7.59 (d, J = 8.4 Hz, 1H), 7.47-7.43 (m, 1H), 3.63-3.48(m, 6H), 3.44 (t, J = 5.4 Hz, 2H), 3.10 (br, 2H), 2.98 (t, J = 5.4 Hz, 2H), 2.95 (t, J = 5.4 Hz, 2H); LC/MS: (ESI, m/z) 553.0 [M+H]+; calculated M+ for C24H26Cl2N4O5S: 552.1.

3-(3-((2-(2-(2-(3-Chloro-4-((4-chloro-3-(pyridin-2-yl)phenyl)carbamoyl)phenylsulfonamido)ethoxy)ethoxy)ethyl)amino)-3-oxopropyl)-5,5-difluoro-7,9-dimethyl-5H-dipyrrolo[1,2-c:2′,1′-f][1,3,2]diazaborinin-4-ium-5-uide (BODIPY-vismodegib) (11)
Triethylamine (9.1 μL, 65.0 μmol) and BODIPY FL N-hydroxysuccinimide ester (5.0 mg, 13.0 μmol) were added to a solution of 10 (7.9 mg, μ14.3 mol) in dichloromethane (600 μL). The reaction mixture was stirred at room temperature for 20 h and then evaporated to dryness under a stream of nitrogen gas. Purification by flash chromatography (SiO2, step-wise gradient from 100:1 to 3:1 dichloromethane/methanol) yielded the desired fluorescent amide 11 (dark red solid, 8.4 mg, 78 %).
1H NMR (600 MHz, CDCl3): δ 9.24 (s, 1H), 8.65-8.63 (m, 1H), 7.90 (d, J = 1.8 Hz, 1H), 7.90 (d, J = 3.0 Hz, 1H), 7.82 (dd, J = 9.0, 2.4 Hz, 1H), 7.79-7.74 (m, 3H), 7.69-7.65 (m, 2H), 7.45 (d, J = 9.0 Hz, 1H), 7.30-7.26 (m, 1H), 7.07 (s, 1H), 6.86 (d, J = 4.2 Hz, 1H), 6.30 (t, J = 5.4 Hz, 1H), 6.24 (d, J = 4.2 Hz, 1H), 6.10 (s, 1H), 3.57-3.46 (m, 10H), 3.32 (dd, J = 10.8, 5.4 Hz, 2H), 3.20-3.12 (m, 4H), 2.53 (s, 3H), 2.24 (s, 3H); LC/MS: (ESI, m/z) 827.0 [M+H]+; calculated M+ for C38H39BCl2F2N6O6S: 826.1.
Quantification and Data Analysis
Statistical parameters are indicated in Figure Legends and in Method Details. Luciferase assays were performed in quadruplicate starting from four biological replicates, and error bars represent the standard deviation. For measuring BODIPY ligand binding to mSMO-mCHERRY constructs by fluorescence microscopy, between 600-1000 cells were analyzed per condition. Normalized BODIPY ligand intensities are displayed as box plots; the lower and upper bounds of the box represent the 25th and 75th percentile of the distribution, and the horizontal line corresponds to median bound BODIPY ligand. Statistically significant differences were measured as follows. For each condition, the median BODIPY:mCHERRY ratio was calculated for five random, non-overlapping subsamples, each comprising 20% of the measured cell population. A two-tailed Student’s t-test was then performed on the sets of five medians. Each ligand binding experiment reporter here was repeated at least three times.
Data and Software Availability
Data Resources
Atomic coordinates for xSMO-cyclopamine and xSMO-cholesterol structures have been deposited in the Protein Data Bank, with the accession codes 6D32 and 6D35, respectively.
Supplementary Material
Figure S1. Structural alignment of SMO homologs, Related to Figures 1–7 The figure shows alignment of xSMO, hSMO, mSMO, zebrafish SMO (zSMO), and Drosophila SMO (dSMO), based on the cyclopamine-bound xSMO structure. The CRD is green, LD is cyan, and 7TM domain is blue. All TMs, intracellular loops (ICLs), and extracellular loops (ECLs) are labeled. The connector region is shown in brackets between CRD and LD. The conserved switch motif “SSG” is highlighted with an orange box. The portion of ICL3 replaced with BRIL is underlined by an orange dashed line. The R and W residues that form the -cation lock are shown in red boxes. Pink solid circles indicate residues that line the tunnel in our active xSMO structures. Triangles indicate residues that line the 7TM orthosteric site, defined by cyclopamine binding. Diamond shapes indicate residues that contact SANT1. The yellow squares indicate the 5 residues that form the hydrogen bond network involved in stabilizing both active and inactive SMO conformations.
Figure S2. Structures of full-length Xenopus SMO (xSMO) in complex with cyclopamine or cholesterol, Related to Figure 1 (A) Ribbon model showing crystal packing for xSMO bound to cyclopamine. The CRD is in green, LD in cyan, 7TM in blue, and BRIL in orange. The view is along the z-axis of the crystal. The crystal displays type-I packing, which is typical for LCP crystals. (B) Overall electron density map for xSMO bound to cyclopamine (2Fo-Fc, contoured at 1.1σ), covering the entire SMO-BRIL polypeptide. Domains are colored as in (A). (C) As in (B), but showing a close up view of TM6, a region that shows significant change compared to inactive SMO. (D) As in (C), but showing the third extracellular loop (ECL3). (E) Electron density map for cyclopamine bound to the CRD (2Fo-Fc, contoured at 1.1σ and colored in blue). Cyclopamine is shown in yellow, while residues in the CRD are green. (F) Polder OMIT map (Liebschner et al., 2017) for cyclopamine bound to the CRD (contoured at 3.0σ and colored in green). (G) As in (E), but showing cyclopamine bound to the 7TM site. Residues in the 7TM domain are blue. (H) As in (F), but showing cyclopamine bound to the 7TM site. (I) As in (E), but showing cholesterol (yellow) bound to the CRD. (J) As in (F), but showing cholesterol bound to the CRD.
Figure S3. Sterol-induced CRD reorientation in active SMO, Related to Figure 2 (A) Overlay of structures of full-length hSMO bound to vismodegib (red, PDB ID: 5L7I), TC112 (light yellow, PDB ID: 5V56) and cholesterol (light blue, PDB ID: 5L7D), illustrating the “common architecture” proposed for SMO. The three structures capture the 7TM domain in the same, inactive conformation. The CRD shows slight horizontal shifts between structures. The extracellular extension of TM6 is slightly shifted in the cholesterol-bound SMO structure. (B) Ribbon diagram showing the structure of cyclopamine-bound xSMO (blue), superimposed on the structure of vismodegib-bound hSMO (red, PDB ID: 5L7I). The two structures are oriented so that their CRDs lie on top of each other, highlighting that the last portion of the connector is responsible for the dramatic rotation of the CRD relative to the 7TM domain in active SMO. (C) Structure of inactive vismodegib-bound hSMO (PDB ID: 5L7I). The 7TM domain is in red, CRD in pale green, LD in pale cyan. Shown in green sphere are residues 114 and 156, where introduction of a glycosylation site leads to constitutive activity (Byrne et al., 2016). These two residues are buried in the tri-domain junction of inactive hSMO. Shown in purple sphere is V82 (corresponding to V55 in xSMO), which is solvent-exposed in inactive hSMO, but not in active xSMO. (D) Structure of the xWNT8-mFZ8CRD complex (PDB ID: 4F0A) superimposed on the cyclopamine-bound xSMO structure.
Figure S4. 7TM conformational change and inactivating “locks” in Class A and B GPCRs, Related to Figures 3 and 4 (A) Ribbon model showing the active M2 muscarinic acetylcholine receptor (marine, PDB ID: 4MQS), superimposed on the inactive M2 muscarinic acetylcholine receptor (raspberry, PDB ID: 3UON). The active receptor is stabilized by binding to an agonist and a conformation-specific nanobody (not shown). (B) As in (A), but showing active β2-adrenergic receptor (β2AR, deep teal, PDB ID: 3SN6), superimposed on inactive β2AR (ruby, PDB ID: 2RH1). Active β2AR is stabilized by binding to the heterotrimeric Gs protein (not shown). Note the dramatic movement of TM6. (C) As in (A), but showing the cryo-EM structure of the active glucagon-like peptide-1 receptor (GLP-1R, cyan, PDB ID: 5VAI), superimposed on the crystal structure of the inactive glucagon receptor (GCGR, purple, PDB ID: 5EE7). (D) As in (C), but showing a view rotated by 90 degrees, from the cytoplasmic side. (E) Ribbon model showing the 7TM domain of inactive rhodopsin (pink, PDB ID: 1U19), seen from the cytoplasmic side. Residues R135 (TM3) and E247 (TM6) form the ionic lock characteristic of Class A GPCRs. (F) Same view as in (E), but of active rhodopsin (green, PDB ID: 3PQR), showing the ionic lock broken. (G) As in (E), but showing the structure of inactive GCGR (purple, PDB ID: PDB ID: 5EE7). The HETX motif, which forms a hydrogen bond network that locks the receptor in inactive state, is shown in sticks. The residues are indicated in Wootten numbering. (H) As in (G), but showing the structure of active GLP-1R (cyan, PDB ID: 5VAI), with the lock broken.
Figure S5. Control of 7TM conformation by the π-cation lock and by sterol-bound CRD, Related to Figures 4 and 5 (A) Upper panel: schematic of the BODIPY-vismodegib probe. Bottom panel: Smo−/− MEFs stably expressing mCHERRY-tagged mSMO were incubated with BODIPY-vismodegib (50 nM), in the absence or presence of vismodegib competitor (1 μM). Primary cilia were imaged by live fluorescence microscopy. BODIPY-vismodegib binds specifically to mSMO in primary cilia. (B) Shh LightII cells were incubated with Shh, in the presence of the indicated concentrations of BODIPY-vismodegib or vismodegib, and Hh pathway activation was measured by luciferase reporter assay. BODIPY-vismodegib inhibits Hh signaling, although it is less potent than vismodegib. Error bars indicate standard deviation (n=4). (C) MCHERRY-tagged mSMO constructs were expressed in 293T cells, and binding to BODIPY-vismodegib (1 μM) was measured by fluorescence microscopy. Ratio of bound BODIPY-cyclopamine to mCHERRY fluorescence intensities is shown as box plot. The upper and lower bounds of each box correspond to the 75th and 25th percentile of the distribution, and horizontal line indicates the median. Mutations that disrupt the π-cation interaction between R455 and W539 reduce BODIPY-cyclopamine binding, indicative of mSMO shifting to active conformation. The oncogenic SMO-M2 mutant corresponds to W539L. Drosophila SMO (dSMO) was used as negative control. Between 600 and 1000 cells were quantified for each condition. (D) Close up view of inactive hSMO (red, PDB ID: 5L7I) superimposed on active xSMO (blue). Residues R and W are involved in the π-cation lock. The T residue was mutated to D, to reverse constitutive activation in the SMO-M2 mutant, by forming a salt bridge with R in the inactive state. (E) As in (C), but measuring binding of the indicated mCHERRY-tagged constructs to various concentrations of BODIPY-SANT1. The mSMO W539L mutant, which is constitutively active, shows greatly decreased binding to BODIPY-SANT1. Binding is partially rescued by the T542D mutation, but not by T542E. (F) 293T cells expressing HA-tagged mSMO or mSMO CRD were incubated with BODIPY-SANT1, in the absence or presence of 20(S)-OHC (10 μM). The cells were then stained with Alexa647-labeled mouse anti-HA antibodies, to reveal mSMO. Bound BODIPY-SANT1 and mSMO expression were measured by flow cytometry. The graph shows ratios of BODIPY and Alexa647 intensities. Error bars indicate standard deviation. Activation of mSMO by 20(S)-OHC reduces affinity for BODIPY-cyclopamine, below that of mSMO CRD. MSMO CRD is unaffected by 20(S)-OHC. (G) As in (F), but measuring binding of BODIPY-vismodegib. (H) As in (F), but measuring binding of BODIPY-cyclopamine to mSMO A86R. In both the absence and presence of 20(S)-OHC, the A86R mutant has higher affinity for BODIPY-cyclopamine than wild type mSMO. This is consistent with the A86R mutation stabilizing the inactive conformation of mSMO. See also Fig. 2F and S2C, showing that the residue corresponding to A86 in mSMO (V55 in xSMO, and V82 in hSMO) is buried in active SMO and exposed in inactive SMO. (I) As in (H), but measuring binding of BODIPY-SANT1.
Figure S6. Mechanism of 7TM SMO antagonism, Related to Figure 6 (A) Ribbon model showing active cyclopamine-bound xSMO (blue) superimposed on inactive TC114-bound hSMO (light green, PDB ID: 5V56). (B) As in (A), but with cyclopamine-bound xSMO (blue) superimposed on inactive ANTA XV-bound hSMO (green, PDB ID: 4QIM). (C) As in (A), but with cyclopamine-bound xSMO (blue) superimposed on inactive hSMO harboring the inactivating V329F mutation (cyan, PDB ID: 5L7I). The mutation mimics the benzyl moiety of SANT1, filling the hydrophobic cavity and locking SMO in inactive conformation.
Figure S7. A longitudinal tunnel in active SMO, Related to Figure 7 (A) Ribbon diagram showing a close up view of the 7TM orthosteric site, bound to cyclopamine (yellow), LY2940680 (green), ANTA XV (purple), vismodegib (red), SAG1.5 (orange), and SANT1 (cyan). (B) As in (A), but showing only cyclopamine and SANT1, which occupy non-overlapping positions in the 7TM site. (C) Top: ribbon model of cyclopamine-bound inactive hSMO (yellow, PDB ID: 4O9R). The 7TM cavity is shown in blue. Bottom: close up view of the 3 residues that form the “switch valve”. Residue numbers are from hSMO. (D) As in (C), but showing SANT1-bound inactive hSMO (light blue, PDB ID: 4N4W). Note the remodeling of the 7TM site towards TM6 by SANT1. (E) As in (C), but showing active xSMO (blue). Note the opening of a tunnel between TM5 and TM6. The numbers for the “switch valve” residues are from xSMO.
Table S1. Crystallographic Data Collection and Refinement Statistics, Related to Figure 1 and S2
Movie S1. Schematic of conformational changes during SMO activation by sterols, Related to Figure 2 and 3 Ribbon model showing movements during transition from vismodegib-bound hSMO to cyclopamine-bound xSMO. Vismodegib is shown in green and cyclopamine in yellow. Also shown is the π-cation lock between TM6 and TM7.
Movie S2. The longitudinal tunnel in active cyclopamine-bound xSMO, Related to Figure 7 The surface of xSMO is shown in blue, the tunnel in white mesh, and cyclopamine in yellow sticks.
Article highlights.
-
-
Sterols induce conformational change in Smoothened, to activate Hedgehog signaling
-
-
Active Smoothened conformation resembles active G protein-coupled receptors
-
-
Inactive Smoothened is stabilized by “lock” which is broken in cancer mutant
-
-
Longitudinal tunnel in Smoothened might provide path for activating cholesterol
Acknowledgments
This work was supported by NIH grant R01 GM110041 to A.S. We thank members of the Salic lab for helpful discussions. The authors thank members of the SBC-CAT at Argonne National Laboratory for help with experiments at the 19-ID beam line.
Footnotes
Publisher's Disclaimer: This is a PDF file of an unedited manuscript that has been accepted for publication. As a service to our customers we are providing this early version of the manuscript. The manuscript will undergo copyediting, typesetting, and review of the resulting proof before it is published in its final citable form. Please note that during the production process errors may be discovered which could affect the content, and all legal disclaimers that apply to the journal pertain.
Author contributions
P.H., S.Z., B.M.W., D.N., L.A. and A.S. performed cellular and biochemical experiments. P.H. expressed and purified proteins. P.H. and S.Z. conducted crystallization experiments. P.H., S.Z., Y.K. and A.C.K. collected diffraction data sets. P.H. and S.Z. solved structures. P.H., S.Z., Y.K., B.M.W., D.N. and A.S. analyzed data. J.L. synthesized, purified and characterized BODIPY-vismodegib. D.N. characterized the effect of BODIPY-vismodegib in signaling and imaging assays. B.M.W. performed automated microscopy and image analysis for BODIPY ligand binding assays. P.H. and A.S. wrote the manuscript, with input from A.C.K.
Declaration of Interests
The authors declare no competing interests.
Supplemental information
Supplemental information includes seven figures, one table, and two movies, and can be found with this article online.
References
- Alcedo J, Ayzenzon M, Von Ohlen T, Noll M, Hooper JE. The Drosophila smoothened gene encodes a seven-pass membrane protein, a putative receptor for the hedgehog signal. Cell. 1996;86:221–232. doi: 10.1016/s0092-8674(00)80094-x. [DOI] [PubMed] [Google Scholar]
- Byrne EF, Sircar R, Miller PS, Hedger G, Luchetti G, Nachtergaele S, Tully MD, Mydock-McGrane L, Covey DF, Rambo RP, et al. Structural basis of Smoothened regulation by its extracellular domains. Nature. 2016;535:517–522. doi: 10.1038/nature18934. [DOI] [PMC free article] [PubMed] [Google Scholar]
- Caffrey M, Cherezov V. Crystallizing membrane proteins using lipidic mesophases. Nature protocols. 2009;4:706–731. doi: 10.1038/nprot.2009.31. [DOI] [PMC free article] [PubMed] [Google Scholar]
- Chen JK, Taipale J, Cooper MK, Beachy PA. Inhibition of Hedgehog signaling by direct binding of cyclopamine to Smoothened. Genes & development. 2002a;16:2743–2748. doi: 10.1101/gad.1025302. [DOI] [PMC free article] [PubMed] [Google Scholar]
- Chen JK, Taipale J, Young KE, Maiti T, Beachy PA. Small molecule modulation of Smoothened activity. Proceedings of the National Academy of Sciences of the United States of America. 2002b;99:14071–14076. doi: 10.1073/pnas.182542899. [DOI] [PMC free article] [PubMed] [Google Scholar]
- Cherezov V, Rosenbaum DM, Hanson MA, Rasmussen SG, Thian FS, Kobilka TS, Choi HJ, Kuhn P, Weis WI, Kobilka BK, et al. High-resolution crystal structure of an engineered human beta2-adrenergic G protein-coupled receptor. Science. 2007;318:1258–1265. doi: 10.1126/science.1150577. [DOI] [PMC free article] [PubMed] [Google Scholar]
- Choe HW, Kim YJ, Park JH, Morizumi T, Pai EF, Krauss N, Hofmann KP, Scheerer P, Ernst OP. Crystal structure of metarhodopsin II. Nature. 2011;471:651–655. doi: 10.1038/nature09789. [DOI] [PubMed] [Google Scholar]
- Corbit KC, Aanstad P, Singla V, Norman AR, Stainier DY, Reiter JF. Vertebrate Smoothened functions at the primary cilium. Nature. 2005;437:1018–1021. doi: 10.1038/nature04117. [DOI] [PubMed] [Google Scholar]
- Corcoran RB, Scott MP. Oxysterols stimulate Sonic hedgehog signal transduction and proliferation of medulloblastoma cells. Proceedings of the National Academy of Sciences of the United States of America. 2006;103:8408–8413. doi: 10.1073/pnas.0602852103. [DOI] [PMC free article] [PubMed] [Google Scholar]
- de Graaf C, Song G, Cao C, Zhao Q, Wang MW, Wu B, Stevens RC. Extending the Structural View of Class B GPCRs. Trends Biochem Sci. 2017;42:946–960. doi: 10.1016/j.tibs.2017.10.003. [DOI] [PubMed] [Google Scholar]
- Dwyer JR, Sever N, Carlson M, Nelson SF, Beachy PA, Parhami F. Oxysterols are novel activators of the hedgehog signaling pathway in pluripotent mesenchymal cells. The Journal of biological chemistry. 2007;282:8959–8968. doi: 10.1074/jbc.M611741200. [DOI] [PubMed] [Google Scholar]
- Emsley P, Cowtan K. Coot: model-building tools for molecular graphics. Acta Crystallogr D Biol Crystallogr. 2004;60:2126–2132. doi: 10.1107/S0907444904019158. [DOI] [PubMed] [Google Scholar]
- Frank-Kamenetsky M, Zhang XM, Bottega S, Guicherit O, Wichterle H, Dudek H, Bumcrot D, Wang FY, Jones S, Shulok J, et al. Small-molecule modulators of Hedgehog signaling: identification and characterization of Smoothened agonists and antagonists. J Biol. 2002;1:10. doi: 10.1186/1475-4924-1-10. [DOI] [PMC free article] [PubMed] [Google Scholar]
- Gallivan JP, Dougherty DA. Cation-pi interactions in structural biology. Proceedings of the National Academy of Sciences of the United States of America. 1999;96:9459–9464. doi: 10.1073/pnas.96.17.9459. [DOI] [PMC free article] [PubMed] [Google Scholar]
- Gerhart J. 1998 Warkany lecture: signaling pathways in development. Teratology. 1999;60:226–239. doi: 10.1002/(SICI)1096-9926(199910)60:4<226::AID-TERA7>3.0.CO;2-W. [DOI] [PubMed] [Google Scholar]
- Haga K, Kruse AC, Asada H, Yurugi-Kobayashi T, Shiroishi M, Zhang C, Weis WI, Okada T, Kobilka BK, Haga T, et al. Structure of the human M2 muscarinic acetylcholine receptor bound to an antagonist. Nature. 2012;482:547–551. doi: 10.1038/nature10753. [DOI] [PMC free article] [PubMed] [Google Scholar]
- Huang P, Chandra V, Rastinejad F. Structural overview of the nuclear receptor superfamily: insights into physiology and therapeutics. Annu Rev Physiol. 2010;72:247–272. doi: 10.1146/annurev-physiol-021909-135917. [DOI] [PMC free article] [PubMed] [Google Scholar]
- Huang P, Nedelcu D, Watanabe M, Jao C, Kim Y, Liu J, Salic A. Cellular Cholesterol Directly Activates Smoothened in Hedgehog Signaling. Cell. 2016;166:1176–1187e1114. doi: 10.1016/j.cell.2016.08.003. [DOI] [PMC free article] [PubMed] [Google Scholar]
- Ingham PW, McMahon AP. Hedgehog signaling in animal development: paradigms and principles. Genes & development. 2001;15:3059–3087. doi: 10.1101/gad.938601. [DOI] [PubMed] [Google Scholar]
- Janda CY, Waghray D, Levin AM, Thomas C, Garcia KC. Structural basis of Wnt recognition by Frizzled. Science. 2012;337:59–64. doi: 10.1126/science.1222879. [DOI] [PMC free article] [PubMed] [Google Scholar]
- Jazayeri A, Dore AS, Lamb D, Krishnamurthy H, Southall SM, Baig AH, Bortolato A, Koglin M, Robertson NJ, Errey JC, et al. Extra-helical binding site of a glucagon receptor antagonist. Nature. 2016;533:274–277. doi: 10.1038/nature17414. [DOI] [PubMed] [Google Scholar]
- Kruse AC, Ring AM, Manglik A, Hu J, Hu K, Eitel K, Hubner H, Pardon E, Valant C, Sexton PM, et al. Activation and allosteric modulation of a muscarinic acetylcholine receptor. Nature. 2013;504:101–106. doi: 10.1038/nature12735. [DOI] [PMC free article] [PubMed] [Google Scholar]
- Liebschner D, Afonine PV, Moriarty NW, Poon BK, Sobolev OV, Terwilliger TC, Adams PD. Polder maps: improving OMIT maps by excluding bulk solvent. Acta Crystallogr D Struct Biol. 2017;73:148–157. doi: 10.1107/S2059798316018210. [DOI] [PMC free article] [PubMed] [Google Scholar]
- Lum L, Beachy PA. The Hedgehog response network: sensors, switches, and routers. Science. 2004;304:1755–1759. doi: 10.1126/science.1098020. [DOI] [PubMed] [Google Scholar]
- Manglik A, Kruse AC. Structural Basis for G Protein-Coupled Receptor Activation. Biochemistry. 2017;56:5628–5634. doi: 10.1021/acs.biochem.7b00747. [DOI] [PMC free article] [PubMed] [Google Scholar]
- McCoy AJ, Grosse-Kunstleve RW, Adams PD, Winn MD, Storoni LC, Read RJ. Phaser crystallographic software. J Appl Crystallogr. 2007;40:658–674. doi: 10.1107/S0021889807021206. [DOI] [PMC free article] [PubMed] [Google Scholar]
- Myers BR, Sever N, Chong YC, Kim J, Belani JD, Rychnovsky S, Bazan JF, Beachy PA. Hedgehog pathway modulation by multiple lipid binding sites on the smoothened effector of signal response. Developmental cell. 2013;26:346–357. doi: 10.1016/j.devcel.2013.07.015. [DOI] [PMC free article] [PubMed] [Google Scholar]
- Nachtergaele S, Mydock LK, Krishnan K, Rammohan J, Schlesinger PH, Covey DF, Rohatgi R. Oxysterols are allosteric activators of the oncoprotein Smoothened. Nature chemical biology. 2012;8:211–220. doi: 10.1038/nchembio.765. [DOI] [PMC free article] [PubMed] [Google Scholar]
- Nachtergaele S, Whalen DM, Mydock LK, Zhao Z, Malinauskas T, Krishnan K, Ingham PW, Covey DF, Siebold C, Rohatgi R. Structure and function of the Smoothened extracellular domain in vertebrate Hedgehog signaling. eLife. 2013;2:e01340. doi: 10.7554/eLife.01340. [DOI] [PMC free article] [PubMed] [Google Scholar]
- Nakano Y, Guerrero I, Hidalgo A, Taylor A, Whittle JR, Ingham PW. A protein with several possible membrane-spanning domains encoded by the Drosophila segment polarity gene patched. Nature. 1989;341:508–513. doi: 10.1038/341508a0. [DOI] [PubMed] [Google Scholar]
- Nedelcu D, Liu J, Xu Y, Jao C, Salic A. Oxysterol binding to the extracellular domain of Smoothened in Hedgehog signaling. Nature chemical biology. 2013;9:557–564. doi: 10.1038/nchembio.1290. [DOI] [PMC free article] [PubMed] [Google Scholar]
- Okada T, Sugihara M, Bondar AN, Elstner M, Entel P, Buss V. The retinal conformation and its environment in rhodopsin in light of a new 2.2 A crystal structure. J Mol Biol. 2004;342:571–583. doi: 10.1016/j.jmb.2004.07.044. [DOI] [PubMed] [Google Scholar]
- Rasmussen SG, DeVree BT, Zou Y, Kruse AC, Chung KY, Kobilka TS, Thian FS, Chae PS, Pardon E, Calinski D, et al. Crystal structure of the beta2 adrenergic receptor-Gs protein complex. Nature. 2011;477:549–555. doi: 10.1038/nature10361. [DOI] [PMC free article] [PubMed] [Google Scholar]
- Robarge KD, Brunton SA, Castanedo GM, Cui Y, Dina MS, Goldsmith R, Gould SE, Guichert O, Gunzner JL, Halladay J, et al. GDC-0449-a potent inhibitor of the hedgehog pathway. Bioorganic & medicinal chemistry letters. 2009;19:5576–5581. doi: 10.1016/j.bmcl.2009.08.049. [DOI] [PubMed] [Google Scholar]
- Rohatgi R, Milenkovic L, Corcoran RB, Scott MP. Hedgehog signal transduction by Smoothened: pharmacologic evidence for a 2-step activation process. Proceedings of the National Academy of Sciences of the United States of America. 2009;106:3196–3201. doi: 10.1073/pnas.0813373106. [DOI] [PMC free article] [PubMed] [Google Scholar]
- Sinha S, Chen JK. Purmorphamine activates the Hedgehog pathway by targeting Smoothened. Nature chemical biology. 2006;2:29–30. doi: 10.1038/nchembio753. [DOI] [PubMed] [Google Scholar]
- Taipale J, Chen JK, Cooper MK, Wang B, Mann RK, Milenkovic L, Scott MP, Beachy PA. Effects of oncogenic mutations in Smoothened and Patched can be reversed by cyclopamine. Nature. 2000;406:1005–1009. doi: 10.1038/35023008. [DOI] [PubMed] [Google Scholar]
- Taipale J, Cooper MK, Maiti T, Beachy PA. Patched acts catalytically to suppress the activity of Smoothened. Nature. 2002;418:892–897. doi: 10.1038/nature00989. [DOI] [PubMed] [Google Scholar]
- Tukachinsky H, Kuzmickas RP, Jao CY, Liu J, Salic A. Dispatched and scube mediate the efficient secretion of the cholesterol-modified hedgehog ligand. Cell reports. 2012;2:308–320. doi: 10.1016/j.celrep.2012.07.010. [DOI] [PMC free article] [PubMed] [Google Scholar]
- Tukachinsky H, Lopez LV, Salic A. A mechanism for vertebrate Hedgehog signaling: recruitment to cilia and dissociation of SuFu-Gli protein complexes. The Journal of cell biology. 2010;191:415–428. doi: 10.1083/jcb.201004108. [DOI] [PMC free article] [PubMed] [Google Scholar]
- van den Heuvel M, Ingham PW. smoothened encodes a receptor-like serpentine protein required for hedgehog signalling. Nature. 1996;382:547–551. doi: 10.1038/382547a0. [DOI] [PubMed] [Google Scholar]
- Wang C, Wu H, Evron T, Vardy E, Han GW, Huang XP, Hufeisen SJ, Mangano TJ, Urban DJ, Katritch V, et al. Structural basis for Smoothened receptor modulation and chemoresistance to anticancer drugs. Nat Commun. 2014;5:4355. doi: 10.1038/ncomms5355. [DOI] [PMC free article] [PubMed] [Google Scholar]
- Wang C, Wu H, Katritch V, Han GW, Huang XP, Liu W, Siu FY, Roth BL, Cherezov V, Stevens RC. Structure of the human smoothened receptor bound to an antitumour agent. Nature. 2013;497:338–343. doi: 10.1038/nature12167. [DOI] [PMC free article] [PubMed] [Google Scholar]
- Wang Y, Zhou Z, Walsh CT, McMahon AP. Selective translocation of intracellular Smoothened to the primary cilium in response to Hedgehog pathway modulation. Proceedings of the National Academy of Sciences of the United States of America. 2009;106:2623–2628. doi: 10.1073/pnas.0812110106. [DOI] [PMC free article] [PubMed] [Google Scholar]
- Weierstall U, James D, Wang C, White TA, Wang D, Liu W, Spence JC, Bruce Doak R, Nelson G, Fromme P, et al. Lipidic cubic phase injector facilitates membrane protein serial femtosecond crystallography. Nat Commun. 2014;5:3309. doi: 10.1038/ncomms4309. [DOI] [PMC free article] [PubMed] [Google Scholar]
- Wilson CW, Chen MH, Chuang PT. Smoothened adopts multiple active and inactive conformations capable of trafficking to the primary cilium. PloS one. 2009;4:e5182. doi: 10.1371/journal.pone.0005182. [DOI] [PMC free article] [PubMed] [Google Scholar]
- Xie J, Murone M, Luoh SM, Ryan A, Gu Q, Zhang C, Bonifas JM, Lam CW, Hynes M, Goddard A, et al. Activating Smoothened mutations in sporadic basal-cell carcinoma. Nature. 1998;391:90–92. doi: 10.1038/34201. [DOI] [PubMed] [Google Scholar]
- Zhang X, Zhao F, Wu Y, Yang J, Han GW, Zhao S, Ishchenko A, Ye L, Lin X, Ding K, et al. Crystal structure of a multi-domain human smoothened receptor in complex with a super stabilizing ligand. Nat Commun. 2017a;8:15383. doi: 10.1038/ncomms15383. [DOI] [PMC free article] [PubMed] [Google Scholar]
- Zhang Y, Sun B, Feng D, Hu H, Chu M, Qu Q, Tarrasch JT, Li S, Sun Kobilka T, Kobilka BK, et al. Cryo-EM structure of the activated GLP-1 receptor in complex with a G protein. Nature. 2017b;546:248–253. doi: 10.1038/nature22394. [DOI] [PMC free article] [PubMed] [Google Scholar]
Associated Data
This section collects any data citations, data availability statements, or supplementary materials included in this article.
Supplementary Materials
Figure S1. Structural alignment of SMO homologs, Related to Figures 1–7 The figure shows alignment of xSMO, hSMO, mSMO, zebrafish SMO (zSMO), and Drosophila SMO (dSMO), based on the cyclopamine-bound xSMO structure. The CRD is green, LD is cyan, and 7TM domain is blue. All TMs, intracellular loops (ICLs), and extracellular loops (ECLs) are labeled. The connector region is shown in brackets between CRD and LD. The conserved switch motif “SSG” is highlighted with an orange box. The portion of ICL3 replaced with BRIL is underlined by an orange dashed line. The R and W residues that form the -cation lock are shown in red boxes. Pink solid circles indicate residues that line the tunnel in our active xSMO structures. Triangles indicate residues that line the 7TM orthosteric site, defined by cyclopamine binding. Diamond shapes indicate residues that contact SANT1. The yellow squares indicate the 5 residues that form the hydrogen bond network involved in stabilizing both active and inactive SMO conformations.
Figure S2. Structures of full-length Xenopus SMO (xSMO) in complex with cyclopamine or cholesterol, Related to Figure 1 (A) Ribbon model showing crystal packing for xSMO bound to cyclopamine. The CRD is in green, LD in cyan, 7TM in blue, and BRIL in orange. The view is along the z-axis of the crystal. The crystal displays type-I packing, which is typical for LCP crystals. (B) Overall electron density map for xSMO bound to cyclopamine (2Fo-Fc, contoured at 1.1σ), covering the entire SMO-BRIL polypeptide. Domains are colored as in (A). (C) As in (B), but showing a close up view of TM6, a region that shows significant change compared to inactive SMO. (D) As in (C), but showing the third extracellular loop (ECL3). (E) Electron density map for cyclopamine bound to the CRD (2Fo-Fc, contoured at 1.1σ and colored in blue). Cyclopamine is shown in yellow, while residues in the CRD are green. (F) Polder OMIT map (Liebschner et al., 2017) for cyclopamine bound to the CRD (contoured at 3.0σ and colored in green). (G) As in (E), but showing cyclopamine bound to the 7TM site. Residues in the 7TM domain are blue. (H) As in (F), but showing cyclopamine bound to the 7TM site. (I) As in (E), but showing cholesterol (yellow) bound to the CRD. (J) As in (F), but showing cholesterol bound to the CRD.
Figure S3. Sterol-induced CRD reorientation in active SMO, Related to Figure 2 (A) Overlay of structures of full-length hSMO bound to vismodegib (red, PDB ID: 5L7I), TC112 (light yellow, PDB ID: 5V56) and cholesterol (light blue, PDB ID: 5L7D), illustrating the “common architecture” proposed for SMO. The three structures capture the 7TM domain in the same, inactive conformation. The CRD shows slight horizontal shifts between structures. The extracellular extension of TM6 is slightly shifted in the cholesterol-bound SMO structure. (B) Ribbon diagram showing the structure of cyclopamine-bound xSMO (blue), superimposed on the structure of vismodegib-bound hSMO (red, PDB ID: 5L7I). The two structures are oriented so that their CRDs lie on top of each other, highlighting that the last portion of the connector is responsible for the dramatic rotation of the CRD relative to the 7TM domain in active SMO. (C) Structure of inactive vismodegib-bound hSMO (PDB ID: 5L7I). The 7TM domain is in red, CRD in pale green, LD in pale cyan. Shown in green sphere are residues 114 and 156, where introduction of a glycosylation site leads to constitutive activity (Byrne et al., 2016). These two residues are buried in the tri-domain junction of inactive hSMO. Shown in purple sphere is V82 (corresponding to V55 in xSMO), which is solvent-exposed in inactive hSMO, but not in active xSMO. (D) Structure of the xWNT8-mFZ8CRD complex (PDB ID: 4F0A) superimposed on the cyclopamine-bound xSMO structure.
Figure S4. 7TM conformational change and inactivating “locks” in Class A and B GPCRs, Related to Figures 3 and 4 (A) Ribbon model showing the active M2 muscarinic acetylcholine receptor (marine, PDB ID: 4MQS), superimposed on the inactive M2 muscarinic acetylcholine receptor (raspberry, PDB ID: 3UON). The active receptor is stabilized by binding to an agonist and a conformation-specific nanobody (not shown). (B) As in (A), but showing active β2-adrenergic receptor (β2AR, deep teal, PDB ID: 3SN6), superimposed on inactive β2AR (ruby, PDB ID: 2RH1). Active β2AR is stabilized by binding to the heterotrimeric Gs protein (not shown). Note the dramatic movement of TM6. (C) As in (A), but showing the cryo-EM structure of the active glucagon-like peptide-1 receptor (GLP-1R, cyan, PDB ID: 5VAI), superimposed on the crystal structure of the inactive glucagon receptor (GCGR, purple, PDB ID: 5EE7). (D) As in (C), but showing a view rotated by 90 degrees, from the cytoplasmic side. (E) Ribbon model showing the 7TM domain of inactive rhodopsin (pink, PDB ID: 1U19), seen from the cytoplasmic side. Residues R135 (TM3) and E247 (TM6) form the ionic lock characteristic of Class A GPCRs. (F) Same view as in (E), but of active rhodopsin (green, PDB ID: 3PQR), showing the ionic lock broken. (G) As in (E), but showing the structure of inactive GCGR (purple, PDB ID: PDB ID: 5EE7). The HETX motif, which forms a hydrogen bond network that locks the receptor in inactive state, is shown in sticks. The residues are indicated in Wootten numbering. (H) As in (G), but showing the structure of active GLP-1R (cyan, PDB ID: 5VAI), with the lock broken.
Figure S5. Control of 7TM conformation by the π-cation lock and by sterol-bound CRD, Related to Figures 4 and 5 (A) Upper panel: schematic of the BODIPY-vismodegib probe. Bottom panel: Smo−/− MEFs stably expressing mCHERRY-tagged mSMO were incubated with BODIPY-vismodegib (50 nM), in the absence or presence of vismodegib competitor (1 μM). Primary cilia were imaged by live fluorescence microscopy. BODIPY-vismodegib binds specifically to mSMO in primary cilia. (B) Shh LightII cells were incubated with Shh, in the presence of the indicated concentrations of BODIPY-vismodegib or vismodegib, and Hh pathway activation was measured by luciferase reporter assay. BODIPY-vismodegib inhibits Hh signaling, although it is less potent than vismodegib. Error bars indicate standard deviation (n=4). (C) MCHERRY-tagged mSMO constructs were expressed in 293T cells, and binding to BODIPY-vismodegib (1 μM) was measured by fluorescence microscopy. Ratio of bound BODIPY-cyclopamine to mCHERRY fluorescence intensities is shown as box plot. The upper and lower bounds of each box correspond to the 75th and 25th percentile of the distribution, and horizontal line indicates the median. Mutations that disrupt the π-cation interaction between R455 and W539 reduce BODIPY-cyclopamine binding, indicative of mSMO shifting to active conformation. The oncogenic SMO-M2 mutant corresponds to W539L. Drosophila SMO (dSMO) was used as negative control. Between 600 and 1000 cells were quantified for each condition. (D) Close up view of inactive hSMO (red, PDB ID: 5L7I) superimposed on active xSMO (blue). Residues R and W are involved in the π-cation lock. The T residue was mutated to D, to reverse constitutive activation in the SMO-M2 mutant, by forming a salt bridge with R in the inactive state. (E) As in (C), but measuring binding of the indicated mCHERRY-tagged constructs to various concentrations of BODIPY-SANT1. The mSMO W539L mutant, which is constitutively active, shows greatly decreased binding to BODIPY-SANT1. Binding is partially rescued by the T542D mutation, but not by T542E. (F) 293T cells expressing HA-tagged mSMO or mSMO CRD were incubated with BODIPY-SANT1, in the absence or presence of 20(S)-OHC (10 μM). The cells were then stained with Alexa647-labeled mouse anti-HA antibodies, to reveal mSMO. Bound BODIPY-SANT1 and mSMO expression were measured by flow cytometry. The graph shows ratios of BODIPY and Alexa647 intensities. Error bars indicate standard deviation. Activation of mSMO by 20(S)-OHC reduces affinity for BODIPY-cyclopamine, below that of mSMO CRD. MSMO CRD is unaffected by 20(S)-OHC. (G) As in (F), but measuring binding of BODIPY-vismodegib. (H) As in (F), but measuring binding of BODIPY-cyclopamine to mSMO A86R. In both the absence and presence of 20(S)-OHC, the A86R mutant has higher affinity for BODIPY-cyclopamine than wild type mSMO. This is consistent with the A86R mutation stabilizing the inactive conformation of mSMO. See also Fig. 2F and S2C, showing that the residue corresponding to A86 in mSMO (V55 in xSMO, and V82 in hSMO) is buried in active SMO and exposed in inactive SMO. (I) As in (H), but measuring binding of BODIPY-SANT1.
Figure S6. Mechanism of 7TM SMO antagonism, Related to Figure 6 (A) Ribbon model showing active cyclopamine-bound xSMO (blue) superimposed on inactive TC114-bound hSMO (light green, PDB ID: 5V56). (B) As in (A), but with cyclopamine-bound xSMO (blue) superimposed on inactive ANTA XV-bound hSMO (green, PDB ID: 4QIM). (C) As in (A), but with cyclopamine-bound xSMO (blue) superimposed on inactive hSMO harboring the inactivating V329F mutation (cyan, PDB ID: 5L7I). The mutation mimics the benzyl moiety of SANT1, filling the hydrophobic cavity and locking SMO in inactive conformation.
Figure S7. A longitudinal tunnel in active SMO, Related to Figure 7 (A) Ribbon diagram showing a close up view of the 7TM orthosteric site, bound to cyclopamine (yellow), LY2940680 (green), ANTA XV (purple), vismodegib (red), SAG1.5 (orange), and SANT1 (cyan). (B) As in (A), but showing only cyclopamine and SANT1, which occupy non-overlapping positions in the 7TM site. (C) Top: ribbon model of cyclopamine-bound inactive hSMO (yellow, PDB ID: 4O9R). The 7TM cavity is shown in blue. Bottom: close up view of the 3 residues that form the “switch valve”. Residue numbers are from hSMO. (D) As in (C), but showing SANT1-bound inactive hSMO (light blue, PDB ID: 4N4W). Note the remodeling of the 7TM site towards TM6 by SANT1. (E) As in (C), but showing active xSMO (blue). Note the opening of a tunnel between TM5 and TM6. The numbers for the “switch valve” residues are from xSMO.
Table S1. Crystallographic Data Collection and Refinement Statistics, Related to Figure 1 and S2
Movie S1. Schematic of conformational changes during SMO activation by sterols, Related to Figure 2 and 3 Ribbon model showing movements during transition from vismodegib-bound hSMO to cyclopamine-bound xSMO. Vismodegib is shown in green and cyclopamine in yellow. Also shown is the π-cation lock between TM6 and TM7.
Movie S2. The longitudinal tunnel in active cyclopamine-bound xSMO, Related to Figure 7 The surface of xSMO is shown in blue, the tunnel in white mesh, and cyclopamine in yellow sticks.