

Abstract
Aims
The existence of a sex‐by‐formulation interaction in bioequivalence studies implies that the bioequivalence results (i.e., the test/reference ratio of the pharmacokinetic parameters) obtained in one sex are not similar to those obtained in the other sex. Therefore, results obtained in studies including only males would not be representative of the results that would have been obtained in females and vice versa. Recently, a sex‐by‐formulation interaction has been reported in a study for efavirenz tablets. The purpose of this paper is to investigate whether a sex‐by‐formulation interaction is actually observed in the bioequivalence studies conducted with efavirenz tablets.
Methods
The existence of sex‐by‐formulation interaction was investigated in the two studies conducted in our centre, where the same test and reference products were investigated in a pilot study with 12 subjects and a pivotal study with 36 subjects.
Results
In the pilot study, the point estimates for the test/reference ratio of geometrics means of C max in females and males were more than 20% different (95.42% vs.79.38%, i.e., 120.21%), but in a subsequent pivotal study the difference was less than 2% (111.14% vs. 109.98%, i.e., 101.66%).
Conclusions
A sex‐by‐formulation interaction is suggested in the study with a small sample size, but it disappears when the study is repeated with a larger sample size. In conclusion, the analysis of subgroups should be conducted with caution when the size of the subgroups is not powered to show bioequivalence. There seems to be no reason to require bioequivalence studies for efavirenz in both sexes.
Keywords: bioequivalence, efavirenz, females, males, sex, sex‐by‐formulation interaction
What is Already Known about this Subject
Bioequivalence can be investigated in either sex in Europe, but both sexes should be recruited for the US Food and Drug Administration (US‐FDA).
A US‐FDA review of 26 studies suggested that a sex‐by‐formulation interaction can occur, although the frequency may be low.
A sex‐by‐formulation interaction has been reported recently for efavirenz tablets.
What this Study Adds
Studies with small sample size may suggest the existence of sex‐by‐formulation interaction, which disappears when the study is repeated with a larger sample.
Extreme test/reference ratios in different directions and in subjects of different sex create the artefact of a sex‐by‐formulation interaction in small studies.
Introduction
The existence of a sex‐by‐formulation interaction in bioequivalence studies implies that the bioequivalence results (i.e., the test/reference (T/R) ratio of the pharmacokinetic parameters of interest, e.g., C max and AUC) obtained in one sex are not similar to those obtained in the other sex. Therefore, studies conducted in both males and females that show a significant sex‐by‐formulation interaction are not interpretable because the average results are not representative of the results of each sex group. Similarly, results obtained in studies including only males would not be representative of the results that would have been obtained if the study had been conducted only in females and vice versa.
In the European Union, studies conducted in one sex are extrapolated to the other sex 1 under the assumption that a sex‐by‐formulation interaction does not exist and, when observed, it is an artefact. Therefore, studies conducted in only males are acceptable. The US‐FDA recommends that the study subjects should be representative of the general population taking into account sex, age and race, and if a product is intended for use in both sexes, the applicant should include a similar proportion of males and females in the study 2. However, the recruitment of subjects of both sexes does not solve the issue of study result interpretation if a sex‐by‐formulation interaction does exist. If a sex‐by‐formulation interaction were considered possible, bioequivalence should be demonstrated in both sex groups separately instead of in combination. Therefore, the existence of a sex‐by‐formulation interaction would imply that the current regulatory requirements for the generic products are not adequate either in the European Union or the United States.
Presently, limited data is suggestive of the existence of sex‐by‐formulation interaction in bioequivalence studies. Chen et al. 3 reported the results observed in the retrospective analysis of the only 26 studies that had been submitted to the US‐FDA from 1977 to 1995 and were suitable for analysis, in which at least six males and six females participated. In 13% of the datasets and 35% of the studies, a difference larger than 20% in the estimates of the test/reference ratio of the pharmacokinetic parameters between males and females was observed, which was considered as a signal of a sex‐by‐formulation interaction. According to these authors the data suggested that a sex‐by‐formulation interaction can occur, although the frequency may be low. Importantly, mean values obtained from groups (males or females) with less than 12 subjects might be unreliable. In fact, studies with less than 12 subjects are not considered acceptable for a regulatory submission 1, 2. Therefore, these observations should be considered with caution because only eight out of 26 studies included at least 12 subjects per sex group. Only one of these eight studies exhibited a difference larger than 20% between males and female groups (i.e., the signal of a sex‐by‐formulation interaction) and that study investigated a transdermal delivery system containing nitroglycerin 3.
Recently, Ibarra et al. reported the existence of a sex‐by‐formulation interaction in a bioequivalence study for efavirenz tablets that was completed by eight females and six males 4. The purpose of this paper is to investigate whether a sex‐by‐formulation interaction is observed in other bioequivalence studies conducted with efavirenz tablets in our centre, as Ibarra et al. claimed that men and women exhibit different discriminatory potential to detect differences between formulations.
Methods
Bioequivalence studies
Two bioequivalence studies of efavirenz tablets have been carried out in the Clinical Trials Unit of Hospital Universitario La Princesa, Madrid (Spain). All other pivotal bioequivalence studies for efavirenz tablets submitted to the Spanish Agency for Medicines and Health Care Products (AEMPS) were conducted only in males. In both trials, the test products were compared with the same reference product, Sustiva® (Bristol Myers Squibb Pharma, Uxbridge, UK).
The final protocol and the Informed Consent Form were reviewed by the Independent Ethics Committee on Clinical Research of the Hospital Universitario La Princesa and the Spanish Regulatory Authority (AEMPS). The studies were conducted in accordance with the SOPs of the Clinical Trials Unit of Hospital Universitario La Princesa, current Spanish regulations, ICH guidelines for Good Clinical Practice (GCP) (17 January 1997), and the Revised Declaration of Helsinki. All volunteers gave their written informed consent to participate in the study. These studies were monitored by the sponsor and audited by the Quality Assurance Unit of the centre. The clinical and bio‐analytical centres are GCP inspected periodically by AEMPS.
The pilot study (Eudra‐CT number: 2012‐004402‐96) was a randomized, single‐dose, six‐sequence, three‐period crossover bioequivalence study with three formulations of efavirenz 600 mg film‐coated tablets. Twelve healthy subjects (six men and six women) were enrolled and all of them completed the study. This sample size was selected as the minimum with regulatory validity and as recommended in the literature 5. Subjects were randomized to one of six treatment sequences: ABC, ACB, BAC, BCA, CAB or CBA, where A and B were two different test formulations and C was the reference product.
The pivotal study (Eudra‐CT number: 2013‐004289‐32) was a randomized, single dose, two‐sequence, two‐period crossover bioequivalence study of two formulations of efavirenz 600 mg film‐coated tablets. Thirty‐six healthy subjects (17 men and 19 women) were enrolled and all of them completed the study. This sample size was selected in order to have at least 80% power to show bioequivalence in the whole population of males and females under the assumption of 5% difference between test and reference and an expected intra‐subject variability of 25%, since 36 subjects provide 90% power and 26 subjects provide 80% power. However, the sample size of the pivotal study was not calculated to investigate the sex‐by‐formulation interaction or to show equivalence in each sex group.
In both studies, the subjects were housed from 10 h before dosing (to ensure fasting state) to 12 h after dosing. These studies had a wash‐out period of 21 and 28 days, respectively. Blood samples for measuring drug concentration were obtained at baseline and 0.5, 1.0, 1.5, 2.0, 2.33, 2.67, 3.0, 3.33, 3.67, 4.0, 4.5, 5.0, 6.0, 8.0, 12.0, 24.0, 48.0 and 72.0 h post‐dose. The same batches of test (test A in the pilot study and test in the pivotal study, batch SP089525, assay: 99.3%) and reference (Batch 2L69363, assay 98.3%) were used in both studies.
Determination of efavirenz concentrations
Plasma concentrations of efavirenz were determined in the range 20–3950 ng ml−1 with a validated method in accordance with the Guideline on Bioanalytical Method Validation 6 at Anapharm Europe S.L.U., Barcelona, Spain. The bio‐analytical method involved a liquid–liquid extraction procedure with tert‐butyl methyl ether. Efavirenz and efavirenz‐d5 as internal standard were measured by reversed phase high performance liquid chromatography coupled to a tandem mass spectrometry detector (LC–MS/MS).
Pharmacokinetic and statistical analysis
The primary pharmacokinetic parameters, maximum concentration (C max) and the area under the curve of plasma concentrations versus time from time zero to the time of the last measurable concentration (AUC0‐t), were estimated by non‐compartmental analysis with WinNonlin Professional Edition, version 7.0 (Scientific Consulting, Inc., Cary, NC, USA). AUC was calculated with the linear trapezoidal rule. The 90% confidence intervals of the test/reference ratio of C max and AUC were calculated with SAS 9.4 (SAS Institute, Cary, NC, USA), using analysis of variance (ANOVA) with several models as described by Chen et al. 3. The classical ANOVA model takes four factors into account: sequence, subject (sequence), period and formulation (Model 3 in Chen et al. 3). This analysis was applied to all subjects combined and to males and females separately. To investigate the sex‐by‐formulation interaction, the ANOVA model included: sequence, sex, sequence*sex, subject (sequence*sex), period, formulation, sex*formulation (Model 2 in Chen et al. 3). A statistically significant effect was considered to exist when the P‐value of the ANOVA factor was lower or equal to 0.05.
Results
The pilot study included 12 subjects (6 females and 6 males) between 21 and 53 years of age, whose body mass index ranged from 18.87 to 29.75 kg m−2. All subjects completed the study. The pivotal study included 36 subjects (19 females and 17 males) between 19 and 54 years of age and a body mass index ranging from 18.59 to 29.96 kg m−2. All subjects completed the study.
Table 1 shows the bioequivalence results of the pilot study, employing a conventional ANOVA for all subjects, males and females, as well as an ANOVA including the sex effect and the sex‐by‐formulation interaction. It also shows the ratio between females and males in the point estimates of the T/R of C max and AUC and the point estimate and 90% confidence interval of the sex‐by‐formulation interaction.
Table 1.
Average bioequivalence results obtained in the pilot study
| Comparison | C max Point estimate (%) (90% CI) | AUC Point estimate (%) (90% CI) | |
|---|---|---|---|
| TEST A vs. SUSTIVA (C) | Combined analysis (n = 12) | 85.77 (76.85–95.72) | 97.10 (91.78–102.73) |
| Males (n = 6) | 79.38 (65.53–96.15) | 96.99 (86.64–108.57) | |
| Females (n = 6) | 95.42 (82.34–110.58) | 98.60 (91.33–106.44) | |
| Combined analysis with ANOVA including sex | 85.77 (77.28–95.19) | 97.10 (91.61–102.93) | |
| TEST B vs. SUSTIVA (C) | Combined analysis (n = 12) | 77.33 (69.29–86.30) | 91.86 (86.83–97.19) |
| Males (n = 6) | 80.22 (66.22–97.17) | 94.64 (84.54–105.95) | |
| Females (n = 6) | 74.65 (64.41–86.50) | 90.19 (83.55–97.37) | |
| Combined analysis with ANOVA including sex | 77.33 (69.68–85.82) | 91.86 (86.66–97.38) |
| P‐value of sex*formulation interaction | |||
|---|---|---|---|
| Whole dataset | 0.14 | 0.64 | |
| Test A and Reference C only | 0.34 | 0.80 | |
| Test B and Reference C only | 0.70 | 0.57 | |
| Ratio between point estimates of females and males in the stratified analysis | |||
|---|---|---|---|
| TEST A vs. SUSTIVA (C) | 120.21% | 101.66% | |
| TEST B vs. SUSTIVA (C) | 93.06% | 95.30% | |
| Point estimate of the sex*formulation interaction and its 90% CI | |||
|---|---|---|---|
| TEST A vs. SUSTIVA (C) | 120.21 (96.69–149.45) | 101.66 (90.01–114.82) | |
| TEST B vs. SUSTIVA (C) | 93.05 (74.85–115.68) | 95.30 (84.38–107.64) | |
In this pilot study, formulation B exhibited a lower C max than formulation A when compared to the reference formulation. Therefore, formulation A was selected for the pivotal bioequivalence study. Importantly, the combined analysis for the comparison A vs. C showed a point estimate of 85.77%, whereas the separate analysis of males and females showed point estimates for C max of 79.38% and 95.42%, respectively. This difference could be considered suggestive of a sex‐by‐formulation interaction, although the interaction does not reach statistical significance, probably due to the small sample size. Consequently, the results obtained in males are not representative of the results obtained in females and the combined analysis is not representative of either sex group. In contrast, the point estimates for the comparison B vs. C are similar in males and females and the combined analysis is representative of both sex groups.
The results of the pivotal study are given in Table 2, which shows that the point estimates for the test/reference ratio of geometric means of C max are similar between males and females and that there is no suggestion of a significant sex‐by‐formulation interaction. In addition, it is important to clarify that the point estimates change slightly when analysed with the classical ANOVA and the ANOVA containing the sex effect and the sex‐by‐formulation interaction, because the model with the interaction term gives equal weight to both sex groups although the number of males and females is different in this study 7.
Table 2.
Average bioequivalence results obtained in pivotal study
| C max Point estimate (%) (90% CI) | AUC Point estimate (%) (90% CI) | |
|---|---|---|
| Combined analysis (n = 36) | 111.84 (100.97–123.89) | 105.17 (98.89–111.85) |
| Males (n = 17) | 109.98 (96.51–125.34) | 102.09 (95.51–109.12) |
| Females (n = 19) | 111.14 (93.92–131.50) | 106.94 (95.99–119.15) |
| Combined analysis with ANOVA including sex | 111.82 (100.76–124.08) | 105.04 (98.69–111.79) |
| P‐value of sex*formulation | 0.95 | 0.55 |
| Ratio between point estimates of females and males | 101.05% | 104.75% |
| Point estimate of the sex*formulation interaction and its 90% CI | 100.79 (81.61–124.48) | 104.63 (92.20–118.73) |
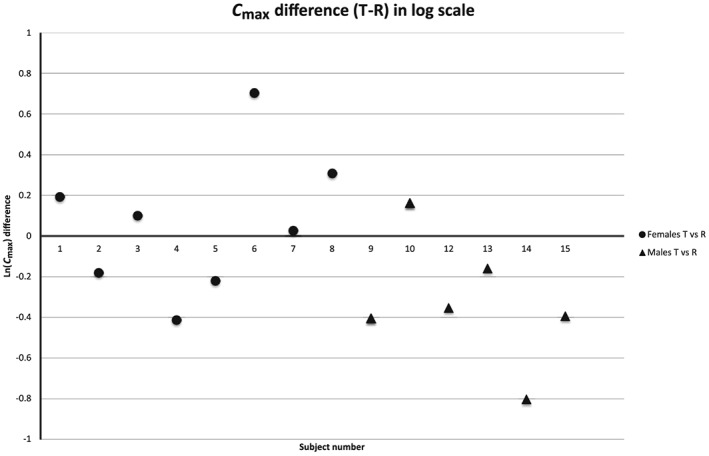
Figures 1, 2, 3 show the distribution plot of the C max differences in log‐scale of all the individual subjects of our pilot study, our pivotal study, and the study published by Ibarra et al. 4 and Vázquez et al. 8, respectively, in order to assess the existence of extreme values and its impact on the mean estimates of these studies. Figure 1 shows that subject #6 (male) in the pilot study behaves as an extreme value for the Test A formulation, with a very negative T‐R difference for C max in log scale, but not for the Test B formulation. In contrast, the highest positive differences T‐R are observed for subjects #4 and #9, both of whom are women. The other nine Test A – Reference C differences are overlapping. Therefore, the mean values of the C max ratios for males and females are influenced by the presence of these extreme values. When comparing Test B vs. Reference C, the distribution of the T‐R differences is overlapped without extreme values and the mean C max ratios are similar in both sexes.
Figure 1.

Distribution of the individual C max differences in logarithmic scale between test and reference products in the pilot study. The comparison between test A and reference C is represented with closed symbols and the comparison between test B and reference C is represented with open symbols. Female subjects are represented with circles and male subjects with triangles
Figure 2.

Distribution of the individual C max differences in logarithmic scale between test (A) and reference (C) products in the pivotal study. Female subjects are represented with circles and male subjects with triangles
Figure 3.
Distribution of the individual C max differences in logarithmic scale between test and reference products in the study by Ibarra et al. 4 and Vázquez et al. 8. Female subjects are represented with circles and male subjects with triangles
Figure 2, the distribution plot for our pivotal study, shows that the distribution of individual Test (A) and the reference differences are overlapped. Although female #7 is an extreme value (1.74 for the difference T‐R in log scale), it does not have any impact because it is compensated for by all the other subjects due to the sufficiently large sample size of the study. Excluding female #7, male #31 is the highest T‐R difference (0.74), and it is similar to female #15 (0.68). On the other side, the lowest T‐R differences are observed in women #8, #16 and #34 (−0.38, −0.40 and −0.42, respectively), but similar low T‐R differences are observed for males #4, #5 and #22 (−0.32, −0.30 and −0.34, respectively).
Figure 3 shows the distribution of the efavirenz study published by Ibarra et al. 4 and Vázquez et al. 8. It can be seen that the T‐R differences overlap, except for the two extreme values (subjects #6 and #14). These two values are in different directions and they belong to subjects of different sex. Consequently, the means of the sex groups are shifted in different directions, which created the suggested sex‐by‐formulation interaction.
Discussion
The importance of sample size on the sex‐by‐formulation interaction
This investigation shows that a sex‐by‐formulation interaction may be suggested in studies with small sample sizes, like those of our pilot study and the study published by Ibarra et al. 4, but when the study is repeated with a larger sample size, like in our pivotal study, the large difference between sex groups might disappear. In the pilot study, the point estimates for C max in females and males are more than 20% different (95.42% vs. 79.38%, i.e., 120.21% as the ratio of females to males in the traditional stratified analysis), but in the pivotal study the difference is less than 2% (111.14% vs. 109.98%, i.e., 101.05% as the ratio of females to males) and less than 1% when assessed as an interaction, with a point estimate of 100.79% (90% CI: 81.61–124.48%).
This may occur because in small studies any extreme value may have a great influence on the mean estimate, causing a biased estimation. For example, if an extreme value is observed in the female group and another extreme value is observed in the male group and these two extreme values have different directions (i.e., one of them suggests supra‐bioavailability and the other suggests infra‐bioavailability), a sex‐by‐formulation interaction will be suggested in these small studies, although it is the consequence of the coincidence of a different sex in the two extreme values with different directions. This can be observed in our pilot study (n = 12) and the study published by Ibarra (n = 14) 4 as illustrated in Figures 1 and 3. In contrast, when the sample size is increased, there are more subjects to compensate for extreme values in a few subjects and more opportunities for these extreme values to occur in both sex groups and thus to compensate for others, as can be observed in our pivotal study (n = 36) (Figure 2).
The results of the pivotal study are different from those of the pilot study, which illustrates that pilot studies with small sample size may provide misleading results. In fact, studies with less than 12 subjects are not acceptable as a reliable demonstration of equivalence 1, 2. Pilot 2 × 2 bioequivalence studies with more than 12 subjects have little gain in precision about the mean, but three‐period designs would be necessary to have little gain in the precision about the variance with sample sizes above 12 subjects 5, which reinforces that analyses based on sample sizes with less than 12 subjects are not reliable. It is also possible that the relative bioavailability of the test and reference products may have changed due to the 11 months that elapsed between each study, as both were close to their expiry date in the second study, but no different behaviour was detected in vitro. However, even if the relative bioavailability had changed during this 11‐month period, this would not necessarily affect the existence or the absence of a sex‐by‐formulation interaction.
In summary, the sex‐by‐formulation interaction detected in the study published by Ibarra et al. 4 might be questioned due to the limited sample size (n = 14) of the study and because the 36.5% difference (70.5% vs. 107%), which was exaggerated by the authors as 52% by expressing it in relative terms using the lowest T/R ratio of males as reference, is caused by two extreme observations in different directions.
Most sensitive population and study conditions to detect non‐bioequivalent products
Ibarra et al. 4 concluded that male subjects are more sensitive to detect differences in efavirenz tablet in vivo performance because males are more likely to be in the fasted state compared to women when the intake of the tablet was 2 h after the meal intake, due to sex‐related differences in gastrointestinal physiology. This hypothetical higher sensitivity of males is inconsequential, even if real, since bioequivalence studies are conducted in fasted state (after fasting for at least 8 h) in the European Union and the United States (not 2 h after a meal) 1, 2, when the product intake is recommended to be taken on an empty stomach. Furthermore, if subjects of only one sex are recruited, they are generally males. Consequently, current bioequivalence studies are already conducted in the most discriminative condition and in the most sensitive population if the conclusions of Ibarra et al. 4 were real and not an artefact caused by extreme values of different directions and sex.
In addition, there is no evidence to support the assumption that females that have fasted for 8–10 h are less discriminative than males. Consequently, male and females can be considered equally discriminative in the studies conducted in accordance with the current guidelines for the fasted state, as illustrated in our pivotal bioequivalence study. Therefore, either sex would be adequate for the comparison.
In our pilot study, a notable difference was observed between males and females, although it was conducted in the fasted state and not just 2 h after meal intake. Males appeared to be more discriminative than females, as described by Ibarra et al. 4, as the point estimate of females was close to 100% (95.42%) and the point estimate of males was 79.38%, outside of the acceptance range (80–125%). However, when the pivotal study was conducted, this difference between males and females turned out to be an artefact. In addition, even if the Ibarra et al. data and our pilot study were not artefacts, the results do not demonstrate that studies including females are essential, as males appeared to be the most discriminative.
The misunderstanding of the sex effect and the sex‐by‐formulation interaction
Other authors have suggested the need for recruiting male and females in bioequivalence studies simply because they exhibit different exposures when the reference product is administered 9. Although obvious, it seems necessary to highlight the fact that the existence of sex‐related differences in pharmacokinetics of many drugs is not indicative of a sex‐by‐formulation interaction because if a drug exhibits different pharmacokinetic parameters between males and females, the same is expected for the test and for the reference product. A sex‐by‐formulation interaction in bioequivalence means that, hypothetically, a test product might be equivalent to the reference product in one sex group (e.g., males) and bioinequivalent in the other group (e.g., females); or bioinequivalent in both groups, but equivalent in the combined analysis (e.g., if the test product were 30% more bioavailable in males and 30% less bioavailable in females, a balanced study with respect to the sex of the recruited participants would be able to show equivalence).
It is also important to clarify that even if the variability in females were larger than in males, which may occur in certain cases, this is not a reason to include women as suggested by some authors 10, because we are not interested in making the demonstration of bioequivalence more difficult, but in detecting differences if they exist. Where variability is larger, more subjects need to be recruited, which can be considered unethical since more subjects are exposed unnecessarily to the risks of the study. Importantly, once a large number of subjects is recruited, the estimation would be the same since the larger variability does not bias the study results (i.e., imprecision is not inaccuracy).
Methodological limitations
The available evidence that suggests the existence of a sex‐by‐formulation interaction has been obtained from exploratory analyses of bioequivalence studies that were conducted in males and females 3, 4, 11, 12, where the sex groups have been analysed separately. It is well known that exploratory subgroup analysis has an increased probability of false‐positive findings due to multiple testing 13. Therefore, any observation in an exploratory analysis has to be confirmed in a new study designed for that purpose. The two studies that were conducted in our centre have the same limitation because they were designed to show bioequivalence based on the combined analysis, but at least the repetition of our first pilot study with a larger sample size gave us the opportunity to confirm that the point estimates are not so different as to suggest a sex‐by‐formulation interaction. This multiplicity problem can be additionally increased when all the available bioequivalence studies are re‐analysed to explore the differences in the point estimates of the T/R ratios of C max and AUC between sex groups and the studies with the largest differences are published as evidence of what are simple random findings.
Furthermore, the methodology that has been employed traditionally to investigate the existence of sex‐by‐formulation interactions in bioequivalence studies 3, 4, 11, 12 based on the differences between the point estimates of the sex groups obtained in the separate (stratified) analysis is known to be incorrect, as stated earlier, due to the increased risk of obtaining false‐positive results. A test for interaction between treatment and subgroup is the appropriate way to examine whether the formulation effect differs between subgroups 14. Tables 1 and 2 show the point estimates, expressed as ratios, for both analyses (the stratified analysis and the interaction sex‐by‐formulation), and the 90% confidence intervals of the sex‐by‐formulation interaction of both studies, as well as the corresponding P‐values. The results have been reported as ratios since the bioequivalence calculations are performed on a multiplicative scale and hence ratios should be reported. However, the previous papers in this field have always reported differences 3, 4, 12. It is notable that the point estimate of the interaction does not agree with the difference between sex groups due to their different method of calculation.
In our studies, the P‐values were always larger than 0.10 and the corresponding 90% confidence intervals include the value zero for the difference between sex groups. However, testing a null hypothesis of absence of sex‐by‐formulation interaction is useless since not rejecting it does not guarantee the non‐existence of interaction, and rejecting it is neither informative about the magnitude of the interaction nor its influence on the validity of the bioequivalence conclusion 15. Therefore, even if some interaction might exist, it is essential to assess whether its magnitude is sufficiently relevant to affect the validity of the study conclusions. The width of the 90% confidence intervals for AUC were sufficiently narrow as to exclude relevant differences between sexes (e.g., differences larger than 20%). In the case of C max, differences larger than 20% (i.e., 80–125%) were excluded in the pivotal study, but not in the pilot study for both comparisons (test A vs. reference C and test B vs. reference C). Therefore, the pivotal study seems to indicate that the sex‐by‐formulation interaction for C max and AUC is not relevant (e.g. not more than 20%) in the formulation under investigation, although it could be suggested based on the difference between the means of the sex groups observed in the comparison between formulation A and C (reference) in the pilot study, since the point estimate of the ratio females/males is 120.21%. Based on the mean observed differences between test and reference and the observed intra‐subject variability, the study was powered to show equivalence for AUC also in the subgroups, but it was not powered (at least 80%) to show equivalence for C max, either in the whole population or the subgroups, due to the large difference observed between test and reference (i.e. point estimates of 110% approximately).
Furthermore, if studies are underpowered to show bioequivalence or to detect a sex‐by‐formulation interaction, which is the case in all these studies with small sample size or larger than expected differences or variability, most of the time the conclusions will be incorrect if we use a criterion based on a P‐value of <5% 16. Therefore, even if the sex‐by‐interaction shows a P‐value of <0.05 in the study reported by Ibarra et al. 4, it is questionable that such a finding is demonstrative of an interaction since the study is underpowered due to its reduced sample size.
Conclusion
Bioequivalence studies with small sample sizes may provide misleading estimates of the formulation effect. Similarly, the sex‐by‐formulation interaction detected in studies with a limited number of males and females is not reliable. Repeating the study with a larger number of males and females is essential to confirm the observations found in any exploratory analysis, e.g., to claim the existence of a sex‐by‐formulation interaction. The analysis should not be based on the difference between subgroups, but on the sex‐by‐formulation interaction once the study has been powered adequately to demonstrate bioequivalence in both sex groups and for detecting the interaction term. No valid conclusion can be claimed when the size of the subgroups was not powered to show bioequivalence and to detect the sex‐by‐formulation interaction. Presently, there is no reason to require bioequivalence studies in both males and females.
Competing Interests
This research did not receive any specific grant from funding agencies in the public, commercial, or not‐for‐profit sectors. F.A.‐S. and D.O. have been consultants or investigators in clinical trials sponsored by the following pharmaceutical companies: Abbott, Alter, Chemo, Cinfa, FAES, Farmalíder, Ferrer, GlaxoSmithKline, Galenicum, Gilead, Janssen‐Cilag, Kern Pharma, Normon, Novartis, Servier, Silverpharma, Teva and Zambon. There are no other competing interests to declare.
The authors are grateful to the pharmaceutical company that sponsored the bioequivalence studies described above and allowed the publication of the data.
Contributors
A.G.‐A., J.G. and E.G.‐R. contributed to the conception of the work and the interpretation of the results. E.G.‐R., J.M. and C.Á. conducted the analysis of the data. F.A.‐S., D.O. and M.R. conducted the bioequivalence studies in the Clinical Trial Unit of Hospital Universitario de la Princesa and contributed to the acquisition of the data.
González‐Rojano, E. , Abad‐Santos, F. , Ochoa, D. , Román, M. , Marcotegui, J. , Álvarez, C. , Gordon, J. , and García‐Arieta, A. (2018) Evaluation of sex‐by‐formulation interaction in bioequivalence studies of efavirenz tablets. Br J Clin Pharmacol, 84: 1729–1737. 10.1111/bcp.13601.
References
- 1. European Medicines Agency . Guideline on the investigation of bioequivalence. London, 2 January 2010. CPMP/EWP/QWP/1401/98 Rev. 1/ Corr http://www.ema.europa.eu/docs/en_GB/document_library/Scientific_guideline/2010/01/WC500070039.pdf (last accessed 2 Jan 2017).
- 2. US Department of Health and Human Services, Food and Drug Administration. Center for Drug Evaluation and Research (CDER) . Guidance for industry. Bioavailability and bioequivalence. Studies for orally administered drug products – general considerations. March 2003, revision 1. http://www.fda.gov/ohrms/dockets/ac/03/briefing/3995B1_07_GFI-BioAvail-BioEquiv.pdf (last accessed 2 Jan 2017).
- 3. Chen ML, Lee SC, Ng MJ, Schuirmann DJ, Lesko LJ, Williams RL. Pharmacokinetic analysis of bioequivalence trials: implications for sex‐related issues in clinical pharmacology and biopharmaceutics. Clin Pharmacol Ther 2000; 68: 510–521. [DOI] [PubMed] [Google Scholar]
- 4. Ibarra M, Magallanes L, Lorier M, Vázquez M, Fagiolino P. Sex‐by‐formulation interaction assessed through a bioequivalence study of efavirenz tablets. Eur J Pharm Sci 2016; 85: 106–111. [DOI] [PubMed] [Google Scholar]
- 5. Julious SA. Sample size of 12 per group rule of thumb for a pilot study. Pharm Stat 2005; 4: 287–291. [Google Scholar]
- 6. European Medicines Agency . Guideline on the bioanalytical method validation. London, 21 July 2011. EMEA/CHMP/EWP/192217/2009 Rev. 1 Corr. 2. http://www.ema.europa.eu/docs/en_GB/document_library/Scientific_guideline/2011/08/WC500109686.pdf (last accessed 2 Jan 2017).
- 7. European Medicines Agency . Questions & answers: positions on specific questions addressed to the Pharmacokinetics Working Party (PKWP). 11. Number of subjects in a two‐stage bioequivalence study design. London, 19 November 2015. EMA/618604/2008 Rev. 13. http://www.ema.europa.eu/docs/en_GB/document_library/Scientific_guideline/2009/09/WC500002963.pdf (last accessed 2 Jan 2017).
- 8. Vázquez M, Fagiolino P, Ibarra M, Magallanes L. Safety assessment of efavirenz after a single‐dose bioequivalence study: a trend to correlate central nervous system effect and plasma concentration. Int J Pharm 2015; 5: 46–52. [Google Scholar]
- 9. Koren G, Vranderick M, Gill SK, Macleod S. Sex differences in the pharmacokinetics and bioequivalence of the delayed‐release combination of doxylamine succinate‐pyridoxine hydrochloride; implications for pharmacotherapy in pregnancy. J Clin Pharmacol 2013; 53: 1268–1276. [DOI] [PubMed] [Google Scholar]
- 10. Koren G, Nordeng H, MacLeod S. Gender differences in drug bioequivalence. Time to rethink practices. Clin Pharmacol Ther 2013; 93: 260–262. [DOI] [PubMed] [Google Scholar]
- 11. Ashiru DAI, Patel R, Basit AW. Polyethylene glycol 400 enhances the bioavailability of a BCS class III drug (ranitidine) in male subjects but not females. Pharm Res 2008; 25: 2327–2333. [DOI] [PubMed] [Google Scholar]
- 12. Ibarra M, Vázquez M, Fagiolino P. Sex effect on average bioequivalence. Clin Ther 2017; 39: 23–33. [DOI] [PubMed] [Google Scholar]
- 13. European Medicines Agency . Guideline on the investigation of subgroups in confirmatory clinical trials (draft), 23 January 2014. EMA/CHMP/539146/2013. http://www.ema.europa.eu/docs/en_GB/document_library/Scientific_guideline/2014/02/WC500160523.pdf (last accessed 2 Jan 2017).
- 14. Brookes ST, Whitely E, Egger M, Smith GD, Mulheran PA, Peters TJ. Subgroup analyses in randomized trials: risks of subgroup‐specific analyses. J Clin Epidemiol 2004; 57: 229–236. [DOI] [PubMed] [Google Scholar]
- 15. Ocaña J, Sánchez OMP, Carrasco JL. Carryover negligibility and relevance in bioequivalence studies. Pharmaceut Statist 2015; 14: 400–408. [DOI] [PubMed] [Google Scholar]
- 16. Colquhoun D. An investigation of the false discovery rate and the misinterpretation of p‐values. R Soc Open Sci 2014; 1: 140216. [DOI] [PMC free article] [PubMed] [Google Scholar]