

Summary
Psoriasis microenvironment, characterized by an imbalance between T helper type 1 (Th1)/Th17 and Th2 cytokines and also influences the mesenchymal stem cells (MSCs) phenotypical profile. MSCs from healthy donors (H‐MSCs) can exert a strong paracrine effect by secreting active soluble factors, able to modulate the inflammation in the microenvironment. To evaluate the influence of H‐MSCs on MSCs from psoriatic patients (PsO‐MSCs), H‐MSCs and PsO‐MSCs were isolated and characterized. Indirect co‐culture of H‐MSCs with PsO‐MSCs was performed; effects on proliferation and expression of cytokines linked to Th1/Th17 and Th2 pathways were assayed before and after co‐culture. The results show that before co‐culture, proliferation of PsO‐MSCs was significantly higher than H‐MSCs (P < 0·05) and the levels of secreted cytokines confirmed the imbalance of Th1/Th17 versus the Th2 axis. After co‐culture of H‐MSCs with PsO‐MSCs, healthy MSCs seem to exert a ‘positive’ influence on PsO‐MSCs, driving the inflammatory phenotypical profile of PsO‐MSCs towards a physiological pattern. The proliferation rate decreased towards values nearer to those observed in H‐MSCs and the secretion of the cytokines that mostly identified the inflammatory microenvironment that characterized psoriasis, such as interleukin (IL)‐6, IL‐12, IL‐13, IL‐17A, tumour necrosis factor (TNF)‐α and granulocyte–macrophage colony‐stimulating factor (G‐CSF), is significantly lower in co‐cultured PsO‐MSCs than in individually cultured PSO‐MSCs (P at least < 0·05). In conclusion, our preliminary results seem to provide an intriguing molecular explanation for the ever‐increasing evidence of therapeutic efficacy of allogeneic MSCs infusion in psoriatic patients.
Keywords: cytokines, inflammation, mesenchymal stem cells, psoriasis, Th pathways
Introduction
Psoriasis is a chronic immune‐mediated and inflammatory skin disease. It is considered a systemic rather than a simply cutaneous disease, sustained by a low‐level inflammatory status, which promotes the development of several comorbidities which share the same pathogenic background throughout time 1. It is now considered as one of the most common immune‐mediated disorders, with an imbalance between T helper type 1 (Th1)/Th17 and Th2 cytokine expression 2. Following T cell activation and the recruitment of other cells of the immune system, keratinocytes are stimulated to proliferate, produce mediators responsible of further migration of immune cells and promote angiogenesis. In addition, the inflammatory process is maintained via a positive feedback loop due to the immune cell and cytokine production by keratinocytes 3, 4, 5, 6, 7. In this scenario, it has been already demonstrated that mesenchymal stem cells (MSCs) are involved early in psoriasis onset and progression. MSCs isolated from skin of psoriatic patients show an imbalance between Th1/Th17 and Th2 pathways, reflecting the phenotype of differentiated skin cells 4, 8. Even more, an altered microenvironment in psoriatic lesions may induce resident MSCs to produce angiogenic and proinflammatory mediators sustaining skin lesion development 9. This study aimed to evaluate the influence of MSCs isolated from healthy people (H‐MSCs) on MSCs from psoriatic patients (PsO‐MSCs). H‐MSCs and PsO‐MSCs were isolated and characterized. Then, a co‐culture was performed, and both proliferation of PsO‐MSCs and expression of cytokines linked to Th1/Th17 and Th2 pathways were assayed before and after co‐culture.
Materials and methods
In this study, approved by Politechnic Marche University Ethical Commitee (Protocol 2016 0360 OR) and conducted in accordance with the Declaration of Helsinsky, we enrolled 11 Caucasian patients (five males, six females, mean age 47 ± 8·5), after written consent was obtained.
They were suffering from chronic, stable, plaque‐type psoriasis with body surface area (BSA) >10%, psoriasis area severity index (PASI) > 10 and dermatology life quality index (DLQI) > 10. None of the patients reported symptoms or signs related to psoriatic arthritis.
They were unresponsive to previous conventional treatments, including topical applications of corticosteroids, retinoids, vitamin D3 derivates and systemic administration of cyclosporin, methotrexate, psoralen plus ultraviolet A (UVA) phototherapy (PUVA), UVA and narrow‐band ultraviolet B (UVB‐Nb), and they were free from systemic or topical therapies for almost 3 and 1 months, respectively. As acitretin has a long tissue accumulation time, patients who had received acitretin within the last 2 years were excluded from the study.
For MSC isolation, all psoriatic patients received a skin punch biopsy, taken from the left arm, in the middle area of extensor surface, performed with a 5‐mm sterile cutaneous skin punch biopsy device (Gima Medical Devices s.r.l., Rome, Italy) after local anaesthesia with lidocaine 2%.
H‐MSCs were isolated from 11 skin samples obtained from plastic surgery procedures in healthy subjects.
Isolation, culture and characterization of MSCs
Samples from healthy and psoriatic people were treated as reported previously 10, 11, 12 and cultured with mesenchymal stem cell growth medium (MSCGM; Lonza, Basel, Switzerland). A phase‐contrast microscopy (Leica DM IL; Leica Microsystems GmbH, Wetzlar, Germany) was used to observe the growth and the morphology of cells. Making use of an algorithm available online (http://www.doubling-time.com), the doubling time (DT) was calculated as DT = t × lg2/(lgNt −lgN0), where N0 and Nt are the number of inoculated or harvested cells, respectively, and t is the time of culture in hours. Then, cells were characterized as established in the minimal criteria by Dominici for the definition of human MSCs 13. The plastic‐adherence in standard culture conditions, the specific immunophenotype and the differentiation potential towards osteogenic, chondrogenic and adipogenic lineages were assessed. For all the analyses, cells at third and fifth passages and confluence of approximately 80% were used. The immunophenotype was evaluated by staining with 2·5 × 105 cells with human leucocyte antigen D‐related (HLA‐DR), CD14, CD19, CD34, CD45, CD73, CD90 or CD105 fluorescein isothiocyanate‐conjugated antibody (Becton Dickinson, Franklin Lakes, NJ, USA) for 45 min, and subsequently examining by flow cytometry with a Becton Dickinson FACScan instrument. Data were acquired using CellQUEST software (Becton Dickinson). For the differentiation potential 14, cells were maintained in Stempro® osteogenesis, chondrogenesis and adipogenesis differentiation kits (Gibco, Grand Island, NY, USA). Cells in MSCGM were used as negative control. Ostogenic differentiation was verified by Von Kossa staining and alkaline phosphatase reaction, adipogenic differentiation by Oil Red and chondrogenic differentiation by Safranin O staining.
Indirect co‐culture condition
PsO‐MSCs of each subject (1·5 × 105 cells) were seeded individually at the lower surface, and the following day the same amount of H‐MSCs was added at the upper surface of a polycarbonate transmembrane filter in a Transwell filter system in a six‐well plate (pore size 0·4 μm; BD Falcon, Bedford, MA, USA). Samples of H‐MSCs and PsO‐MSCs were matched randomly for co‐culture experiments. Cells were co‐cultured in MSCGM for 72 h (H‐MSCs/PsO‐MSCs). PsO‐MSCs and H‐MSCs cultured alone were used as mocks for control purpose. After 72 h, PsO‐MSCs (mock and co‐cultured) and H‐MSCs were processed according to the XTT‐assay experimental protocol. Absorbance was read at 490 nm with a multi‐plate reader (MultisKan Go; Thermo Fisher, Fremont, CA, USA). The data are reported as percentages ± standard deviation (s.d.) of the average values (for co‐cultured and mock PsO‐MScs) measured in parallel in the control cells (expressed as 100%).
Medium was collected, centrifuged at 201 g for 5 min and filtered in 0·22 μM pore membrane. Medium was stored at −80°C until use.
RT–PCR and enzyme‐linked immunosorbent assay (ELISA) array
The expression of cytokines belonging to Th1/Th17 and Th2 pathways [interleukin (IL)‐2, IL‐4, IL‐5, IL‐6, IL‐10, IL‐12, IL‐13, IL‐17A, interferon (IFN)‐γ, tumour necrosis factor (TNF)‐α, granulocyte–macrophage colony‐stimulating factor (G‐CSF), transforming growth factor (TGF)β] was analysed by real time–polymerase chain reaction (RT–PCR) and ELISA test in PsO‐MSCs before and after co‐cultures with healthy MSCs. H‐MSCs cultured individually were used for comparative purposes.
Total RNA was isolated from 1 × 10⁶ cells at the fourth passage using 5 Prime PerfectPure RNA Purification (5 Prime, Hamburg, Germany) and retrotranscribed in cDNA (GoScript™ Reverse Transcription System; Promega, Milan, Italy). All samples were tested in triplicate with the housekeeping genes ribosomal protein lateral stalk subunit P0 (RPLP0) and glyceraldehyde 3‐phosphate dehydrogenase (GAPDH) for data normalization. Of the two, GAPDH was the most stable and was used for subsequent normalization. After amplification, melting curves were acquired. Direct detection of PCR products was monitored by measuring the fluorescence produced by SYBR Green I dye (EVA Green PCR Master Mix; Bio‐Rad, Hercules, CA, USA) binding to double‐strand DNA after every cycle. These measurements were then plotted against cycle numbers. The parameter threshold cycle (Ct) was defined as the cycle number at which the first detectable increase above the threshold in fluorescence was observed.
The amount of mRNA detected in mock and co‐cultured PsO‐MSCs was calculated as X‐fold with respect to H‐MSCs (expressed as 1) by the 2−ΔΔCt method 14, where ΔCt = Ct (gene of interest)–Ct (control gene) and Δ (ΔCt) = ΔCt (PsO‐MSCs alone or co‐cultured)–ΔCt (H‐MSCs). X‐fold was calculated for the selected genes in all 22 samples of mock MSCs (11 H‐MScs and 11 PsO‐MSCs) and in the 11 co‐cultures (matched randomly). Subsequently, mean ± s.d. from experiments in triplicate was calculated and displayed. All the primer sequences are reported in Table 1.
Table 1.
Primer sequences
| Gene | Primers |
|---|---|
| IL‐2 |
Forward 5′‐TCACCAGGATGCTCACATTTAAGT‐3′ Reverse 5′‐GAGGTTTGAGTTCTTCTTCTAGACACTGA‐3′ |
| IL‐4 |
Forward 5′‐GAAGAGAGGTGCTGATTG‐3′ Reverse 5′‐GGAAGAACAGAGGGGGAAG‐3′ |
| IL‐5 |
Forward 5′‐ TAGCTCTTGGAGCTGCCTACGTGTAT‐3′ Reverse 5′‐AAGCAGTGCCAAGGTCTCTTTCAC‐3′ |
| IL‐6 |
Forward 5′‐ATTCTGCGCAGCTTTAAGGA‐3′ Reverse 5′‐AACAACAATCTGAGGTGCCC‐3′ |
| IL‐10 |
Forward 5'‐CAAGGACTCCTTTAACAACAAGTT‐3′ Reverse 5'‐GAGATGCCTTCAGCAGAGTG‐3′ |
| IL‐12 |
Forward 5′‐GGAGTACCCTGACACCTG‐3′ Reverse 5′‐AGATGACCGTGGCTGAGG‐3′ |
| IL‐13 |
Forward 5′‐CCAGAAGGCTCCGCTCTGCAA‐3′ Reverse 5′‐GTGCGGGCAGAATCCGCTCA‐3′ |
| IL‐17A |
Forward 5′‐TCACAATCCCACGAAATCCAG −3′ Reverse 5′‐GTGAGGTGGATCGGTTGTAG‐3′ |
| TGF‐β |
Forward 5'‐GGCCAGATCCTGTCCAAGC‐3′ Reverse 5'‐GTGGGTTTCCACCATTAGCAC‐3′ |
| TNF‐α |
Forward 5'‐CGAGTCTGGGCAGGTCTACTTT‐3′ Reverse 5'‐AAGCTGTAGGCCCCAGTGAGTT‐3′ |
| IFN‐γ |
Forward 5'‐ATGAAATATACAAGTTATATCTTGG‐3′ Reverse 5'‐TTACTGGGATGCTCTTCGAC‐3′ |
| G‐CSF |
Forward 5'‐GAGCAAGTGAGGAAGATCCAG‐3′ Reverse 5'‐CAGCTTGTAGGTGGCACACTC‐3′ |
| GAPDH |
Forward 5'‐CCCTTCATTGACCTCAACTACATG‐3′ Reverse 5'‐TGGGATTTCCATTGATGACAAGC‐3′ |
| RPLP0 |
Forward 5'‐CCATTCTATCATCAACGGGTACAA‐3′ Reverse 5'‐TCAGCAAGTGGGAAGGTGTAATC‐3′ |
IL = interleukin; HLA‐DR = human leucocyte antigen D‐related; TGF = transforming growth factor; IFN = interferon; GAPDH = glyceraldehyde 3‐phosphate dehydrogenase; RPLP0 = ribosomal protein lateral stalk subunit P0; G‐CSF = granulocyte–macrophage colony‐stimulating factor.
Secretion of the same factors was detected on conditioned medium using the Multi‐Analyte ELISA array Kit (Qiagen, Hilden, Germany). Briefly, medium conditioned by each sample of PsO‐MSCs (before and after co‐culture) and H‐MSCs was used for the test. Samples were dispensed into a 96‐well microtitre plate and incubated for 2 h at room temperature. After washing, avidin–horseradish peroxidase (HRP)‐conjugated antibody was added to the plate and incubated for 30 min. Finally, captured cytokines were detected by addition of substrate solution. Reaction was assessed at 450 nm with a microtitre plate reader (Multiskan Go microplate reader; Thermo Scientific, Monza, Italy) within 30 min of stopping the reaction. Absorbances of cytokines in the conditioned media were determined and concentrations were expressed in pg/ml. Data are mean ± s.d. from three independent experiments.
Statistical analysis
All data were analysed using GraphPad Prism software (version 6.0; La Jolla, CA, USA). All reported data were continuous variables expressed as means ± s.d. The normal distribution of continuous variables was verified with the Kolmogorov–Smirnov test. Statistical analyses included the ordinary one‐way analysis of variance (anova) test for multiple comparison, and a P‐value less than 0·05 was considered to be statistically significant.
Results
H‐MSCs and PsO‐MSCs showed similar behaviour related to characterization, with no statistically relevant differences. In addition, co‐culture experiments made with different donors evidenced no significant dissimilarities. Therefore, results are reported as mean ± s.d. for healthy, psoriatic or co‐cultured cells in each analysis.
Characterization of MSCs
After approximately 7 days, cells with a typical fibroblast‐like morphology started to be visible near the biopsy pieces, both from psoriatic and healthy subjects (Fig. 1a). Proliferation rate was monitored from the first to the twelfth passages by calculating the DT, as reported above. PsO‐MSCs showed a lower DT than H‐MSCs, at approximately 19 ± 2 for H‐MSCs and 11 ± 2 for PsO‐MSCs for the first eight passages. Then, in both cases, DT increased gradually up to passage 12 to 39 ± 2 h for H‐MSCs and 36 ± 1 h for PsO‐MSCs (Fig. 1b). Cells were then characterized following the minimal criteria of Dominici 13. First, cells were plastic‐adherent in culture. Secondly, cells showed a typical mesenchymal stem cell profile, resulting positive to CD73, CD90 and CD105 and negative for the other considered antigens (HLA‐DR, CD14, CD19, CD34, CD45) (Table 2). Cells were also able to differentiate between osteogenic (Fig. 2a,b,e,f), adipogenic (Fig. 2c,g) and chondrogenic (Fig. 2d,h) lineages, as demonstrated by the specific stainings. Differentiation potential among various samples of H‐MSCs or PsO‐MSCs and between samples of H‐MSCs and PsO‐MSCs showed no dissimilarity. Minimal criteria were therefore satisfied, and cells defined as MSCs.
Figure 1.
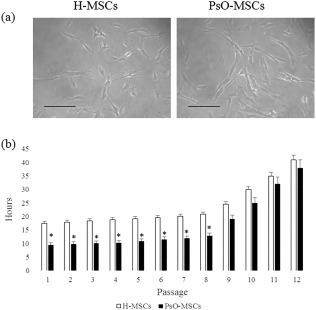
Cell morphology and Doubling time (a) Phase‐contrast images of mesenchymal stem cells (MSCs) from healthy subjects (C‐MSCs) and psoriatic patients (PsO‐MSCs) after 14 days of culture. Scale bar = 100 μm. (b) Doubling time was calculated over 21 days (8th passage). Data are mean ± standard deviation (s.d.); *P < 0·05 PsO‐MSCs versus H‐MSCs.
Table 2.
Flow cytometry results of mesenchymal stem cells (MSCs)
| H‐MSCs | PsO‐MSCs | |
|---|---|---|
| HLA‐DR | – | – |
| CD14 | – | – |
| CD19 | – | – |
| CD34 | – | – |
| CD45 | – | – |
| CD73 | + | + |
| CD90 | + | + |
| CD105 | + | + |
Positive immunolabelling (+) was defined as a level of fluorescence > 90% of the corresponding isotype‐matched control antibodies. Percentages < 2% were considered negative (–). No differences were noted among the 12 samples (11 healthy subjects and 11 psoriatic patients).
Figure 2.
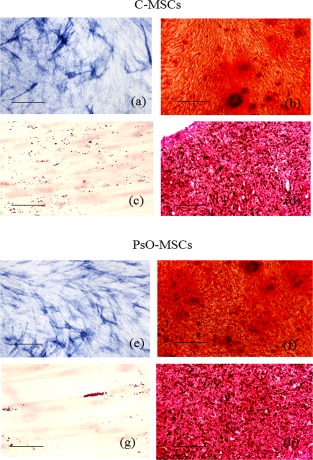
Multi‐lineage differentiation of mesenchymal stem cells (MSCs). Representative images of differentiation experiments of H‐MSCs (a–d) and psoriatic patients PsO‐MSCs (e–h). Osteogenic differentiation: alkaline phospatase reaction (a,e; scale bar = 200 μm) and Alizarin red (b,f; scale bar = 200 μm); adipocyte differentiation: Oil Red staining (c,g; scale bar = 100 μm); chondrogenic differentiation: Safranin‐O (d,h; scale bar = 200 μm).
Influence of H‐MSCs on PsO‐MSC proliferation
After 72 h, the proliferation of H‐MSCs, PsO‐MSCs and H‐MSCs/PsO‐MSCs was assessed by XTT test. Co‐cultured PsO‐MSCs showed a reduction on cell proliferation of approximately 30–35% compared to mock (Fig. 3), approaching the value of H‐MSCs.
Figure 3.
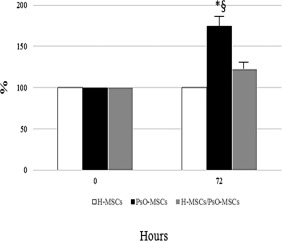
Proliferation of psoriatic patients‐mesenchymal stem cells (PsO‐MSCs) after co‐cultures with H‐MSCs. The histogram depicts the proliferation of mocks and co‐cultured (72 h) H‐MSCs and PsO‐MSCs assessed by XTT assay. Data are reported as percentages ± standard deviation (s.d.) of the average values (for co‐cultured and mock PsO‐MSCs) measured in parallel in the control cells (expressed as 100%). H‐MSCs: MSCs isolated from healthy subjects; PsO‐MSCs: MSCs isolated from psoriatic patients; H‐MSCs/PsO‐MSCs co‐culture: co‐cultures of H‐MSCs with PsO‐MSCs. *P < 0·05 PsO‐MSCs versus H‐MSCs; §P < 0·05 PsO‐MSCs versus H‐MSCs/PsO‐MSCs.
Expression profile of cytokines belonging to Th1/Th17 and Th2 pathways
Expression of selected cytokines belonging to the Th1/Th17 and Th2 pathways was evaluated by RT–PCR and ELISA before and after co‐cultures. Before co‐cultures, mRNA analysis revealed that PsO‐MSCs express significantly higher levels of IL‐6, IL‐12, IL‐13, IL‐17A, TGF‐β, IFN‐γ, TNF‐α and G‐CSF than H‐MSCs. IL‐2 was less expressed by PsO‐MSCs than H‐MSCs; finally, the expression levels of IL‐4, IL‐5 and IL‐10 did not show significant differences (Fig. 4a). These data were confirmed completely by the ELISA test, which showed that IL‐4, IL‐5 and IL‐10 were secreted equally by PsO‐MSCs and H‐MSCs, while IL‐6, IL‐12, IL‐13, IL‐17A, TGF‐β, IFN‐γ, TNF‐α and G‐CSF were secreted more by PSO‐MSCs than H‐MSCs. Finally, the level of secreted IL‐2 was lower in PsO‐MSCs than in H‐MSCs (Fig.4b). After co‐culture, secretion of IL‐6, IL‐12, IL‐13, IL‐17A, TNF‐α, TG‐Fβ, IFN‐γ and G‐CSF decreased, reaching levels similar to those obtained from H‐MSCs (Fig. 4b). Conversely, the secretion of IL‐2 was increased compared to individually cultured PsO‐MSCs and closer to H‐MSCs (Fig. 4b). Because when analysing the conditioned medium of co‐cultures it is impossible to differentiate whether the variations observed in the levels of secreted cytokines are related to H‐ or PsO‐MSCs, the analysis of mRNA was repeated in co‐cultured PsO‐MSCs. As shown in Fig. 4a, the levels of mRNAs detected in PsO‐MSCs after co‐culture with H‐MSCs retrace the changes observed in cytokine secretion.
Figure 4.
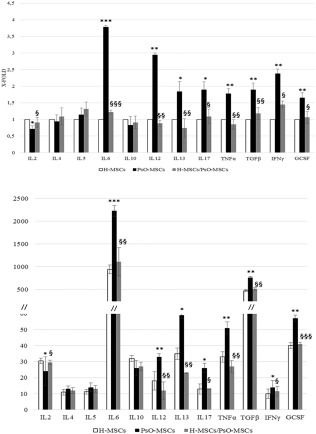
Expression of selected genes by reverse transcription–polymerase chain reaction (RT–PCR) (a) and enzyme‐linked immunosorbent assay (ELISA) test (b) in psoriatic patients‐mesenchymal stem cells (PsO‐MSCs) (before and after co‐cultures) and H‐MSCs. (a) Relative gene expression in MSCs obtained from psoriatic patients before (PsO‐MSCs) and after co‐cultures (H‐MSCs/PsO‐MSCs) with MSCs derived from healthy subjects (H‐MSCs). Levels of expression detected in PsO‐MSCs (mock and co‐cultured) are referred as X‐fold with respect to H‐MSCs. X‐fold was calculated for the selected genes in all the 22 samples of mock MSCs (11 H‐MScs and 11 PsO‐MSCs) and in the 11 co‐cultures (matched randomly). Subsequently, mean ± standard deviation (s.d.) from experiments in triplicate was calculated and displayed. *P < 0·05 PsO‐MSCs versus H‐MSCs; **P < 0·01 PsO‐MSCs versus H‐MSCs; ***P < 0·001 PsO‐MSCs versus H‐MSCs; §P < 0·05 H‐MSCs/PsO‐MSCs versus PsO‐MSCs; §§P < 0·01 H‐MSCs/PsO‐MSCs versus PsO‐MSCs; §§§P < 0·001 H‐MSCs/PsO‐MSCs versus PsO‐MSCs. H‐MSCs/PsO‐MSCs versus H‐MSCs: not significant. (b) Secretion of cytokines in the conditioned medium of MSCs obtained from psoriatic patients before (PsO‐MSCs) and after co‐cultures (H‐MSCs/PsO‐MSCs) with MSCs derived from healthy subjects (H‐MSCs). Data are mean ± s.d. from three independent experiments and expressed in pg/ml.
Discussion
Mesenchymal stem cells (MSCs) are stromal‐derived non‐haematopoietic progenitor cells residing in several adult and neonatal tissues as bone marrow, umbilical cord, adipose tissue, amniotic fluid, placenta, dental pulp and skin 15. MSCs have been revealed to possess distinct immune‐modulatory properties, which induce immune tolerance in different inflammatory conditions 16. They exert these effects by influencing on proliferation, recruitment, function and fate of both innate and adaptive immune cells, including T cells 17, B cells 18, dendritic cells (DCs) 19 and natural killer (NK) cells 20. All these properties are probably mediated through direct cell‐to‐cell contact and paracrine fashion by secreting several immune‐modulatory mediators.
The anti‐inflammatory and immune‐modulatory activity of MSCs may be paramount in the restoration of localized or systemic conditions for normal healing and tissue regeneration 21.
Based on accumulated results, MSCs obtained from patients with psoriasis have been shown to be impaired in their anti‐inflammatory function against Th cell subsets 4, 22. Liu et al. 22 have demonstrated recently that psoriatic MSCs have a reduced immunosuppressive capability, as they found a decreased ability to inhibit cell proliferation in psoriatic MSCs co‐cultured with activated T cells in vitro, even after stimulation with IFN‐γ together with TNF‐α. These results are in line with evidence that MSC phenotype and activity can be regulated by intrinsic mechanisms and extrinsic cues that emanate from the microenvironment, one of which is inflammation. However, MSCs can react differently to inflammation, and the interplay between inflammation and MSCs activity is a growing research field.
In psoriasis, the Th1/Th17 inflammatory milieu has been demonstrated to influence directly both the phenotype and proliferative rate of MSCs, driving them to produce several Th1/Th17 cytokines [IL‐6, IL‐12, IL‐13, TNF‐α, G‐CSF, vascular endothelial growth factor (VEGF) and inducible nitric oxide synthase (iNOS)]. In this scenario, MSCs act as a source of inflammatory molecules, able to perpetrate the inflammation actively during the course of disease.
The aim of this study was to evaluate whether and how the interaction between healthy MSCs (H‐MSCs) and psoriatic MSCs (PsO‐MSCs) in a co‐culture in‐vitro model could modify the proliferative activity and phenotype profile of psoriatic MSCs.
Before co‐culture, the proliferation rate of PsO‐MSCs was significantly higher than H‐MSCs; the increased growth rate reflects the increased proliferation of keratinocytes followed by the changes in the epidermis that resembles unsuppressed wound healing.
The level of secreted cytokines at baseline confirm the imbalance of Th1/17 versus the Th2 axis also observed in our previous studies 4, 8, 23: MSCs from psoriatic patients secrete higher amounts of Th1/Th17 inflammatory molecules (IL‐6, IL‐12, IL‐13, IL‐17A, TGF‐β, IFN‐γ, TNF‐α and G‐CSF) than MSCs from control subjects. Conversely, IL‐2 is less secreted by PsO‐MSCs than H‐MSCs.
After co‐culture of H‐MSCs with PsO‐MSCs, healthy MSCs seem to exert a ‘positive’ influence on PsO‐MSCs, driving the inflammatory phenotypical profile of PsO‐MSCs towards a physiological pattern. All the changes observed on PsO‐MSCs result from a paracrine mechanism exerted on them by healthy MSCs, as the two MSCs populations were not in direct contact but separated by a porous membrane. Note that, unlike pharmaceutical treatments that deliver a single agent at a specific dose, MSCs are site ‐regulated and secrete bioactive factors and signals at variable concentrations in response to local microenvironmental cues 21.
First, the proliferation rate decreases towards values nearer to those observed in H‐MSCs and keratinocyte hyperproliferation is consequently reduced. Our results underline that co‐cultures restore conditions closer to the physiological microenvironment; at baseline, the levels of secreted IL‐6, IL‐12, IL‐13, IL‐17A, TGF‐β, IFN‐γ, TNF‐α and G‐CSF are significantly higher in PsO‐MSCs than in H‐MSCs. Secretion of the same cytokines is significantly lower in co‐cultured PsO‐MSCs than in individually cultured cells, reaching levels not significantly different from those of H‐MSCs. The modulation of secretion of IL‐2, a cytokine belonging to the Th2 pathway, is the opposite: lower in PsO‐MSCs than in H‐MSCs at baseline, and shows an increase after co‐cultures.
In our previous study, we evaluated the secretion of selected cytokines in PsO‐MSCs before and after 12 weeks' treatment with TNF‐α inhibitors. TNF‐α is a proinflammatory cytokine that amplifies inflammation through several distinct pathways 24, 25, 26: facilitating entry of inflammatory cells into lesional skin, through induction of adhesion molecules on vascular endothelial cells; stimulating the production of other proinflammatory mediators; and finally activating dermal macrophages and dendritic cells; inhibiting Th1/Th17 T cells. The three TNF‐α antagonists actually available for the treatment of psoriasis (infliximab, etanercept, and adalimumab) 27, even if with some differences, act by blocking and inactivating the molecule.
We have already demonstrated that the in‐vivo administration of TNF‐α inhibitors produced a decrease in IL‐6, IL‐12, IL‐17A, TNF‐α and G‐CSF, as well as an increase of IL‐2 secretion in PsO‐MSCs; similar results have been obtained by the cross‐talk between H‐MSCs and PsO‐MSCs in the co‐culture system. The paracrine effect exerted by healthy MSCs on psoriatic MSCs in vitro seems able to mimic the effect biological drug administration in vivo.
Limitations
Eleven psoriatic patients and 11 healthy subjects were enrolled into this study; even if the results from each participant of the same subgroup were very similar, the sample size should be enlarged. Moreover, all the observations derive from in‐vitro experiments and should be considered as preliminary results, and need to be confirmed by further studies focusing upon the interaction between H‐MSCs, inflammatory microenvironment and differentiated cells in vivo.
Perspectives
This study provides a molecular‐based response to the ever‐increasing evidence of the therapeutic efficacy of allogenic MSCs infusion in psoriatic patients, as reported recently in the literature 28, stimulating research into the field of stem cells for the treatment of psoriasis.
Disclosure
The authors declare no conflicts of interest.
Author contributions
A. C. and M. O. planned and co‐ordinated the project and wrote the manuscript. G. S. performed the assays. M. M. B. C. interpreted the data. V. C. provided the patient material. R. D. P. and A. O. interpreted the data and supervised the project. All authors read and approved the final manuscript. This paper has no funding source.
References
- 1. Kimball AB, Gladman D, Gelfand JM et al National Psoriasis Foundation clinical consensus on psoriasis comorbidities and recommendations for screening. J Am Acad Dermatol 2008; 58:1031–42. [DOI] [PMC free article] [PubMed] [Google Scholar]
- 2. Lowes MA, Kikuchi T, Fuentes‐Duculan J et al Psoriasis vulgaris lesions contain discrete populations of Th1 and Th17 T cells. J Invest Dermatol 2008; 128:1207–11. [DOI] [PubMed] [Google Scholar]
- 3. Coimbra S, Figueiredo A, Castro E, Rocha‐Pereira P, Santos‐Silva A. The roles of cells and cytokines in the pathogenesis of psoriasis. Int J Dermatol 2012; 51:389–98. [DOI] [PubMed] [Google Scholar]
- 4. Campanati A, Orciani M, Consales V et al Characterization and profiling of immunomodulatory genes in resident mesenchymal stem cells reflect the Th1–Th17/Th2 imbalance of psoriasis. Arch Dermatol Res 2014; 306:915–20. [DOI] [PubMed] [Google Scholar]
- 5. Lowes MA, Bowcock AM, Krueger JG. Pathogenesis and therapy of psoriasis. Nature 2007; 445:866–73. [DOI] [PubMed] [Google Scholar]
- 6. Nickoloff BJ, Xin H, Nestle FO, Qin JZ. The cytokine and chemokine network in psoriasis. Clin Dermatol 2007; 25:568–73. [DOI] [PubMed] [Google Scholar]
- 7. Campanati A, Goteri G, Simonetti O et al CTACK/CCL27 expression in psoriatic skin and its modification after administration of etanercept. Br J Dermatol 2007; 157:1155–60. [DOI] [PubMed] [Google Scholar]
- 8. Campanati A, Orciani M, Lazzarini R et al TNF‐α inhibitors reduce the pathological Th1 ‐Th17/Th2 imbalance in cutaneous mesenchymal stem cells of psoriasis patients. Exp Dermatol 2017; 26:319–24. [DOI] [PubMed] [Google Scholar]
- 9. Orciani M, Campanati A, Salvolini E et al The mesenchymal stem cell profile in psoriasis. Br J Dermatol 2011; 165:585–92. [DOI] [PubMed] [Google Scholar]
- 10. Orciani M, Gorbi S, Benedetti M et al Oxidative stress defense in human‐skin‐derived mesenchymal stem cells versus human keratinocytes: different mechanisms of protection and cell selection. Free Radic Biol Med 2010; 49:830–8. [DOI] [PubMed] [Google Scholar]
- 11. Orciani M, Sorgentoni G, Olivieri F, Mattioli‐Belmonte M, Di Benedetto G, Di Primio R. Inflammation by breast implants and adenocarcinoma: not always a bad company. Clin Breast Cancer 2017; 17:286–92. [DOI] [PubMed] [Google Scholar]
- 12. Orciani M, Sorgentoni G, Torresetti M, Di Primio R, Di Benedetto G. MSCs and inflammation: new insights into the potential association between ALCL and breast implants. Breast Cancer Res Treat 2016; 156:65–72. [DOI] [PubMed] [Google Scholar]
- 13. Dominici M, Le Blanc K, Mueller I et al Minimal criteria for defining multipotent mesenchymal stromal cells. The International Society for Cellular Therapy position statement. Cytotherapy 2006; 8:315–7. [DOI] [PubMed] [Google Scholar]
- 14. Orciani M, Lazzarini R, Scartozzi M et al The response of breast cancer cells to mesenchymal stem cells: a possible role of inflammation by breast implants. Plast Reconstr Surg 2013; 132:899e–910e. [DOI] [PubMed] [Google Scholar]
- 15. Shin TH, Kim HS, Choi SW, Kang KS. Mesenchymal stem cell therapy for inflammatory skin diseases: clinical potential and mode of action. Int J Mol Sci 2017; 18:244. [DOI] [PMC free article] [PubMed] [Google Scholar]
- 16. Uccelli A, Moretta L, Pistoia V. Mesenchymal stem cells in health and disease. Nat Rev Immunol 2008; 8:726–36. [DOI] [PubMed] [Google Scholar]
- 17. Glennie S, Soeiro I, Dyson PJ, Lam EW, Dazzi F. Bone marrow mesenchymal stem cells induce division arrest anergy of activated T cells. Blood 2005; 105:2821–7. [DOI] [PubMed] [Google Scholar]
- 18. Corcione A, Benvenuto F, Ferretti E et al Human mesenchymal stem cells modulate B cell functions. Blood 2006; 107:367–72. [DOI] [PubMed] [Google Scholar]
- 19. Zhang B, Liu R, Shi D et al Mesenchymal stem cells induce mature dendritic cells into a novel Jagged‐2‐dependent regulatory dendritic cell population. Blood 2009; 113:46–57. [DOI] [PubMed] [Google Scholar]
- 20. Sotiropoulou PA, Perez SA, Gritzapis AD et al Interactions between human mesenchymal stem cells and natural killer cells. Stem Cells 2006; 24:74–85. [DOI] [PubMed] [Google Scholar]
- 21. Murphy MB, Moncivais K, Caplan AI. Mesenchymal stem cells: environmentally responsive therapeutics for regenerative medicine. Exp Mol Med 2013; 45:e54. [DOI] [PMC free article] [PubMed] [Google Scholar]
- 22. Liu R, Wang Y, Zhao X, Yang Y, Zhang K. Lymphocyte inhibition is compromised in mesenchymal stem cells from psoriatic skin. Eur J Dermatol 2014; 24:560–7. [DOI] [PubMed] [Google Scholar]
- 23. Orciani M, Campanati A, Caffarini M et al T helper (Th)1, Th17 and Th2 imbalance in mesenchymal stem cells of adult patients with atopic dermatitis: at the origin of the problem. Br J Dermatol 2017; 176:1569–76. [DOI] [PubMed] [Google Scholar]
- 24. Tan JK, Aphale A, Malaviya R, Sun Y, Gottlieb AB. Mechanisms of action of etanercept in psoriasis. J Investig Dermatol Symp Proc 2007; 12:38–45. [DOI] [PubMed] [Google Scholar]
- 25. Yost J, Gudjonsson JE. The role of TNF inhibitors in psoriasis therapy: new implications for associated comorbidities. F1000 Med Rep 2009; 8:30. [DOI] [PMC free article] [PubMed] [Google Scholar]
- 26. Zaba LC, Cardinale I, Gilleaudeau P et al Amelioration of epidermal hyperplasia by TNF inhibition is associated with reduced Th17 responses. J Exp Med 2007; 204:3183–94. [DOI] [PMC free article] [PubMed] [Google Scholar]
- 27. Piaserico S, Cazzaniga S, Chimenti S et al Efficacy of switching between tumor necrosis factor‐alfa inhibitors in psoriasis: results from the Italian Psocare registry. J Am Acad Dermatol 2014; 70:257–62.e3. [DOI] [PubMed] [Google Scholar]
- 28. Kaffenberger BH, Wong HK, Jarjour W, Andritsos LA. Remission of psoriasis after allogeneic, but not autologous, hematopoietic stem‐cell transplantation. J Am Acad Dermatol 2013; 68:489–92. [DOI] [PubMed] [Google Scholar]