

Abstract
Background
Venous thromboembolism (VTE) epidemiology has been mainly studied in populations largely of European ancestry.
Objectives
To assess the epidemiology of VTE in immigrants to Ontario, Canada.
Patients/Methods
We conducted a population‐based retrospective cohort study using linked health‐care and administrative databases. We included 1 195 791 immigrants to Ontario and 1 195 791 nonimmigrants, matched on age, sex, and place of residence. The main exposure was ethnicity according to world region of origin, using a previously validated algorithm. The main outcome was incident onset of VTE during the period of observation. Risk ratios (RR) were calculated using Poisson regression models.
Results
The incidence rate (IR) of VTE was lower among immigrants (0.87 per 1000 PY; 95% confidence interval [CI] 0.85‐0.89) than nonimmigrants (1.59 per 1000 PY; 95% CI 1.56‐1.61). Age‐ and sex‐standardized IR were lower among East and South Asian immigrants. Compared to immigrants for predominantly White regions, age‐ and sex‐specific RRs were consistently lower for East Asian (0.18‐0.30) and South Asian (0.29‐0.75) immigrants. In contrast, the RRs of VTE among Black (0.38‐1.50), Latin American (0.29‐1.25), Arab/Middle Eastern (0.44‐1.08) and West Asian (0.31‐1.16) immigrants were not significantly different from White immigrants.
Conclusions
In Ontario, the incidence of VTE is lower among immigrants compared to nonimmigrants. East and South Asian immigrants have a lower risk of VTE compared to White immigrants.
Keywords: cohort, epidemiology, ethnicity, observational, venous thromboembolism
Essentials.
Venous thromboembolism (VTE) epidemiology has been mainly studied in European populations.
We conducted a population‐based retrospective cohort study in immigrants to Ontario, Canada.
The incidence rate (IR) of VTE was lower among immigrants than nonimmigrants.
East and South Asian immigrants had a lower VTE risk than those from predominantly White regions.
1. INTRODUCTION
Venous thromboembolism (VTE), comprising deep vein thrombosis (DVT) and pulmonary embolism (PE), affects approximately 30 000‐60 000 patients in Canada every year and up to 10 000 of them will die from it.1 The epidemiology of VTE has been largely studied in populations from European descent, with much less known among people from other regions. It is conceivable that differences may exist in either the biological predisposition to VTE, such as varying rates of inheritable thrombophilia and obesity, or in the frequency of temporary risk factors for VTE, such as surgery, immobility, or cancer.
To date, little is known about the epidemiology of VTE among immigrants and in relation to ethnicity or place of origin. Canada is a relatively young country, and immigrants born outside of Canada comprise about 21% of the entire population.2 In Canada’s largest province—Ontario—the proportion is about 30%. Thus, Ontario provides an ideal setting to evaluate ethnicity and immigration as related to the risk of VTE.
A better understanding of this issue could enable the development of focused preventative strategies and interventions across ethnically diverse populations. If certain groups have lower incidence rates of VTE, it might be appropriate to consider this when conducting studies assessing VTE risk, thromboprophylaxis, anticoagulant treatment, or diagnostic strategies. This is important since it could result in reduction of health‐care costs and risk of complications derived from unnecessary treatments.
Herein, we: (i) investigated the overall incidence of VTE in immigrants to Ontario, Canada and compared it to nonimmigrants and, (ii) generated estimates of the incidence of VTE in immigrants to Ontario, grouped by their world geographical region of origin, and estimated relative risks for different immigrant groups compared to immigrants from predominantly White countries.
2. METHODS
2.1. Study design and setting
We conducted a population‐based retrospective matched cohort study using linked health‐care and administrative databases in Ontario, comprising approximately 13 million residents.3 In Ontario, residents have universal access to hospital and physician services. The study was conducted at the Institute for Clinical Evaluative Sciences (ICES) according to a prespecified protocol and approved by the research ethics board at Sunnybrook Health Sciences Centre, Toronto, Canada.
2.2. Data sources
We obtained data on patient characteristics, covariates, and outcomes using records from the linked databases. The datasets were linked using unique encoded identifiers and analyzed at ICES. The Ontario Registered Persons Database contains demographic and vital statistics information on all Ontario residents. The Citizenship and Immigration Canada (CIC) database contains information on all immigrants to Canada, starting in 1985, including date of landing, country of origin, and language spoken. The Canadian Institute for Health Information Discharge Abstract Database (CIHI‐DAD) and the Ontario Health Insurance Plan (OHIP) Database contains diagnostic and procedural information on all inpatient and outpatient physician services, respectively. The National Ambulatory Care Reporting System contains information on all emergency room visits. The Ontario Drug Benefit Plan database contains highly accurate records of all outpatient prescriptions dispensed to patients aged 65 or older, with an error rate of less than 1%.4 Finally, the MOMBABY database contains information on all women who have given birth in Ontario since 1988. The databases were complete for all variables used in this study. Both International Classification of Diseases 9th revision (ICD‐9) (pre‐2002) and 10th revision (ICD‐10) (post‐2002) codes were used to define outcomes and baseline comorbidities.
2.3. Patients
The immigrant cohort comprised residents of Ontario, identified in the CIC database, and whose landing date was between January 1, 2000 and December 31, 2010. The index date for the assessment of VTE (i.e, the start of follow‐up or “time zero”) was set at 182 days after the immigrant landing date, to account for the mandatory 3‐month waiting time to obtain universal OHIP health coverage, and further allow for a 3‐month lookback period for preexisting comorbidities. The nonimmigrant cohort comprised all residents of Ontario not found within the CIC immigrant database from 1985 and onward. Hence, for each person in the immigrant cohort, we 1:1 hard matched, without replacement, a nonimmigrant cohort member, with matching based on age at the index date ±12 months, sex, and place of residence within the same Locally Health Integrated Network (LHIN) (http://www.lhins.on.ca/). Thus, each matched pair had the same index date set for the subsequent development of VTE.
A person was excluded from either cohort if they had missing information about date of birth or sex, died prior to or on the index date, was no longer a resident of Ontario, or had a VTE during the 3‐month lookback period.
2.4. Study variables
Data were obtained about age, sex, country of origin, date of immigration, neighborhood median household income, urban or rural residence, and comorbidities captured between 3 months prior to the index date up to the end of the observation period.
The main study exposure of interest was an individual’s region of origin as a proxy to ethnicity, using an algorithm based on the individual’s country of origin in the CIC database (Figure 1 and Supplementary Table S1). A previous study validated this algorithm using self‐reported ethnicity from population health surveys showing high positive predictive values (PPV; >0.7 for most groups except Latin America and West Asia for which the PPV were 0.64 and 0.59, respectively).5 The algorithm excludes a small number of countries with very small numbers of immigrants. The following immigrant groups were created, accordingly: (i) White, (ii) Black, (iii) Latin American, (iv) Arab/Middle Eastern, (v) East Asian (including China, Japan, Korea, Philippines, and other South East Asian countries), (vi) South Asian, and (vii) West Asian.
Figure 1.
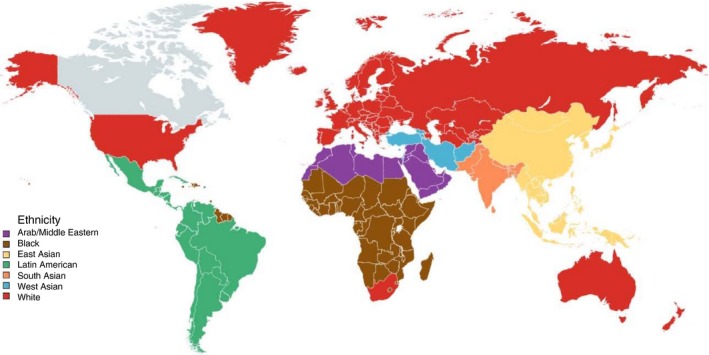
Geographic distribution of ethnicities as defined in the study
We assessed for comorbidities in the OHIP database between 3 months prior to the index date up to the end of the observation period, including coronary heart disease, heart failure, cerebrovascular disease, chronic kidney disease, diabetes mellitus, and peripheral arterial disease. Information on hospitalizations was obtained from the CIHI‐DAD database also using ICD 9 and 10 codes, as well as individual codes from the Canadian Classification of Procedures and the Canadian Classification of Interventions. Variable definitions are shown in Supplementary Table S2.
2.5. Study outcomes
The primary study outcome was the incident onset of VTE during the period of observation. A VTE diagnosis was based on a sensitive algorithm, as follows: (i) for a diagnosis of VTE as an outpatient, we required a combination of an OHIP Database diagnostic code for either DVT or PE and an OHIP fee code for leg ultrasound, ventilation‐perfusion lung scan, or computed tomography pulmonary angiography—each within ±7 days of the other, or (ii) for inpatients, we required a combination of CIHI‐DAD hospital discharge diagnosis of either DVT or PE and a diagnostic test procedure code in the same hospitalization. These algorithms have been previously validated in Canada (for both ICD 9 and 10 codes) with adequate sensitivity (>75%) and specificity (>90%)6, 7 (Supplementary Table S3). The date of the VTE event was based on the first date in which a VTE diagnosis was recorded.
Secondary study outcomes included: (i) a first DVT, or (ii) a first PE. We also determined the proportion of patients with any VTE who had a transient or malignancy‐based antecedent risk factor. For a transient antecedent risk factor, we evaluated whether any of the following conditions occurred in the 91‐day period prior to the first VTE event: (i) a vaginal or Caesarean obstetrical delivery, (ii) a hospitalization for more than 3 days, or (iii) a lower limb fracture or immobilization. For antecedent cancer, we assessed for a diagnosed malignancy in the 182‐day period prior to the first VTE event, considering cancer of the lung, colon or rectum, pancreas, esophagus, stomach, brain, lymphoma or leukemia, multiple myeloma, bladder, kidney, prostate, breast, liver and biliary tract, or melanoma.
2.6. Statistical analysis
We calculated age‐ and sex‐specific incidence rates per 1000 person‐years for each immigrant group as well as nonimmigrants. Each matched participant (immigrant‐nonimmigrant pairs) was followed from the index date (set as time zero) until the date of diagnosis of either a DVT or PE or the occurrence of any of the following: (i) emigration from Ontario, (ii) death, or (iii) end of study follow‐up, set at December 31, 2014. Due to the possibility of confounding from differential age migration patterns among groups, we also calculated age‐standardized IRs per 1000 person‐years of observation for each immigrant group. IRs were standardized to the Ontario 2011 census population,8 by calculating a weight for each age group as a proportion of the total province population. The overall age‐standardized IR was obtained from the sum product of the weighted IRs. Baseline characteristics were compared between all immigrants and nonimmigrant groups using standardized differences, a measure of clinically important differences considered significant when greater than 10%.9 We calculated 95% confidence intervals (CI) for proportions using the Wilson score method.10 Since ethnicity was not available for nonimmigrants, we limited the subgroup analysis only to immigrants. Therein, risk ratios (RR) and 95% CI were calculated using Poisson regression models with robust error variance, comparing each immigrant group to predominantly White immigrants who served as the referent. We performed all analyses using SAS 9.3 (SAS Institute Inc., Cary, NC, USA). All counts of 5 or less were suppressed.
3. RESULTS
3.1. Population characteristics
Between January 1, 2000 and December 31, 2010 there were 1 374 135 immigrants landed to Ontario. After applying the exclusion criteria, the final immigrant cohort comprised 1 195 791 children and adults, with the same number of matched nonimmigrants (Table 1). The total period of observation for both immigrants and nonimmigrants was over 17 000 000 person‐years. The annual number of immigrants included was generally consistent during the study period, and only 0.6% of immigrants were excluded based on the ethnicity algorithm country exclusions. The process for cohort integration is shown in Supplementary Figure S1.
Table 1.
Characteristics of included population divided per immigrant status
| Characteristic | NonimmigrantsN = 1 195 791 | All ImmigrantsN = 1 195 791 |
|---|---|---|
| Age, mean (SD) | 30.4 (16.5) | 30.4 (16.5) |
| Male sex, N (%) | 574 898 (48.1) | 574 898 (48.1) |
| Follow up time in years, mean (SD) | 7.6 (3.2) | 6.8 (3.6)a |
| Person‐years of observation | 9 071 171.7 | 8 078 327.9a |
| Urban residence, N (%) | 1 136 836 (95.1) | 1 185 111 (99.1)a |
| Distribution by age groups, N (%) | ||
| 0‐19 y | 316 498 (26.5) | 316 293 (26.5) |
| 20‐29 y | 255 873 (21.4) | 256 025 (21.4) |
| 30‐39 y | 317 806 (26.6) | 318 201 (26.6) |
| 40‐49 y | 165 891 (13.9) | 165 559 (13.8) |
| 50‐59 y | 68 898 (5.8) | 68 879 (5.8) |
| 60‐69 y | 46 832 (3.9) | 46 881 (3.9) |
| 70‐79 y | 20 167 (1.7) | 20 119 (1.7) |
| ≥80 y | 3826 (0.3) | 3835 (0.3) |
| Income quintile, N (%) | ||
| 1st (Lowest) | 203 143 (17) | 451 190 (37.7)a |
| 2nd | 226 922 (19) | 275 693 (23.1) |
| 3rd | 244 879 (20.5) | 204 471 (17.1) |
| 4th | 260 545 (21.8) | 155 604 (13)a |
| 5th (Highest) | 260 302 (21.8) | 108 834 (9.1)a |
| Comorbidities, N (%) | ||
| Chronic kidney disease | 17 067 (1.4) | 13 816 (1.2) |
| Coronary artery disease | 53 846 (4.5) | 50 303 (4.2) |
| Diabetes | 104 822 (8.8) | 138 189 (11.6) |
| Peripheral vascular disease | 2509 (0.2) | 918 (0.1) |
| Heart failure | 17 082 (1.4) | 12 259 (1) |
| Cerebrovascular disease | 4607 (0.4) | 3151 (0.3) |
Standardized difference >0.10 compared to the nonimmigrants group.
Overall, the population included was young (mean age 30.4 years), and 48% were male (Tables 1 and 2). The predominant immigrant groups were South Asians and East Asians. In comparison with nonimmigrants, more immigrants tended to reside in first or second income quintile areas. No other differences were observed for sex, age distribution or comorbidities.
Table 2.
Characteristics of immigrant population divided by group
| Characteristic | WhiteN = 194 203 | BlackN = 109 819 | Latin American N = 77 348 | Arab/Middle Eastern N = 91 616 | East AsianN = 304 198 | South AsianN = 345 668 | West AsianN = 72 939 |
|---|---|---|---|---|---|---|---|
| Age, mean (SD) | 30.5 (17.8) | 29 (15.2) | 30.7 (15.1) | 25.9 (17) | 32 (15.9) | 30.3 (16.6) | 30.6 (16.5) |
| Male sex, N (%) | 93 803 (48.3) | 53 335 (48.6) | 36 067 (46.6) | 46 727 (51) | 135 471 (44.5) | 172 793 (50) | 36 702 (50.3) |
| Follow up time in years, mean (SD) | 6.9 (3.7) | 6.5 (3.5) | 6.4 (3.4) | 6.2 (3.4) | 6.7 (3.6) | 7 (3.5) | 6.9 (3.5) |
| Person‐years of observation | 1 347 931.8 | 716 906 | 495 137.2 | 564 508.9 | 2 041 483.5 | 2 407 247.7 | 505 113.0 |
| Urban residence, N (%) | 187 290 (96.4) | 109 331 (99.6) | 76 392 (98.8) | 91 414 (99.8) | 302 972 (99.6) | 344 884 (99.8) | 72 827 (99.9) |
| Distribution by age groups, N (%) | |||||||
| 0‐19 y | 54 803 (28.2) | 32 101 (29.2) | 18 769 (24.3) | 37 034 (40.4) | 68 068 (22.4) | 86 009 (24.9) | 19 509 (26.8) |
| 20‐29 y | 35 938 (18.5) | 25 007 (22.8) | 17 524 (22.7) | 15 867 (17.3) | 60 152 (19.8) | 85 574 (24.8) | 15 963 (21.9) |
| 30‐39 y | 51 591 (26.6) | 28 119 (25.6) | 21 020 (27.2) | 19 673 (21.5) | 92 486 (30.4) | 87 440 (25.3) | 17 872 (24.5) |
| 40‐49 y | 27 435 (14.1) | 15 132 (13.8) | 11 729 (15.2) | 11 306 (12.3) | 47 880 (15.7) | 41 704 (12.1) | 10 373 (14.2) |
| 50‐59 y | 10 706 (5.5) | 5297 (4.8) | 5204 (6.7) | 4149 (4.5) | 15 118 (5) | 23 506 (6.8) | 4899 (6.7) |
| 60‐69 y | 7767 (4) | 2597 (2.4) | 2167 (2.8) | 2355 (2.6) | 13 721 (4.5) | 15 453 (4.5) | 2821 (3.9) |
| 70‐79 y | 4523 (2.3) | 1298 (1.2) | 759 (1) | 1059 (1.2) | 6070 (2) | 5152 (1.5) | 1258 (1.7) |
| ≥80 y | 1440 (0.7) | 268 (0.2) | 176 (0.2) | 173 (0.2) | 703 (0.2) | 830 (0.2) | 244 (0.3) |
| Income quintile, N (%) | |||||||
| 1st (Lowest) | 58 436 (30.1) | 53 213 (48.5) | 27 076 (35) | 34 533 (37.7) | 102 786 (33.8) | 148 317 (42.9) | 26 829 (36.8) |
| 2nd | 37 930 (19.5) | 24 119 (22) | 18 833 (24.4) | 18 823 (20.6) | 78 668 (25.9) | 83 720 (24.2) | 13 600 (18.7) |
| 3rd | 31 995 (16.5) | 16 299 (14.8) | 13 290 (17.2) | 16 339 (17.8) | 53 575 (17.6) | 60 816 (17.6) | 12 156 (16.7) |
| 4th | 32 717 (16.9) | 10 676 (9.7) | 10 565 (13.7) | 13 340 (14.6) | 40 362 (13.3) | 36 134 (10.5) | 11 810 (16.2) |
| 5th (highest) | 33 125 (17.1) | 5512 (5) | 7584 (9.8) | 8581 (9.4) | 28 807 (9.5) | 16 681 (4.8) | 8544 (11.7) |
| Comorbidities, N (%) | |||||||
| Chronic kidney disease | 1999 (1) | 1609 (1.5) | 805 (1) | 803 (0.9) | 3066 (1) | 4833 (1.4) | 701 (1) |
| Coronary artery disease | 8344 (4.3) | 3698 (3.4) | 2612 (3.4) | 2775 (3) | 8636 (2.8) | 20 799 (6) | 3439 (4.7) |
| Diabetes | 13 489 (6.9) | 12 611 (11.5) | 7122 (9.2) | 7827 (8.5) | 29 098 (9.6) | 60 757 (17.6) | 7285 (10) |
| Peripheral vascular disease | 293 (0.2) | 94 (0.1) | 48 (0.1) | 72 (0.1) | 151 (0) | 191 (0.1) | 69 (0.1) |
| Heart failure | 2642 (1.4) | 1222 (1.1) | 637 (0.8) | 844 (0.9) | 1917 (0.6) | 4114 (1.2) | 883 (1.2) |
| Cerebrovascular disease | 673 (0.3) | 327 (0.3) | 190 (0.2) | 145 (0.2) | 733 (0.2) | 903 (0.3) | 180 (0.2) |
3.2. Study outcomes
3.2.1. Incidence rates for venous thromboembolism among immigrants compared to nonimmigrants
The age‐specific incidence rates for VTE are shown in Table 3 and those for DVT and PE In Supplementary Table S4. Overall, for both immigrants and nonimmigrants the incidence rate for any VTE during the study period was 1.25 per 1000 person‐years (95% CI 1.23‐1.27). The IR for VTE was lower among immigrants (0.87 per 1000 person‐years; 95% CI 0.85‐0.89) than among nonimmigrants (1.59 per 1000 person‐years; 95% CI 1.56‐1.61). Similarly, the IRs for DVT and PE were lower among immigrants than among nonimmigrants (Supplementary Table S4). These differences were consistent across all age groups and overall, IR was higher among women (IR 1.41 per 1000 person‐years; 95% CI 1.38‐1.43) than men (IR 1.08 per 1000 person‐years; 95% CI 1.06‐1.10). When excluding people younger than 20 years of age, the IR for VTE was 1.64 per 1000 person‐years (95% CI 1.62‐1.67).
Table 3.
Venous thromboembolic events and age‐stratified incidence rates in all immigrants and nonimmigrantsa
| Age group | All Immigrants | Nonimmigrants | ||||||
|---|---|---|---|---|---|---|---|---|
| Number of events | Person‐years of observation | Incidence rate per 1000 person years | 95% CI | Number of events | Person‐years of observation | Incidence rate per 1000 person years | 95% CI | |
| 0‐19 | 366 | 2 219 907 | 0.16 | 0.15‐0.18 | 602 | 2 483 781 | 0.24 | 0.22‐0.26 |
| 20‐29 | 1094 | 1 707 392 | 0.64 | 0.6‐0.68 | 2037 | 1 931 858 | 1.05 | 1.01‐1.1 |
| 30‐39 | 1654 | 2 175 699 | 0.76 | 0.72‐0.8 | 3549 | 2 468 565 | 1.44 | 1.39‐1.49 |
| 40‐49 | 1295 | 1 113 382 | 1.16 | 1.1‐1.23 | 2777 | 1 231 682 | 2.25 | 2.17‐2.34 |
| 50‐59 | 865 | 446 152 | 1.94 | 1.81‐2.07 | 1747 | 488 171 | 3.58 | 3.42‐3.75 |
| 60‐69 | 1001 | 292 128 | 3.43 | 3.22‐3.65 | 2146 | 326 076 | 6.58 | 6.31‐6.86 |
| 70‐79 | 588 | 106 419 | 5.53 | 5.1‐5.99 | 1278 | 122 408 | 10.44 | 9.89‐11.03 |
| ≥80 | 172 | 17 250 | 9.97 | 8.59‐11.57 | 264 | 18 630 | 14.17 | 12.57‐15.97 |
| Total (All age groups) | 7035 | 8 078 328 | 0.87 | 0.85‐0.89 | 14,400 | 9 071 172 | 1.59 | 1.56‐1.61 |
| Total (≥20 y old) | 6669 | 5 858 422 | 1.14 | 1.11‐1.17 | 13,798 | 6 587 390 | 2.09 | 2.06‐2.13 |
CI, confidence interval.
Patients were censored at the time of the first event.
3.2.2. Venous thromboembolism among immigrants
Given the potential confounding from differential immigration age patterns, we calculated sex‐ and age‐standardized IR for all immigrant groups (Figure 2). For males and females the lowest IRs were observed among East Asian and South Asian immigrants, whereas the highest IRs were seen in White and Black immigrants and were higher among women compared to men. Findings were consistent with the age‐stratified IR for all groups (Supplementary Figures S2 and S3) and for all immigrant groups there was a clear increase in the IR of VTE associated with age. The age‐standardized and age‐stratified IRs separated by DVT and PE are presented in Supplementary Tables S5‐S7.
Figure 2.

Age‐standardized Incidence rates and 95% confidence intervals of venous thromboembolism for male and female immigrants divided by immigrant group
Compared to immigrants from predominantly White regions, the age‐specific RRs were consistently lower for both men and women of East Asian and South Asian origin (Figures 3 and 4). For East Asians, the RRs ranged by age groups, from 0.18 to 0.30, whereas, for South Asians, the RRs ranged from 0.29 to 0.75. For patients of West Asian and Arab/Middle Eastern ethnicity, the age‐specific RRs were also generally lower, except those under age 30 years or over age 80 years old. In contrast, the RRs for immigrants of Black and Latin American origin did not significantly differ from that of predominantly White immigrants, except for Black women aged 20‐40 years (Figure 4).
Figure 3.

Venous thromboembolism risk ratios and 95% confidence intervals for male immigrants to Ontario divided by geographically defined ethnic group, compared to White immigrants within the same age group
Figure 4.

Venous thromboembolism risk ratios and 95% confidence intervals for female immigrants to Ontario divided by geographically defined ethnic group, compared to White immigrants within the same age group
3.2.3. Prevalence of risk factors among patients developing venous thromboembolism
Among those who developed a VTE event, we determined the prevalence of antecedent VTE risk factors. Among all immigrants who developed a VTE, a slightly higher proportion had a previous hospitalization or birth, compared to nonimmigrants (Table 4). Among immigrants, those of Black, Arab/Middle Eastern, and South Asian origin had a higher prevalence of a recent birth compared to Whites (Supplementary Table S8). In contrast, immigrants from Latin America had a lower prevalence of a previous cancer compared to White immigrants.
Table 4.
Prevalence of risk factors in patients developing a VTE event among immigrants and nonimmigrants
| Risk factor | Immigrants with VTE (N = 7035) | Nonimmigrants with VTE (N = 14,400) | Standardized difference |
|---|---|---|---|
| Hospitalized for more than 3 d in the 91‐d period preceding the diagnosis of VTE, N (%) | 855 (12) | 1250 (9) | 0.11 |
| Fracture in the 91‐d period preceding the diagnosis of VTE, N (%) | 260 (4) | 502 (3) | 0.01 |
| Vaginal or Caesarean birth in the 91‐d period preceding the diagnosis of VTE, N (%) | 240 (6)a | 266 (3)a | 0.12 |
| Major cancer in the 6‐mo period preceding the diagnosis of VTE, N (%) | 604 (9) | 1342 (9) | 0.03 |
VTE, venous thromboembolism.
All data are presented as a number (%). See additional data in Supplementary Table S8.
As a percentage of all women with venous thromboembolism.
4. DISCUSSION
The present study is, to the best of our knowledge, the largest evaluation of VTE in immigrants in North America and the one including the largest number of geographically defined ethnic groups. We generated contemporary estimates of the IR and RR of VTE, finding that immigrants of East Asian and South Asian origin are at lower risk of VTE compared to immigrants from predominantly White regions. We also provide previously unavailable data about VTE incidence among immigrants of Latin American, West Asian, and Arab/Middle Eastern origin.
This study has several strengths. First, we included over 2.2 million people with over 17 000 000 person‐years of observation using comprehensive data linked from province‐wide and federal administrative databases. We used a previously validated algorithm for identifying VTE events6, 7 and our overall IR for VTE is virtually identical to that reported in two recent Canadian studies in Quebec and Alberta.11, 12 We used a validated algorithm to determine ethnicity5 and since Ontario has universal health coverage, with access to diagnostic testing and clinical care for all, it is unlikely that ascertainment of VTE differed between ethnic groups. Additionally, in general there is a high awareness of VTE among medical practitioners, reducing the possibility of recall bias. To assess the contribution of ethnicity defined by region of origin on the epidemiology of VTE, we used the immigrant population only and assessed the RR of VTE with White immigrants serving as the reference group for several reasons. First, a significant proportion of nonimmigrants in Ontario are of non‐White ancestry, especially among younger age groups. This information is not available in the administrative databases. Second, immigrants to Canada undergo mandatory health screening which could potentially select healthier individuals than nonimmigrants, the so‐called “healthy immigrant effect” which has been described in different settings.13 Thus, using the nonimmigrant population as comparator is not appropriate.
Potential limitations to this study relate mainly to two issues: (i) the potential for confounding and misclassification which is inherent to all observational studies, and (ii) the potential for statistical errors derived from multiple comparisons. The use of administrative databases is by its mere nature subject to many limitations including the possibility of data inaccuracy, the lack of potentially relevant clinical variables, or other potentially unrealized confounders. Thus, the use of properly validated diagnostic algorithms becomes essential. Therefore, in this study we used algorithms comprising both diagnostic and procedural codes (i.e, imaging studies codes) with appropriate sensitivity and specificity to try to decrease the possibility of misclassification.6, 7, 14 In spite of this, there is a possibility that a number of patients might have been missed or erroneously included. Also, we cannot exclude the possibility that differences observed among ethnic groups may be at least partly related to other unavailable data such as body mass index, tobacco use, or physical activity. Another important limitation is the possibility of misclassification of ethnicity since a few countries such as the United States and South Africa were included among the White immigrants group. Given the ethnic heterogeneity of these countries, it is possible that immigrants from these and other countries might have been classified in an erroneous group. In this regard however, the concept of ethnicity used in this work should be conceived mainly from a geographical perspective (i.e, ethnic group) rather than a biological one (i.e, race).15 Also, the individual contributions of specific countries to the total pool of immigrants is small, including those countries whose inclusion in certain ethnic groups might be contentious and thus the effect on the overall estimates is low, and in any case the ethnicity algorithm used has a very high PPV for several ethnic groups, including Whites and Blacks.5 An additional limitation is the lack of information regarding the time interval between immigration and the occurrence of VTE as well as the time set as the index date used for immigrants which was 182 days after landing. This was however, necessary due to: (i) the mandatory 3‐month lag between immigration and the initiation of provincial health coverage, (ii) the need to have a period to capture comorbidities, and (iii) the possibility that including events captured in this period might reflect the existence of prevalent rather than incident VTE. It could also be argued that long travel might result in a higher likelihood of VTE among immigrants, especially during the period immediately following their landing. In this regard, although long‐distance travel has been reported to slightly increase the risk of VTE such risk is difficult to measure due to the lack of proper follow‐up in travelers.16 However, two well‐conducted studies in captive populations have shown that the absolute IR of VTE does not seem to differ from that in general population.17, 18 Nevertheless, there is a possibility that immigrants might have developed VTE events during this period that would not have been captured, but because of the aforementioned reasons we believe that it is unlikely that a significant number of events were missed. In any case such limitation would apply to all immigrant groups and it would have very little effect on the risk ratios.
Finally, due to the inclusion of multiple ethnic groups, comparison of characteristics between all ethnic groups poses the problem of multiple comparisons, and our sample size would be underpowered to obtain robust results. Because of this reason, we chose to present differences in predisposing risk factors between different immigrant groups restricted to those patients developing VTE (Table 4 and Supplementary Table S8) to inform of these potential differences. We found a higher prevalence of recent birth in Black, Arab/Middle Eastern, and South Asian women with VTE compared to that among White immigrants. Additionally, whereas Arab/Middle Eastern and South Asian immigrants had a lower IR of VTE than White women, those of Black ethnicity had a higher risk of VTE. Also, differences in personal or cultural attitudes to medicine and medical problems as approached in Canada, could potentially result in different patterns or behaviors among immigrants for seeking medical attention. Unfortunately, this is difficult to measure and, although it could potentially result in underreporting of VTE, we believe that it is unlikely given that the prevalence of other comorbidities is similar to, or higher than, those among nonimmigrants, suggesting that both immigrants and nonimmigrants seek medical attention in a similar way.
Finally, whereas genetic factors for VTE have been studied somewhat extensively,19 the effect of environmental factors is much less understood. Studies conducted in Canada and the United States have found that immigration modifies the risk factor profile for many conditions in people from other countries, and that this is a time‐dependent effect. Recent studies found higher risk of premature stroke and myocardial infarction in long term residents of Ontario compared to recent immigrants20, 21 and others showed that a longer time of residency in Canada and acculturation resulted in higher proportions of cardiovascular risk factors, including obesity, among different immigrant groups.22, 23 However, the effect of immigration on VTE has not been studied. Given that some studies have shown that cardiovascular risk factors are associated with an increased risk of VTE24 it is possible that immigration might have an effect on VTE by modifying either the cardiovascular risk profile or other factors. Furthermore, these effects could be different among people from different ethnic origin. In this regard, since we considered a similar observation period for all immigrants, and since the total observation for each person was relatively short, we believe that it is unlikely that the process of acculturation affected our observations.
Venous thromboembolism has been considered a disease affecting predominantly White populations.25 However, in recent years, many studies have been done among a small number of ethnic groups.26, 27, 28, 29, 30, 31, 32, 33, 34 In general, Asians and Native Americans tended to have the lowest incidence of VTE,26, 35, 36, 37, 38, 39 whereas several studies mainly conducted in the United States have shown a higher VTE incidence in Blacks.39, 40, 41 In this study we found a similar IR among immigrants from predominantly Black countries compared to White immigrants. This could potentially be explained, at least in part by differences in diet, body mass index and other variables between immigrants to Canada compared to United States residents, or by potential differences in recently described genetic markers for VTE in this group.19, 42 Until now, the burden of VTE was virtually unknown among groups of Latin America, Middle Eastern, African, or South Asian ancestry, with only a Swedish study evaluating a relatively small number of immigrants, mainly by country of origin.43 Such study, reported similar findings to ours albeit limited by quite small number of immigrants from several regions. Hence, the present study provides very valuable information in these populations. We confirmed that immigrants from South Asian and East Asian ethnicity have the lowest risk of VTE compared to White immigrants. Nonetheless, that risk is far from negligible, particularly among the elderly and confirms the previously known fact that the IR of VTE increases with age.44 Accordingly, activities aiming to increase the awareness of this disease are justified for all ethnicities. Furthermore, given the lower risk found among the aforementioned groups, it may be necessary to adjust or validate clinical prediction models for VTE diagnosis or recurrence in such groups.
In conclusion, this is the largest study conducted to date evaluating concurrently the risk of VTE in immigrants in America from seven different geographically defined ethnic groups. We found an overall lower risk of VTE among immigrants compared to nonimmigrants and significantly lower risk among immigrants from South Asian and East Asian origin. Further studies evaluating the reasons for these discrepancies are warranted.
RELATIONSHIP DISCLOSURE
This study was supported by the Institute for Clinical Evaluative Sciences (ICES), which is funded by an annual grant from the Ontario Ministry of Health and Long‐Term Care (MOHLTC). Core funding for ICES Western is provided by the Academic Medical Organization of South Western Ontario (AMOSO), the Schulich School of Medicine and Dentistry (SSMD), Western University and the Lawson Health Research Institute (LHRI). The opinions, results and conclusions reported in this paper are those of the authors and are independent from the funding sources. No endorsement by ICES, AMOSO, SSMD, LHRI, or the Ontario MOHLTC is intended or should be inferred. Dr. Lazo‐Langner was supported for this study by a grant from the Academic Medical Organization of South Western Ontario (AMOSO) Opportunities fund and by the Institute for Clinical Evaluative Sciences Western Faculty Scholars program. Parts of this material are based on data and information compiled and provided by the Canadian Institute of Health Information (CIHI). However, the analyses, conclusions, opinions and statements expressed herein are those of the authors, and not necessarily those of CIHI. Access to additional material should be addressed to the corresponding author.
AUTHOR CONTRIBUTIONS
AL‐L conceived the study. AL‐L, AXG, and JR designed the study. KL and SS extracted data. AL‐L, KL, and SS analyzed data. AL‐L wrote the initial manuscript draft. AL‐L, KL, SS, AXG, and JR edited and approved the final manuscript. Authors assume the responsibility for the accuracy and integrity of the data and analyses.
Supporting information
Lazo‐Langner A, Liu K, Shariff S, Garg AX, Ray JG. Immigration, region of origin, and the epidemiology of venous thromboembolism: A population‐based study. Res Pract Thromb Haemost. 2018;2:469–480. 10.1002/rth2.12113
REFERENCES
- 1. Beckman MG, Hooper WC, Critchley SE, Ortel TL. Venous thromboembolism: a public health concern. Am J Prev Med. 2010;38(4 Suppl):S495–501. [DOI] [PubMed] [Google Scholar]
- 2. Statistics Canada . Immigration and ethnocultural diversity in Canada. In: National Household Survey 2011. 2011. [cited 2018 Apr 21] Available from http://www12.statcan.gc.ca/nhs-enm/2011/as-sa/99-010-x/99-010-x2011001-eng.pdf
- 3. Statistics Canada . Estimates of population, by age group and sex. In: Canadian Socioeconomic Database. 2013. [cited 2018 Apr 21] Available from http://www12.statcan.gc.ca/census-recensement/index-eng.cfm
- 4. Levy AR, O’Brien BJ, Sellors C, Grootendorst P, Willison D. Coding accuracy of administrative drug claims in the Ontario Drug Benefit database. Can J Clin Pharmacol. 2003;10:67–71. [PubMed] [Google Scholar]
- 5. Rezai MR, Maclagan LC, Donovan LR, Tu JV. Classification of Canadian immigrants into visible minority groups using country of birth and mother tongue. Open Med. 2013;7:e85–93. [PMC free article] [PubMed] [Google Scholar]
- 6. Alotaibi GS, Wu C, Senthilselvan A, McMurtry S. The validity of ICD codes coupled with imaging procedure codes for identifying acute venous thromboembolism events using administrative data. Vascular Med. 2015;20:364–8. [DOI] [PubMed] [Google Scholar]
- 7. Tagalakis V, Kahn SR. Determining the test characteristics of claims‐based diagnostic codes for the diagnosis of venous thromboembolism in a medical service claims database. Pharmacoepidemiol Drug Saf. 2011;20:304–7. [DOI] [PubMed] [Google Scholar]
- 8. Statistics Canada . Age (in Single Years) and Average Age (127) and Sex (3) for the Population of Canada, Provinces and Territories, Census Metropolitan Areas and Census Agglomerations, 2016 and 2011 Censuses ‐ 100% Data. In: 2016 Census Population. Catalogue No. 98‐400‐X2016001;2016. [cited 2018 Apr 21] Available from http://www12.statcan.gc.ca/census-recensement/index-eng.cfm
- 9. Austin PC. Using the standardized difference to compare the prevalence of a binary variable between two groups in observational research. Commun Stat Simul Comput. 2009;38:1228–34. [Google Scholar]
- 10. Newcombe RG. Two‐sided confidence intervals for the single proportion: comparison of seven methods. Stat Med. 1998;17:857–72. [DOI] [PubMed] [Google Scholar]
- 11. Alotaibi GS, Wu C, Senthilselvan A, McMurtry MS. Secular trends in incidence and mortality of acute venous thromboembolism: the AB‐VTE population based study. Am J Med. 2016;129:879.e819–79. [DOI] [PubMed] [Google Scholar]
- 12. Tagalakis V, Patenaude V, Kahn SR, Suissa S. Incidence of and mortality from venous thromboembolism in a real‐world population: the Q‐VTE Study Cohort. Am J Med. 2013;126:832–821. [DOI] [PubMed] [Google Scholar]
- 13. Vang ZM, Sigouin J, Flenon A, Gagnon A. Are immigrants healthier than native‐born Canadians? A systematic review of the healthy immigrant effect in Canada. Ethn Health. 2017;22:209–41. [DOI] [PubMed] [Google Scholar]
- 14. Ray JG, Mamdani M, Tsuyuki RT, Anderson DR, Yeo EL, Laupacis A. Use of statins and the subsequent development of deep vein thrombosis. Arch Intern Med. 2001;161:1405–10. [DOI] [PubMed] [Google Scholar]
- 15. Lin SS, Kelsey JL. Use of race and ethnicity in epidemiologic research: concepts, methodological issues, and suggestions for research. Epidemiol Rev. 2000;22:187–202. [DOI] [PubMed] [Google Scholar]
- 16. Chandra D, Parisini E, Mozaffarian D. Meta‐analysis: travel and risk for venous thromboembolism. Ann Intern Med. 2009;151:180–90. [DOI] [PubMed] [Google Scholar]
- 17. Kuipers S, Venemans‐Jellema A, Cannegieter SC, et al. The incidence of venous thromboembolism in commercial airline pilots: a cohort study of 2630 pilots. J Thromb Haemost. 2014;12:1260–5. [DOI] [PubMed] [Google Scholar]
- 18. Isenbarger DW, Atwood JE, Scott PT, et al. Venous thromboembolism among United States soldiers deployed to Southwest Asia. Thromb Res. 2006;117:379–83. [DOI] [PubMed] [Google Scholar]
- 19. Tang L, Hu Y. Ethnic diversity in the genetics of venous thromboembolism. Thromb Haemost. 2015;114:901–9. [DOI] [PubMed] [Google Scholar]
- 20. Saposnik G, Redelmeier DA, Lu H, Fuller‐Thomson E, Lonn E, Ray JG. Myocardial infarction associated with recency of immigration to Ontario. QJM. 2010;103:253–8. [DOI] [PubMed] [Google Scholar]
- 21. Saposnik G, Redelmeier DA, Lu H, Lonn E, Fuller‐Thomson E, Ray JG. Risk of premature stroke in recent immigrants (PRESARIO): population‐based matched cohort study. Neurology. 2010;74:451–7. [DOI] [PubMed] [Google Scholar]
- 22. Chiu M, Austin PC, Manuel DG, Tu JV. Cardiovascular risk factor profiles of recent immigrants vs long‐term residents of Ontario: a multi‐ethnic study. Can J Cardiol. 2012;28:20–6. [DOI] [PubMed] [Google Scholar]
- 23. Tu JV, Chu A, Rezai MR, et al. The incidence of major cardiovascular events in immigrants to Ontario, Canada: the CANHEART Immigrant Study. Circulation. 2015;132:1549–59. [DOI] [PMC free article] [PubMed] [Google Scholar]
- 24. Ageno W, Dentali F. Venous thromboembolism and arterial thromboembolism. Many similarities, far beyond thrombosis per se. Thromb Haemost. 2008;100:181–3. [PubMed] [Google Scholar]
- 25. Roberts LN, Patel RK, Arya R. Venous thromboembolism and ethnicity. Br J Haematol. 2009;146:369–83. [DOI] [PubMed] [Google Scholar]
- 26. Deitelzweig SB, Lin J, Johnson BH, Schulman KL. Venous thromboembolism in the US: does race matter? J Thromb Thrombolysis. 2011;31:133–8. [DOI] [PubMed] [Google Scholar]
- 27. Fang C, Cohen HW, Billett HH. Race, ABO blood group, and venous thromboembolism risk: not black and white. Transfusion. 2013;53:187–92. [DOI] [PMC free article] [PubMed] [Google Scholar]
- 28. Hooper WC, Holman RC, Heit JA, Cobb N. Venous thromboembolism hospitalizations among American Indians and Alaska Natives. Thromb Res. 2002;108:273–8. [DOI] [PubMed] [Google Scholar]
- 29. Howard VJ, Cushman M, Pulley L, et al. The reasons for geographic and racial differences in stroke study: objectives and design. Neuroepidemiology. 2005;25:135–43. [DOI] [PubMed] [Google Scholar]
- 30. Khan AA, Zafar SN. Venous thromboembolism in Pakistan: a neglected research agenda. J Thromb Thrombolysis. 2013;35:234–42. [DOI] [PubMed] [Google Scholar]
- 31. Kitamukai O, Sakuma M, Takahashi T, Kagaya Y, Watanabe J, Shirato K. Incidence and characteristics of pulmonary thromboembolism in Japan 2000. Intern Med. 2003;42:1090–4. [DOI] [PubMed] [Google Scholar]
- 32. Stein PD, Kayali F, Olson RE, Milford CE. Pulmonary thromboembolism in American Indians and Alaskan Natives. Arch Intern Med. 2004;164:1804–6. [DOI] [PubMed] [Google Scholar]
- 33. White RH, Zhou H, Romano PS. Incidence of idiopathic deep venous thrombosis and secondary thromboembolism among ethnic groups in California. Ann Intern Med. 1998;128:737–40. [DOI] [PubMed] [Google Scholar]
- 34. Yokoyama K, Kojima T, Sakata Y, et al. A survey of the clinical course and management of Japanese patients deficient in natural anticoagulants. Clin Appl Thromb Hemost. 2012;18:506–13. [DOI] [PubMed] [Google Scholar]
- 35. Buckner TW, Key NS. Venous thrombosis in blacks. Circulation. 2012;125:837–9. [DOI] [PubMed] [Google Scholar]
- 36. Fried LP, Borhani NO, Enright P, et al. The Cardiovascular Health Study: design and rationale. Ann Epidemiol. 1991;1:263–76. [DOI] [PubMed] [Google Scholar]
- 37. Klatsky AL, Armstrong MA, Poggi J. Risk of pulmonary embolism and/or deep venous thrombosis in Asian‐Americans. AmJ Cardiol. 2000;85:1334–7. [DOI] [PubMed] [Google Scholar]
- 38. Montagnana M, Favaloro EJ, Franchini M, Guidi GC, Lippi G. The role of ethnicity, age and gender in venous thromboembolism. J Thromb Thrombolysis. 2010;29:489–96. [DOI] [PubMed] [Google Scholar]
- 39. White RH, Zhou H, Murin S, Harvey D. Effect of ethnicity and gender on the incidence of venous thromboembolism in a diverse population in California in 1996. Thromb Haemost. 2005;93:298–305. [DOI] [PubMed] [Google Scholar]
- 40. White RH, Keenan CR. Effects of race and ethnicity on the incidence of venous thromboembolism. Thromb Res. 2009;123(Suppl 4):S11–7. [DOI] [PubMed] [Google Scholar]
- 41. Zakai NA, McClure LA. Racial differences in venous thromboembolism. J Thromb Haemost. 2011;9:1877–82. [DOI] [PubMed] [Google Scholar]
- 42. Hernandez W, Gamazon ER, Smithberger E, et al. Novel genetic predictors of venous thromboembolism risk in African Americans. Blood. 2016;127:1923–9. [DOI] [PMC free article] [PubMed] [Google Scholar]
- 43. Zoller B, Li X, Sundquist J, Sundquist K. Risk of venous thromboembolism in first‐ and second‐generation immigrants in Sweden. Eur J Int Med. 2012;23:40–7. [DOI] [PubMed] [Google Scholar]
- 44. Puurunen MK, Gona PN, Larson MG, Murabito JM, Magnani JW, O’Donnell CJ. Epidemiology of venous thromboembolism in the Framingham Heart Study. Thromb Res. 2016;145:27–33. [DOI] [PMC free article] [PubMed] [Google Scholar]
Associated Data
This section collects any data citations, data availability statements, or supplementary materials included in this article.
Supplementary Materials