

Abstract
The pathophysiology of neurodegenerative diseases is poorly understood, and therapeutic options are few. Neurodegenerative diseases are hallmarked by progressive neuronal dysfunction and loss, associated with chronic glial activation1. Whether microglial activation, which is viewed in general as a secondary process, is detrimental or protective in neurodegeneration remains unclear1–8. Late-onset neurodegenerative disease observed in patients with histiocytoses9–12, which are clonal myeloid diseases associated with somatic mutations in the RAS/MEK/ERK pathway such as BRAFV600E 13–17, suggests a possible role of somatic mutations in myeloid cells in neurodegeneration. Yet expression of BRAFV600E in the hematopoietic stem cell (HSC) lineage causes leukemic and tumoral diseases but not neurodegenerative disease18,19. Microglia belong to a lineage of adult tissue-resident myeloid cells that develop during organogenesis from yolk sac erythro-myeloid progenitors (EMP) distinct from HSC20–23. We thus hypothesized that a somatic BRAFV600E mutation in the EMP lineage may cause neurodegeneration. Here we show that mosaic expression of BRAFV600E in EMP results in clonal expansion of tissue-resident macrophages and a severe late-onset neurodegenerative disorder, associated with accumulation of ERK-activated amoeboid microglia in mice, also observed in human histiocytoses patients. In the murine model, neurobehavioral signs, astrogliosis, amyloid precursor protein deposition, synaptic loss and neuronal death were driven by ERK-activated microglia and were preventable by BRAF inhibition. These results identify the fetal precursors of tissue-resident macrophages as a potential cell-of-origin for histiocytoses, and demonstrate in mice that a somatic mutation in the EMP lineage can drive late-onset neurodegeneration. Moreover, these data identify activation of the MAP kinase pathway in microglia as a cause of neurodegeneration, and provide opportunities for therapeutic intervention aimed at preventing neuronal death in neurodegenerative diseases.
Somatic mutations are frequent in ‘normal’ and tumoral tissues24,25, and essential for tumorogenesis, but their role in neurodegeneration remains unexplored. We achieved somatic mosaicism for a BRAFV600E allele26 and yellow fluorescent protein (YFP) in the resident macrophage lineage using inducible genetic targeting20,22,23 in Csf1rMerCreMer mice27 (Fig. 1a, Extended data Fig. 1, see methods). Mice reached weaning age in normal Mendelian ratio (n=342, Fig. 1b). YFP expression was absent from HSC-derived cells in the bone marrow and blood but was detected in F4/80+ tissue macrophages (Fig. 1c–e)20,22. RNA-seq analysis of sorted YFP+ F4/80+ macrophages confirmed expression of BRAFV600E transcripts in BRAFVE mice (Fig. 1f). The proportion of F4/80+ YFP+ macrophages was increased in tissues from BRAFVE mice in comparison to littermates (Fig. 1e). In situ Ki67, phospho-Histone H3, and cleaved caspase 3 staining of brain microglia indicated an increased proliferative index and decreased apoptosis in BRAFV600E YFP+ microglia (Fig. 1g, Extended data Fig. 1f). RNA-seq analysis of Kupffer cells and microglia from BRAFVE mice and littermates identified a mitotic gene expression signature, as well as expression of ERK target genes, inflammatory cytokines and lectins (Fig. 1h, i, Extended data Fig. 1g, Supplementary Tables 1, 2). Nevertheless, histological and flow cytometry analysis of liver, brain, lung, kidney, bone marrow and spleen from young BRAFVE mice revealed no overt abnormalities, and in particular no tumoral or leukemic phenotypes (Extended data Fig. 1h). This is in contrast to results obtained when targeting BRAFV600E alleles in HSC using VavCre; BRAFLSL-V600E mice19 and Csf1riCre; BRAFLSL-V600E mice or in more mature HSC-derived myeloid precursors as achieved in CD11cCre; BRAFLSL-V600E mice (18 and Extended data Fig. 2, 3). In each of these models, expression of BRAFV600E in HSCs or HSC-derived cells resulted in a highly penetrant (100%) leukemic or tumoral histiocytic phenotype in the bone marrow, spleen and lung. Altogether, these data show that targeted expression of a BRAFV600E allele in EMP does not lead to leukemic/tumoral transformation, in contrast to the targeting of HSC-derived progenitors, and results in otherwise healthy mice carrying clones of BRAFV600E resident macrophages endowed with a small proliferative advantage.
Figure 1. Targeting BRAFV600E in tissue-resident macrophages.

(a, b) Breeding scheme for experimental mice and genotype distribution (n=342). (c, d) YFP expression on BM LSK, blood leukocytes and microglia from 1-month-old mice, representative of n=5 per group. (e) Proportion of YFP+ F4/80+ cells in tissues from 1-month-old mice. Circles represent individual mice. Unpaired two-tailed t-test. (f) A>T transversion encoding BRAFV600E in YFP+ Kupffer cells at the Braf locus. Red and blue bars indicate forward and reverse strands. (g) Ki67 and cleaved Caspase 3 (Casp3) expression in YFP+ microglia from 1-month-old brains. n=5 per group. Unpaired two-tailed t-test. (h) GSEA of differentially expressed genes in YFP+ microglia from BRAFVE (n=3) and littermates (n=2) mice. q-value < 0.01. (i) Heatmap representation of selected genes from (h), values are displayed as z-score. See also Extended Data Fig. 1.
To determine the potential effects of BRAFV600E macrophage clones in adult tissues, we longitudinally analyzed a large cohort (n=155) of BRAFVE mice and littermates controls. We found that BRAFVE mice developed a slowly progressive neurologic impairment (Fig. 2a–d, Supplementary Video 1, Extended data Fig. 4). Young mice did not present with detectable neurological symptoms, as evaluated by the rotarod test. However, from the age of 4–5 months BRAFVE mice presented with axial rolling, a unilateral loss of hindlimb reflexes, and unilateral increase in overlap distance between hind and front paws followed by decreased stride length as measured by footprint assays (score 1) (Fig. 2a, d, Supplementary Video 2). BRAFVE mice later developed hindlimb paresis or loss of hindlimb reflexes (score 2), associated with weight loss. At a more advanced stage, BRAFVE mice presented in rapid succession with paralysis of one and subsequently of both hindlimbs (score 3 and 4) and full loss of hindlimb reflexes (Fig. 2a, b and Supplementary Video 3), at which time mice were flagged as moribund by veterinary staff and were sacrificed. Cumulative incidence of score 1 criteria indicated that ~90% of male and female BRAFVE mice presented with a neurological disease by 7 months of age, and ~60% of BRAFVE mice had progressed to full paralysis by 9 months of age (Fig. 2c–f). To further investigate if the neurologic disease was dependent on constitutive active BRAF, we placed BRAFVE and BRAFWT mice on an ad libitum diet containing a BRAF inhibitor (PLX4720, Extended data Fig. 4) at one and three months of age. PLX4720 treatment delayed the onset of the neurological phenotype when initiated early (at one month of age) and mitigated disease progression in both cases. By 9 months of age, 80% of BRAFVE mice treated with PLX4720 were alive with an average clinical score of 2 (Fig. 2d–f). These results suggest that BRAFV600E mosaicism in tissue-resident macrophages causes a late-onset progressive neurological disorder with features of cerebellar ataxia, also found in patients with cerebral histiocytoses9,11.
Figure 2. Neurodegenerative disease in BRAFVE mice.

(a) Footprint assays. n=20 mice per group. (b) Limb-clasping reflexes in 6–8-month old mice. n=10 per group. (c) Cumulative incidence of behavioral abnormalities in BRAFVE mice and controls. Log-rank (Mantel-Cox) test. (d) Overlap distance, and stride length of mice on control or PLX4270 diet from 1 month or 3 months of age. Average values ±s.d. for each group, 2way ANOVA, *p<0.05, **p<0.01, ***p<0.001. (e) Disease progression in mice from (d), average score excluding mice euthanized due to paralysis (†). (f) Cumulative incidence of behavioral abnormalities in mice from (d). Log-rank (Mantel-Cox) test (g) Scheme depicting microglia (Iba1) and neuronal (NeuN) densities in brain regions from BRAFVE and BRAFWT (n=4 per group). (h) Iba1 staining and quantitative analysis of microglial accumulation (Iba1+), phagocytosis (Iba1+/Lamp2+), astrogliosis (GFAP+), relative synapse density (determined by Synaptophysin and Homer1), neuronal loss (NeuN) and amyloid precursor protein (APP) in brainstem from 5–9 month-old BRAFVE mice on control diet (n=4), BRAFVE mice on PLX diet (n=4–6), and BRAFWT (n=4). One-way ANOVA. See also Extended data Fig. 4, 6.
We next investigated pathological changes that may underlie neurologic impairment in asymptomatic one-month old BRAFVE mice, and found early signs of microglial and astrocyte activation, without signs of neuronal damage such as deposit of amyloid precursor protein (APP) or neuronal loss (Extended data Fig. 5). However, in ~6 month-old BRAFVE mice, large clusters of amoeboid Iba1+ microglia were present in the cerebrum, preferentially located in the thalamus, brain stem, cerebellum and spinal cord (Fig. 2g, h, Extended data Fig. 6). In these areas we also observed Lamp2+ phagocytic microglia, marked astrogliosis, synaptic and neuronal loss, and APP deposits (Fig. 2g, h). Luxol Fast Blue/PAS staining indicated demyelination, potentially secondary to axonal damage (Extended data Fig. 6). BRAF inhibition reduced microglia accumulation and astrogliosis, phagocytosis, demyelination, neuronal loss and APP deposition (Fig. 2h, Extended data Fig. 6). Thus, mice presented with a neurodegenerative disease driven by constitutive active BRAF in microglia.
Immunostaining for CD68, Iba1, YFP and pERK demonstrated that microglial clusters represented the accumulation of EMP-derived (YFP+) pERK+ microglia (Fig. 3a, b, Extended data Fig. 7). Microglial ERK-activation in brain and spinal cord were confirmed by western blot on whole tissue and by confocal microscopy (Fig. 3c, d, for gel source data, see Supplementary Figure 1). Immunofluorescence analyses also indicated that pERK+ YFP+ amoeboid microglia had lost their ramifications (Fig. 3d). Flow cytometry analysis confirmed the preferential expansion of YFP+ microglia (Fig. 3e, f). Granulocytes, monocytes and B-cells were absent or rare, but CD3+ CD8+, CD4+ and Foxp3+ T-cells were increased (Fig. 3f, Extended data Fig. 7, for gating strategy, see Supplementary Figure 2). Finally, BRAF inhibition mitigated the accumulation of YFP+ microglia, likely by decreasing their proliferation (Fig. 3e, g), and prevented ERK phosphorylation and the amoeboid phenotype of microglia (Fig. 3b–d). Altogether, our data suggest that BRAFV600E somatic mosaicism in microglia drives a neurodegenerative disease mediated by microglial activation.
Figure 3. ERK activation in BRAFV600E microglia.

(a) CD68, YFP and pERK staining in spinal cord from 7-month old mice. Scale bars=500µm, 10µm for insets. n=4 per group. (b) pERK+ microglia in brainstem. Circles represent individual mice. One-way ANOVA. (c) ERK phosphorylation in spinal cords and brains from 6–9 month-old mice. Top: representative western blot, bottom: pERK/ERK ratio, n=5 per group. One-way ANOVA. (d) pERK expression in YFP+ microglia from BRAFVE mice. n=5 per group. Scale bars=5µm. (e) Numbers of microglia from 5–9 month-old mice Circles represent individual mice. One-way ANOVA. (f) Heatmap representation of cell frequency among CD45+ cells in the brain. n=3 per group. (g) Ki67+ and cleaved Caspase 3+ (Casp3) expression in YFP+ microglia from 5–9 month-old BRAFVE mice, n=6 per group. Unpaired two-tailed t-test. See also Extended data Fig. 7.
We thus investigated the cellular and molecular mechanisms that may operate in microglia to drive neurodegenerative disease. RNA-seq analysis of FACS-sorted YFP+ microglia from paralyzed BRAFVE mice and control littermates identified ~8000 differentially expressed genes (DEG), 80% of them being upregulated (Supplementary Table 3). GSEA analysis of DEG identified Ras signaling, complement activation, and inflammatory response signatures including expression of Il1b, Il18, Il6 and Il17, genes associated with phagocytosis such as cathepsins and pattern recognition receptors, growth factors and growth factor receptors usually expressed by fibroblasts, and matrix-associated genes such as laminins and collagens (Fig. 4a–b). Expression of Dectin-1 (Clec7a), LFA-1 (CD11a), VLA-4 (CD49d), the Pdgf receptor, Il1b and Il17a and their decrease following PLX4720 treatment was confirmed at the protein level and collagen IV and VI deposition was observed at sites of YFP+ microglia accumulation (Fig. 4c–f). These results indicate that the pathological consequences of microglial ERK activation include the accumulation of amoeboid microglia producing inflammatory cytokines of the Il1/18 and Il6/17 families, which are mediators of neuronal loss and neurodegeneration28–30 and local matrix remodeling, including the production of collagen.
Figure 4. Molecular features of ERK-activated microglia, and their presence in histiocytoses patients.

(a) GSEA of differentially expressed genes in YFP+ microglia from 6–7 month-old littermates. q-value <0.05. EMT: epithelial-mesenchymal transition. (b) Heatmap representation of selected DEG, values are displayed as z-score. (c) Validation of gene expression in YFP+ microglia. n=5 per group. FMO: fluorescence minus one. (d) Il1b expression in spinal cords from 6–7 month-old mice. n=3 per group. Scale bars=10µm. (e) Bioplex analysis of Il1b and Il17a in spinal cords from 6–9 month-old mice. Circles represent individual mice. Unpaired two-tailed t-test. (f) Collagen IV and collagen VI expression in spinal cord from (d). n=3 per group. Scale bars=10µm. (g) CD163, pERK and BRAFV600E expression in ECD brain tissue. Upper panels: 400× objective, lower panels: scale bar is 10µm. (h) Quantification of pERK microglia in control (n=6) and ECD (n=3) brains. Mann-Whitney test. (i) Heatmap representation of selected genes from RNA-seq analysis of brain tissue from 5 control brains and 2 histiocytoses patients (JXG and LCH), values are displayed as z-score. q-value <0.01. See also Extended Data Fig. 9.
Of note, apart from the hindbrain, midbrain and thalamus, expansion of YFP+ F4/80+ pERK+ macrophages was also detected in the forebrain and in organs outside of the central nervous system, such as the liver (Extended data Fig. 8a–c). However, we did not observe histological or biological signs of liver, spleen, lung, or kidney damage in mice housed in SPF conditions in the course of this study (Extended data Fig. 8d–f). Possible explanations for the intriguing finding that ERK-activated macrophages are better tolerated outside the posterior part of the brain may relate to cell-autonomous or cell-extrinsic homeostatic mechanisms that operate in various anatomical locations and tissue niches, such as the greater exposure to microbial and environmental stimuli in the liver.
Results from our model therefore suggested that neurodegenerative diseases in histiocytoses patients may involve the accumulation of ERK-activated microglia, producing inflammatory cytokines and collagen at sites of neurodegeneration, but there was little prior data evaluating microglia in histiocytoses patients. We thus analyzed brain tissue from 5 patients with ECD-, LCH-, and Juvenile Xanthogranuloma- (JXG) associated neurodegenerative disease, carrying a BRAF mutation (17 and 4g–i, Extended data Fig. 9, Supplementary Table 4). In ECD patients, we observed microglial activation, in the form of numerous amoeboid BRAFV600E+ CD163+ microglia with nuclear pERK+ staining at sites of neuronal loss, astrogliosis and demyelination (Fig. 4g, h, Extended data Fig. 9b, c). Comparison of the transcriptome from the JXG and LCH brain biopsies with control brain tissue also identified a MAPK-pathway activation signature, and indicated increased expression of IL1b, IL18, IL6 and IL17A, pattern recognition receptors and cathepsins, as well as PDGF receptor and collagen genes (Fig. 4i). Therefore, brain tissues from human patients shared key histological, cellular and molecular features observed in the mouse.
In summary, our data indicate that mosaic expression of a BRAFV600E allele in the resident macrophage lineage gives rise to clonal expansion of ERK-activated microglia, causing synaptic and neuronal loss that predominates in the hindbrain, midbrain and thalamus, ultimately leading to a lethal neurodegenerative disease in adult mice. Phagocytosis and production of neurotoxic mediators of the Il1 and Il17 families may account, at least in part, for neurodegeneration. Loss of microglial ramifications and matrix remodeling may also compromise synaptic connectivity. More generally, the finding that MAPK signaling in microglia causes neurodegeneration in mice supports the notion that pharmacological inhibition of this pathway might represent a useful strategy to prevent neuronal death in neurodegenerative diseases.
Our data also indicate that the pathophysiological consequences of a somatic BRAFV600E mutation in different hematopoietic lineages are dramatically distinct. BRAFV600E expression in HSC can cause a tumoral disease but results in a neurodegenerative inflammatory disorder when expressed in EMP, thus linking the pathophysiology of clonal and neurodegenerative disorders. The clinical heterogeneity of histiocytoses in humans may result in part from mosaicism in distinct lineages. Beyond patients with histiocytoses, somatic mutations, including BRAFV600E, spontaneously arise in normal and tumoral tissues24,25, suggesting the novel and intriguing possibility that somatic mutations in microglia could contribute to the pathogenesis of commonly encountered forms of neurodegenerative diseases.
Methods
Targeting of BRAFV600E mutation to EMPs and EMP-derived cells
EMPs appear in the yolk sac at embryonic day (E) 8.5 and express the Csf1 receptor (Csf1r)20,22,23. They colonize the fetal liver from E9.5 and give rise to macrophage precursors (pMacs) that distribute in embryonic tissues and differentiate into tissue-specific macrophage subsets such as microglia in the central nervous system23. Therefore, to investigate the consequences of BRAFV600E expression in the EMP lineage, we genetically targeted EMPs by pulse labeling Csf1rMeriCreMer; BRAFLSL-V600E; Rosa26LSL-YFP E8.5 embryos with 4-hydroxytamoxifen (4-OHT, Sigma)20. Embryonic development was estimated considering the day of vaginal plug formation as 0.5 days post-coitum (dpc). Cre recombination in Csf1rMeriCreMer; Rosa26LSL-YFP; BRAFLSL-V600E embryos was induced by single injection of 37.5 mg per kg (body weight) of OH-TAM into pregnant females. Short-lived 4-OHT leads to transient nuclear translocation of the estrogen receptor-Cre recombinase fusion protein (MeriCreMer) in cells expressing the Csfr1MeriCreMer transgene and deletion of a floxed stop cassette (LSL) in the BRAFLSL-V600E and Rosa26LSL-YFP alleles. OH-TAM was supplemented with 18.75 mg per kg (body weight) progesterone (Sigma) to counteract the mixed oestrogen agonist effects of tamoxifen, which can result in fetal abortions.
Mice
Csf1rMeriCreMer, Csf1riCre, CD11Cre, Rosa26YFP-LSL mice20,22,27,31 and BRAFLSL-V600E26 mice -kindly provided by C. Pritchard (Leicester, UK)- were maintained under SPF conditions. Animal procedures were performed in adherence to our project licenses issued by the Institutional Review Board (IACUC 15-04-006 and 13-04-003) from MSKCC. Genotyping was performed according to protocols described previously for Csf1riCre32 Csf1rMeriCreMer20, CD11Cre31 and BRAFLSL-V600E26 mice. BRAFWT Cre−, BRAFV600E Cre−, BRAFWT Cre+ animals were considered as BRAFWT for representation of data. For BRAF inhibition, animals were placed on ad libitum PLX4720 diet at 1 or 3 months of age (PLX4720-containing chow 417ppm, provided by Plexxikon Inc.33). BRAFWT and BRAFVE male and female littermates were assigned randomly into the control or treated group. Scoring of mice was performed blinded and at least weekly by assessing hindlimb reflexes and other behavioral phenotypes such as axial rolling34,35. The investigators were not blinded to allocation during experiments and outcome assessment.
Footprint analysis
Mice were given two trials to run down a runway before the experiment. Mouse forepaws and hindpaws were painted with red and blue ink, respectively. Mice were then allowed to run down a runway lined with white paper. At least four steps from the middle portion of each run were measured for (1) overlap between forepaw and hindpaw placement, (2) stride length, (3) front-base width (the distance between the right and left forelimb strides) and (4) hind-base width (the distance between the right and left hindlimb strides)36. Mean values were used for graphs and statistical analyses.
Rotarod assay
The assay was conducted using a ROTO-ROD series 8 (IITC life sciences) with accelerating speed (accelerated from 4 to 40 rpm over 120 s). The mice were trained on the accelerating rotarod with 3 training session per day for 3 days. On the day of the experiment, the mean latency to fall off the rotarod recorded in the 3 trials was used in the analysis.
Preparation of cell suspensions, flow cytometry and cell sorting
Pregnant females were killed by exposure to CO2. Embryos were removed from the uterus, washed in 4°C phosphate-buffered saline (PBS, Invitrogen) and dissected under a Leica M80 microscope. For blood phenotyping of adult mice, mice were anaesthetized and blood was collected by cardiac puncture. Bone marrow was collected by flushing one leg with 5 ml RPMI (Invitrogen). For flow cytometry experiments, organs were incubated in PBS containing 1mg/ml collagenase D (Roche), 100U/ml DNase I (Sigma), 2.4mg/ml of dispase (Invitrogen) and 3% FCS (Invitrogen) at 37°C for 30 min prior to mechanical disruption. For embryonic tissue incubation time at 37°C was reduced to 20 min. For cell sorting, tissues were digested for 30min at RT in PBS containing 2 mg/ml of collagenase D (Roche), 200U/ml DNase I (Sigma), 4.8 mg/ml of dispase (Invitrogen), 3% FCS (Invitrogen) and 1uM of flavopiridol (Sigma) followed by mechanical disruption under a 100um filter. Cell suspensions were centrifuged at 320g for 7 min, resuspended in FACS buffer (PBS, 0.5% BSA and 2 mm EDTA) containing purified anti-CD16/32 (1:100 dilution) and 5 % normal mouse, 5 % normal rat and 5 % normal rabbit serum and incubated for 15min at 4°C. Samples were immunostained with antibodies mixes for 30 min at 4°C. For FMO (fluorescence minus one), brain cell suspensions from BRAFWT and BRAFVE mice were mixed prior to staining. The full list of antibodies used can be found in Supplementary Table 5. Cell sorting was performed using an Aria III BD cell sorter. Single live cells were gated on the basis of dead cell exclusion (DAPI), side (SSC-A) and forward scatter (FSC-A) gating, and doublet exclusion using forward scatter width (FSC-W) against FSC-A. Macrophage populations were identified after gating on CD45 based on expression of F4/80, CD11b and YFP. 200 cells for each sample were directly sorted into a 96 well plate (Biorad) in 4ul of H2O containing 0.2% of triton-X (Sigma) and 0.8U/ul of RNAse inhibitor (Clontech), and processed as indicated below.
For intracellular stainings, cell suspensions were purified by a Percoll (Sigma) gradient (70/37/30%), and cells were collected from the 70/37 interface. After washing twice with PBS, cells were stained with a viability dye (Ghost Dye Red 780, Tonbo Biosciences) according to manufacturers protocol. Cells were first stained with antibodies for surface markers (see Supplementary Table 5), then processed for intracellular stainings using the Foxp3/Transcription Factor Staining Buffer Set (Affymetrix eBioscience) according to manufacturers protocol. Cell numbers per organ or per gram of tissue were calculated as follows. For embryonic tissues, cell suspensions were prepared, stained, and acquired from whole organs, and the number of live cells per tissue was directly obtained from FCS files. In adult mice, organs were weighted, cell suspensions were prepared from 20 to 500 mg of tissue, and the number of cells per gram of tissue was determined using a cell counter (GUAVA easyCyte HT). For gating strategies used for different tissues, see Supplementary Figure 2. Proportion of YFP+ F4/80+ cells in tissues from BRAFVE and BRAFWT littermates were analyzed by calculating the proportion of YFP+ among F4/80+ cells. Values from BRAFWT littermates were then normalized and set to 1.
Generation and analysis of Kupffer cells and microglia RNA-seq in BRAFVE and BRAFWT littermate controls
Sorted cells underwent amplification (14 cycles) using the SMART-seq V4 (Clonetech) ultra low input RNA kit for sequencing. 10 ng of amplified cDNA was used to prepare Illumina hiseq libraries with the Kapa DNA library preparation chemistry (Kapa Biosystems) using 8 cycles of PCR. Samples were barcoded and run on a Hiseq 2500 1T in a 50bp/50bp Paired end run, using the TruSeq SBS Kit v3 (Illumina). An average of 54 million paired reads were generated per sample and the percent of mRNA bases was closed to 77% on average. FASTQ files were mapped to the Mouse genome mm10 using the Star aligner37 that maps reads gnomically and resolves reads across splice junctions. We used several QC metrics for the RNA-seq library, including intron–exon ratio, intragenic reads fraction, and GC bias. We quantified exon and gene expression using Sailfish against the Mus musculus transcriptome GRCh3838. After merging technical replicates differential expression tests were performed using the DESEQ2 algorithm39. We considered genes that had a FDR<0.01 to be significantly different between genotypes and ranked significant genes by fold-change with a cutoff of 1. Gene set enrichment analysis on KEGG pathway, GO term, Reactome, and MSigDB gene set collection was done using the over-representation test with hypergeometric model to assess whether the number of selected genes associated with disease is larger than expected40.
Generation and analysis of human brain RNA-seq
Snap frozen normal brain tissues were obtained from the MSKCC Medical Donation Program. RNA was extracted using the Qiagen all prep DNA/RNA mini kit (Cat#80204) according to the manufacturer’s instructions. RNAs were submitted to ribogreen quantification and quality control on Agilent BioAnalyzer. Average amount was 5.3ug, Average RIN was 8.9. 500ng of total RNA underwent polyA selection and Truseq library preparation according to instruction provided by Illumina (TruSeq™ RNA Sample Prep Kit v2), with 8 cycles of PCR. Samples were barcoded and run on a Hiseq 4000 in a 125bp/125bp Paired end run, using the TruSeq SBS Kit v3 (Illumina). An average of 75 million paired reads was generated per sample. At the most the ribosomal reads represented 7% and the percent of mRNA bases was closed to 45% on average. FASTQ files from control brains and previously sequenced JXG and LCH brain samples (SJLCH13 and SJLCH14)17 were mapped to Human genome GRCh37 using Star aligner. We used several QC metrics for the RNA-seq library, including intron–exon ratio, intragenic reads fraction, and GC bias. We quantified exon and gene expression using Salmon against Homo sapiens transcriptome GRCh3738. Differential expression tests, statistical tests and pathway analysis was performed as described above for murine RNA-seq.
Immunofluorescence, imaging and analysis (mouse)
Embryos were imaged using a Leica M80 or Zeiss Axio Zoom.V16. Tissues were fixed for 1–3 days in 4% formaldehyde (Sigma). After fixation, tissues for cryosections were incubated overnight in 30% sucrose and embedded in OCT compound (Sakura Finetek). Cryoblocks were cut at a thickness of 16 µm for liver and 50 µm for spinal cord and brain and then blocked with PBS containing 10% normal goat serum (Invitrogen); 1% BSA (w/v); 0.3% Triton X-100 for 1 hour at room temperature. Livers were incubated overnight, brains and spinal cord for 48 hours at 4°C with rat anti-mouse F4/80 (1:300, cat no: MCA497GA, Biorad), rabbit anti-mouse Iba1 (1:300; cat no: 019-19741, Wako), chicken anti-GFP for YFP detection (1:500, cat no: A10262, Invitrogen), rabbit anti-pHis3 (1:100, cat no: sc-8656-R, Santa Cruz), goat anti-IL-1b (1:40, cat no: AF-401-SP, R&D), rabbit anti-pERK1/2 (1:100, cat no: #4370, Cell signaling), rabbit anti-Collagen IV (1:100, cat no: 2150-1470, Biorad), rabbit anti-Collagen VI (1:200, cat no: ab6588, Abcam), rabbit anti-cleaved Caspase3 (1:600, cat no: #9661, Cell Signaling), rat anti-Ki-67 (1:200, cat no: 14-5698-80, eBioscience). Secondary antibodies used were anti-rabbit Cy3 (1:500, Invitrogen), anti-chicken Alexa Fluor 488 (1:500, Invitrogen), anti-rat Alexa Fluor 647 (1:500, Invitrogen), anti-goat Alexa Fluor 568. Samples were then mounted with Fluoromount mounting medium with DAPI (eBiosciences) and visualized using a LSM880 Zeiss microscope with 20×/0.5 (dry) and 40×/1.4 (oil) performing a tile scan and Z-stack on whole tissue at a 512 × 512 or 1,024 × 1,024 pixel resolution. Image analysis and cell quantification was performed using Imaris (Bitplane) software. For paraffin sections, 3 µm sections were prepared before staining with H&E, Trichrome, and luxol fast blue (LFB-PAS). Primary antibodies were rabbit anti-CD68 (5 µg/ml, Boster Biological Technology, cat. no: PA1518), rabbit anti-pERK1/2 (1 µg/ml, cat no: #4370, Cell signaling), chicken anti-GFP for YFP detection (1:5000, cat no: AB13970, Abcam), mouse anti-APP (1:3000, cat no: MAB348, Millipore), rabbit anti-Iba-1 (1:500, cat no: 019-19741, Wako), rabbit anti-GFAP (1:200, cat. no. Z0334, Dako), mouse anti-NeuN (1:200, cat. no. MAB377, Merck Millipore), rat anti-LAMP-2 (1:250, ab13524, Abcam, Cambridge, UK), mouse anti-pERK1/2 (1:200, sc-136521, Santa Cruz), rabbit anti-homer1 (1:200, cat. no. 160003, Synaptic Systems), mouse anti-synaptophysin (1:500, cat. no. 101 011, Synaptic Systems). Primary antibodies were incubated overnight at 4°C. Secondary Alexa- or HRP-conjugated antibodies were added at 1:200 in antibody buffer for 2 hr at room temperature. For immunofluorescent stainings nuclei were counterstained with 4,6-diamidino-2-phenylindole (DAPI, cat. no. 236276, Boehringer). All slides were mounted in Vectashield (Vector Laboratories). Images were taken using a Zeiss Lab.A1 or BZ-9000 Biorevo microscope (Keyence) and analyzed using the BZ-II Analyzer (Keyence). For quantification of cell numbers, at least three parasagittal sections per mouse were analyzed. In cases, where the cell density was too high and single cells could not be quantified, we quantified the immunolabeled area size per brain section. To determine synapse density, imaging was performed using an Olympus Fluoview 1000 confocal laser scanning microscope using a 20 × 0.95 NA objective. Z-stacks with 0.05-µm steps in the z direction, 1,024 × 1,024 pixel resolution, were recorded and analyzed using Imaris software (Bitplane). Colocalization of the presynaptic marker synaptophysin with the postsynaptic marker Homer1 was quantified.
Immunofluorescence, imaging and analysis (human)
Written informed consent was obtained from histiocytosis patients for DNA/RNA sequencing and immunohistochemical studies according to Helsinki convention, and this study received approval from the Institutional Review Board at MSKCC (IRB Protocol 06-107). For all ECD patients, ECD was diagnosed in light of published guidelines for the diagnosis and clinical management of ECD41. Biopsy material was retrieved from the pathology archives at Memorial Sloan Kettering Cancer Center. Immunohistochemistry of human ECD and control tissue (see Supplementary Table 6) was carried out on 3–4 µm thick paraffin sections, fixed with PFA. Immunohistochemical analysis was performed on paraffin sections with rabbit anti-Iba-1 (1:500, cat no: 019-19741, Wako) and mouse anti-pERK1/2 (1:200, sc-136521, Santa Cruz), or mouse anti-CD163 (0.06ug/mL, cat#760-4437, Cell Marque), rabbit anti-pERK1/2 (1µg/ml, cat no: #4370, Cell Signaling) and mouse anti-BRAF V600E (VE1) (1:800, cat no: #E19294, clone VE1, Spring). Secondary Alexa- or HRP-conjugated antibodies (Invitrogen) were added at 1:200. Images were taken with a Zeiss Lab.A1, BondIII (Leica-Microsystems, Buffalo Groove, IL), BZ-9000 BIOREVO microscope (Keyence) and analyzed using the BZ-II Analyzer (Keyence), or with a LSM880 Zeiss microscope with 40×/1.4 (oil) performing a tile scan and Z-stack on whole tissue at a 512 × 512 or 1,024 × 1,024 pixel resolution and manually analyzed using Imaris (Bitplane) software.
Western blot
Tissues were homogenized using a cell lysis kit (Biorad) and a Precellys homogenizer. Primary antibodies were added overnight at a dilution 1:1000 for rabbit anti-pERK1/2 (cat no: #4370, Cell Signaling) and rabbit anti-ERK1/2 (cat no: #9102, Cell Signaling), and 1:5000 mouse anti-beta actin (cat no: #ab6276, abcam). Secondary antibody anti-rabbit HRP (cat no: #7074, Cell Signaling) or anti-mouse AP (cat no: #AP-2000, Vector laboratories) was added for 1 hour at a dilution of 1:2000. Detection of HRP was performed using Pierce ECL Western Blotting substrate (cat no: #32106). Detection of AP vas performed using BCIP/NBT substratekit (cat no: #SK-5400, Vector laboratories). For quantification, a ratio was made of the total integrated optical density (IOD) of pERK bands to the IOD of bands of the corresponding total ERK protein using ImageJ.
Cytokine analysis in spinal cords
Proteins were extracted from 25 mg of tissue using Bio-Plex cell lysis kit. Cytokine concentrations were measured using Bio-Plex Pro Mouse Cytokine 23-plex Assay according to manufacturers protocol.
Serum analysis
70–75uL of serum were analyzed for liver enzymes using Beckman Coulter AU680 Chemistry analyzer.
PLX4720 concentration measurement
Analysis of PLX4720 concentrations in brain, liver and serum was performed in collaboration with Plexxikon Inc. 25 µl serum and 20 mg of homogenized tissue were measured using a standard curve that was generated by adding known amounts of PLX4720 to an untreated serum or homogenized sample.
Statistical analysis and reproducibility
Data are shown as mean with individual values per mouse being represented as circles, unless stated otherwise. Statistical significance was analyzed with Graph Pad Prism by using Mann-Whitney tests, unpaired two-tailed t-tests, 1-way and 2-way ANOVA and Log-rank (Mantel-Cox) test as indicated in the figure legends. The n value represents biological replicates. For RNA-seq statistical analysis R software was used (see Generation and analysis of Kupffer cells and microglia of RNA-seq in BRAFVE and BRAFWT littermate controls and Generation and analysis of human brain RNA-seq). Significance was considered at p < 0.05. Animals that were labeled moribund by veterinarian services had to be euthanized and were therefore excluded from further longitudinal analyses as indicated in the figure legends. Kaplan-Meier survival analysis was used to estimate overall survival and cumulative incidence rate. Experiments were repeated to ensure reproducibility of the observations. Equal variance was assumed for cell counting experiments. No statistical methods were used to predetermine sample size.
Data availability
Gene expression data is deposited on the GEO database (accession number GSE95734). The data that support the findings of this study are available from the corresponding author upon reasonable request.
Extended Data
Extended Data Figure 1. Analysis of one-month old Csf1rMeriCreMer; BRAFLSL-V600E; Rosa26LSL-YFP mice.

(a) % of mice born from the cross depicted in Figure 1a according to their genotype (n=42), but no injection of hydroxy-tamoxifen (4-OHT) to test for adverse effects of 4-OHT administration. (b) Flow cytometry analysis of YFP expression on blood leukocytes. Representative for n=8 per genotype. (c) Flow cytometry analysis of YFP+ cells in the liver. YFP+ cells, present only in Csf1rMeriCreMer+ (Cre+) mice (upper panels), fall into the F4/80+CD11b+ Kupffer cell gate (lower panels). Representative for n=8 per genotype. (d) YFP expression by immunofluorescence in the liver of BRAFVE mice and BRAFWT. YFP+ cells are F4/80+ Kupffer cells. Representative of n=6 mice per genotype. Scale bars=200 µm (5 µm for insets). (e) Total tissue-resident macrophages cell numbers per gram (g) of tissue were analyzed by flow cytometry in BRAFVE mice (n=4) and BRAFWT (n=6). Circles represent individual mice. Unpaired two-tailed t-test. (f) In situ analysis of phospho-Histone H3 (pHis3) staining in YFP+ cells from brains of BRAFVE and BRAFWT. Circles represent individual mice (n=3). Unpaired two-tailed t-test. (g) RNA-seq analysis, heatmap representation of MAPK target genes in YFP+ microglia from BRAFVE (n=3) and BRAFWT (n=2) mice, values are displayed as z-score. (h) Histological analysis of liver, lung, kidney and spleen in BRAFVE mice and BRAFWT. Representative of n=4 mice per genotype. Scale bars=200µm (10µm for insets).
Extended Data Figure 2. Effect of constitutive BRAFV600E expression in Csf1r-expressing cells.
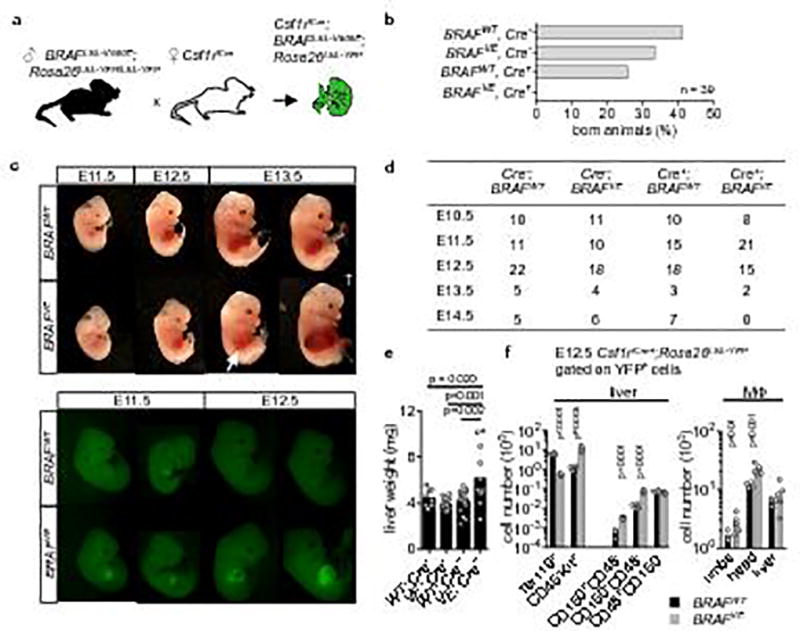
(a) Breeding scheme. (b) Embryonic lethality of Csf1riCre+; BRAFLSL-V600E; Rosa26LSL-YFP mice, bars represent the % of mice born from the cross depicted in (a) according to their genotype (n=39). (c) Brightlight (upper panel) and epifluorescence microscopy (lower panel) of Csf1riCre+ BRAFVE and Csf1riCre+; BRAFWT embryos showing haemorrhagic foci in the liver (arrow) and accumulation of YFP+ cells in fetal liver. † indicates dead embryo. Pictures are representative of n=3 per genotype. (d) Mouse embryos found alive during different developmental stages. Csf1riCre+; BRAFLSL-V600E; Rosa26LSL-YFP mice are associated with 100 % lethality beyond E14.5. (e) Liver weight of E12.5 embryos. Circles represent individual mice. n=8 for WT; Cre−, n=14 for VE; Cre−, n=16 for VE; Cre−, n=12 for VE; Cre+. One-way ANOVA. (f) Flow cytometry analysis of Lin− Kit+ blast, erythroid cell (Ter119) and hematopoietic stem cell numbers (LSK CD150+CD48− and CD150−CD48−) in the E12.5 fetal liver and of E12.5 tissue-resident macrophages in the limbs, head and liver. Circles represent individual mice. n=4 for BRAFWT and n=6 for BRAFVE. Unpaired two-tailed t-test.
Extended Data Figure 3. Analysis of CD11cCre; BRAFV600E mouse model.
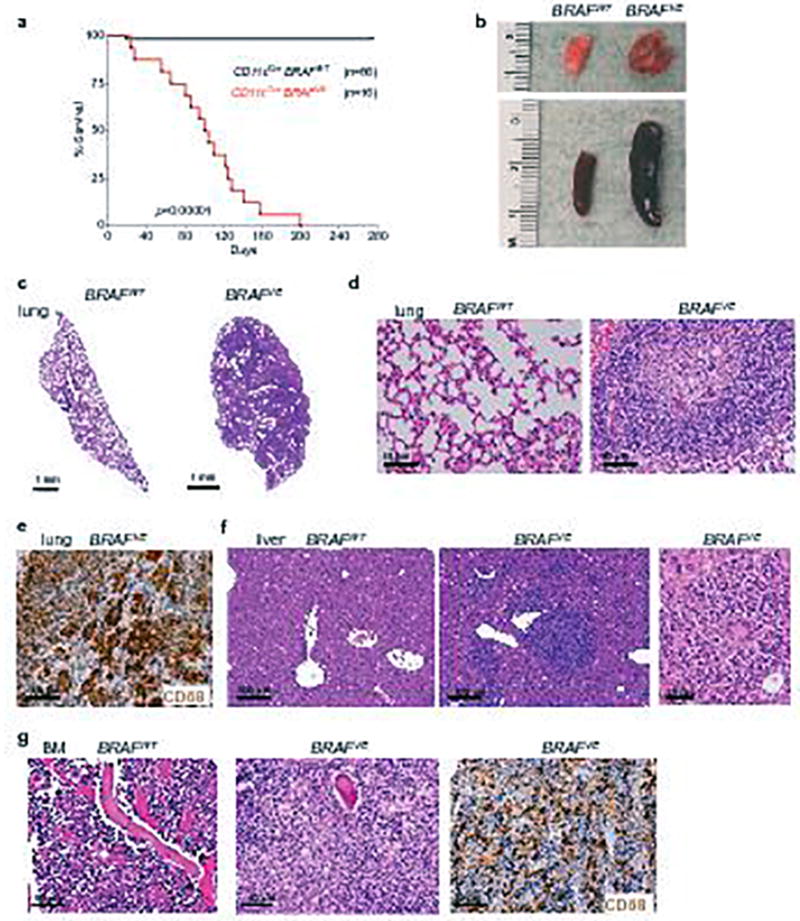
(a) Kaplan-Meier survival curve of BRAFVE (n=16) and BRAFWT (n=66) controls. Log-rank (Mantel-Cox) test. (b) Representative photographs of lung and spleen from BRAFVE mice at time of death with representative BRAFWT control organs. (c–d) Hematoxylin and eosin (HE) stain of lung tissue from BRAFVE and littermate controls. (e) CD68 immunohistochemistry (IHC) of BRAFVE lung tissue. (f) HE stain of liver tissue from BRAFVE and littermate controls with magnified view of granuloma in the BRAFVE liver. (g) HE stain of bone marrow (BM) from BRAFVE and littermate controls with CD68 IHC of BRAFVE mouse. All pictures for (b-g) are representative of n=5 per genotype.
Extended Data Figure 4. Longitudinal study and PLX treatment of the Csf1rMeriCreMer; BRAFV600E; Rosa26LSL-YFP mice.

(a–b) Latency to fall in the rotarod assay and footprint assay quantification for BRAFVE mice (n=7) and BRAFWT littermates (n=8). (a) Rotarod assay at 1 to 4 months of age. Values are mean ± s.d. (b) Rotarod and footprint assay at 4 months of age displaying single values. Mice that are score 1 are labeled in red. (c) Footprint assay quantification of BRAFVE mice at score 1 and littermate controls. Circles represent individual mice. n=10 for BRAFWT and n=11 for BRAFVE. (d) Representative weight curve of BRAFWT and BRAFVE mice on control or PLX4720 diet. (e) PLX4720 concentration in serum (ng/ml), liver and brain (ng/g) of 7–9 month old BRAFWT (n=9) and BRAFVE mice placed on the diet at 1 (n=8) or at 3 months (n=3) of age. Circles represent individual mice. (f) Footprint assay quantification from BRAFVE mice on PLX4720 diet at 1 month (n=8) or at 3 months (n=6) and control (Ctrl) diet (n=13) and BRAFWT (n=32, black). Mice reaching paralysis were excluded from further analysis. See also (g) where † indicates when BRAFVE animals were euthanized. Values are mean ± s.d. 2way ANOVA comparing treated and not treated BRAFVE mice. * p<0.05, **p<0.01, ***p<0.001. (g) Disease progression for BRAFVE mice on control or PLX4720 diet. † indicates animal death due to paralysis.
Extended Data Figure 5. Microglia activation in the brain starts at early, preclinical stages.
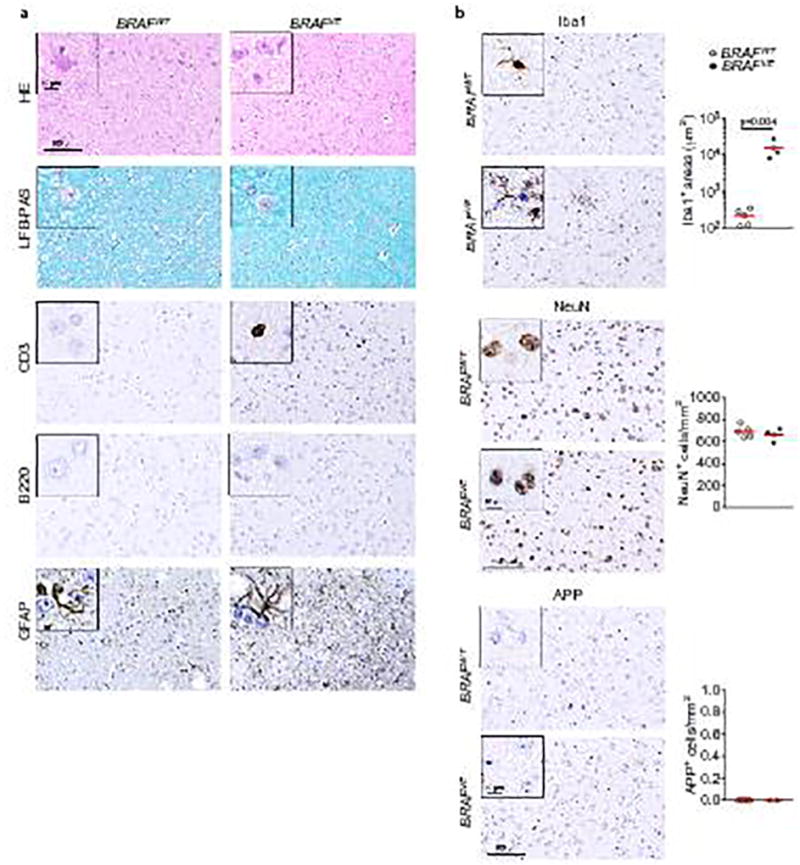
(a) Histological analysis by hematoxylin and eosin (HE) and Luxol-fast-blue-PAS (LFB-PAS) and immunohistochemistry analysis of T-cells (CD3), B-cells (B220) and astrocyte activation (GFAP) in one-month old BRAFVE mice and BRAFWT littermates. Representative of n=5 per for BRAFWT and n=4 for BRAFVE. (b) Immunohistochemistry analysis and quantification of Iba1+ cell density, cortical neurons (NeuN) and expression of amyloid precursor protein (APP), a positive signal for neurodegeneration in one-month old BRAFVE mice and BRAFWT. Representative of n=5 per for BRAFWT and n=4 for BRAFVE. Circles represent individual mice. Scale bars=100µm (10µm for insets). Unpaired two-tailed t-test.
Extended Data Figure 6. Neurodegenerative process in BRAFVE mice.
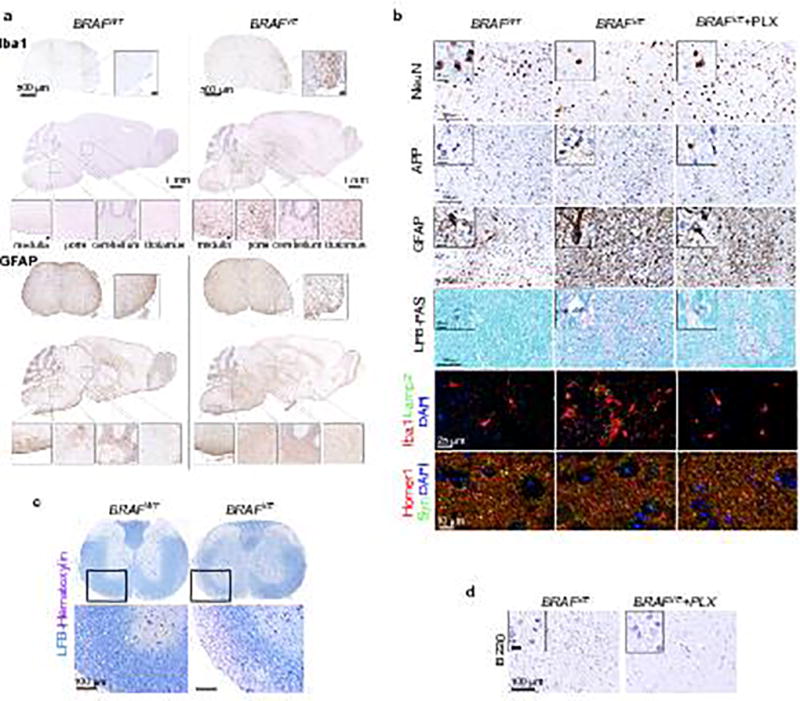
(a) Iba1 and GFAP immunohistochemistry of brain and spinal cord from 6-month-old BRAFVE and BRAFWT. Anatomical regions of insets are indicated. Representative for n=5 BRAFWT and n=4 BRAFVE. Scale bars=500µm for spinal cords and 1mm for brains (50µm for insets). (b) Immunohistochemistry and immunofluorescence as used for quantification in Figure 2h of brain stem for NeuN (neurons), APP (amyloid precursor protein) and GFAP (astrocytes), Iba1+/Lamp2+ cells (phagocytosis), Synaptophysin (Syn) and Homer1 (synapse density) and staining with Luxol-fast-blue (LFB)-PAS. Scale bars=100µm (10µm for insets). Iba1/Lamp2 scale bar=25µm, Syn/Homer1 scale bar=10µm. Representative for 6–9 month old BRAFWT (n=5), BRAFVE (n=4), and for BRAFVE on PLX diet (n=4–6). (c) LFB staining of spinal cord samples from (a). Scale bar=100µm. (d) Immunohistochemistry of brain stem for B220 (B-cells) from BRAFVE on control and PLX diet. Representative for n=4 per genotype. Scale bars=10 µm (10µm for insets).
Extended Data Figure 7. Microglia and T-cell phenotype in BRAFVE mice.
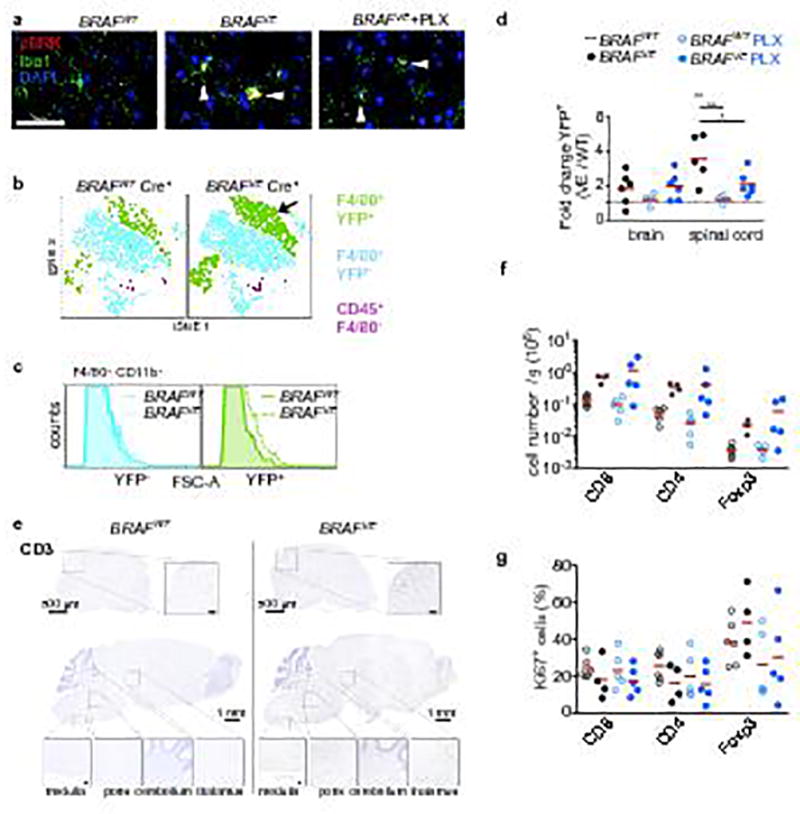
(a) Representative pERK staining in Iba1+ microglia as used for the quantification in Figure 3b in brain stem of 5–9 month old BRAFWT and BRAFVE mice on control or PLX diet. Scale bar=50 µm. (b) Representative tSNE analysis of flow cytometry staining of CD45+ cells from the brain of paralyzed BRAFVE mice and littermate controls. Arrow indicates expansion of F4/80+ YFP+ cells. Representative for n=3 per genotype. (c) FSC profile of YFP+ and YFP− microglia from (b) from BRAFVE and BRAFWT mice indicates an increase of YFP+ microglia cell size. Representative for n=3 per genotype. (d) Proportion of YFP+ F4/80+ cells in indicated organs analyzed by flow cytometry. The proportion of YFP+ among F4/80+ cells from Cre+ BRAFWT on control diet was normalized and set to 1. Analysis was performed on 5–8 month-old BRAFVE mice (n=5–6) and BRAFWT mice (n=6) on control diet, and 7–9 month-old BRAFVE mice (n=6) and BRAFWT mice (n=4) on PLX diet. Circles represent values for individual mice. One-way ANOVA. * p<0.05, **p<0.01, ***p<0.001. (e) CD3 immunohistochemistry of brain and spinal cord from 6-month-old BRAFVE and BRAFWT. Anatomical regions of insets are indicated. Representative for n=5 BRAFWT and n=4 BRAFVE. Scale bars=500µm for spinal cords and 1mm for brains (50µm for insets). (f–g) Analysis of CD8+, CD4+ and Foxp3+ T-cell numbers (e) and proliferation (f) in brain/spinal cord by flow cytometry in 5–8 month-old BRAFVE (n=4) and BRAFWT (n=6) on control diet, and 7–9 month-old BRAFVE (n=6) and BRAFWT (n=5) on PLX diet. Circles represent values for individual mice. One-way ANOVA.
Extended Data Figure 8. BRAFVE mice analysis outside the central nervous system.
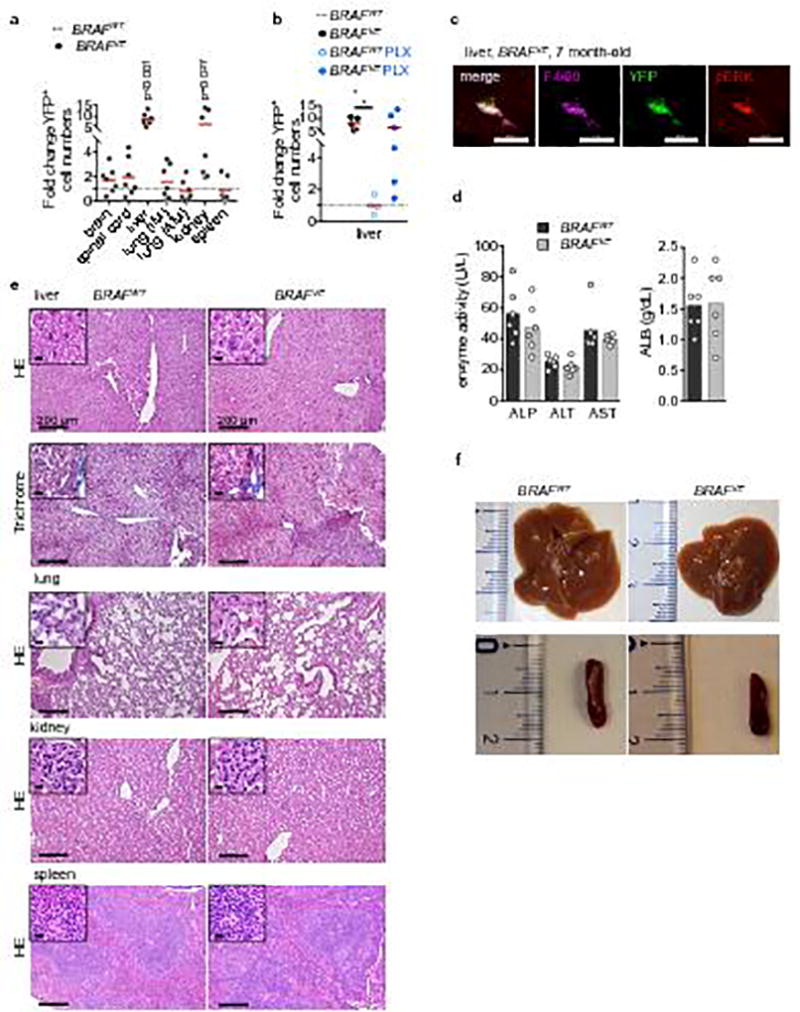
(a) Proportion of YFP+ F4/80+ cells in indicated organs from analyzed by flow cytometry. The proportion of YFP+ among F4/80+ cells from Cre+ BRAFWT (n=6) was normalized and set to 1. Circles represent values for individual BRAFVE mice (n=7). Unpaired two-tailed t-test. (b) Analysis of liver Kupffer cells as in (a) was performed on 5–8 month-old BRAFVE (n=5) and BRAFWT (n=4) on control diet, and 7–9 month-old BRAFVE (n=6) and BRAFWT mice (n=4) on PLX diet. Circles represent values for individual mice. One-way ANOVA. * p<0.05, **p<0.01, ***p<0.001. (c) Immunofluorescent analysis of pERK in F4/80+ Kupffer cells from 5–8 month-old BRAFVE. Results are representative for n=3. (d) Serum analysis of BRAFVE mice (score 1, n=6) and their littermates controls (n=6). ALB: albumin, ALP: alkaline phosphatase, ALT: alanine aminotransferase, AST: aspartate aminotransferase. (e) Gross liver, lung, kidney and spleen structure (HE, Trichrome) of paralyzed BRAFVE and BRAFWT. Representative of n=7 per genotype. Scale bars=200µm (10µm for insets). (f) Liver and spleen gross organs from paralyzed BRAFVE and BRAFWT. Representative of n=5 per genotype.
Extended Data Figure 9. ECD patients.

(a) Table summarizing observed pathological and molecular findings in brain tissue of three ECD patients with neurologic presentations. BRAF status was determined by immunohistochemical analysis and by sequencing. Neuronal loss and demyelination was determined by immunohistochemistry of neurofilament and myelin basic protein (MBP). RF: Rosenthal fiber. n/a: not applicable/no tissue available for further analysis. (b) Immunohistochemistry and immmunofluorescent analysis of ECD brain tissue for CD163, pERK and BRAFV600E (anti-BRAFVE1 antibody). Upper panel scale bar=200µm. Lower panel scale bar=5µm. (c) Immunohistochemistry analysis of ECD brain tissue for neurofilament and MBP shows areas of myelin deficits with preserved axons in the same region. Scale bar=200µm.
Supplementary Material
Acknowledgments
The authors are indebted to Dr Jean Donadieu and the Histiocytosis Study Group (Paris, France) for discussions during the course of this project, and to C. Pritchard, University of Leicester, UK, for the BRAFLSL-V600E strain and Jeffrey Pollard, University of Edinburgh, UK for Csf1rMerCreMer strain. We thank Plexxikon Inc. for the gift of PLX-4720 impregnated and control chow. We acknowledge the use of the Integrated Genomics Operation Core, funded by the NCI Cancer Center Support Grant (CCSG, P30 CA08748), Cycle for Survival and the Marie-Josée and Henry R. Kravis Center for Molecular Oncology. We thank the Molecular Cytology Facility at MSKCC for tissue processing and histological stainings. This work was supported by National Cancer Institute of the US National Institutes of Health (P30CA008748) MSKCC core grant and grants from the Artemis Association / Histio (UK) / A.G. Leventis Foundation, Ludwig Institute for Cancer Research, and NIH/NIAID 1R01AI130345-01 to FG. EM was supported by an EMBO long-term Fellowship (ALTF 530-2015). AP is a Mildred-Scheel Postdoctoral Research Fellow of the Deutsche Krebshilfe e.V. (number 111354). BHD is supported by the American Society of Hematology Research Training Award for Fellows. OAW is supported by grants from the Histiocytosis Association, the Erdheim-Chester Disease Global Alliance, the Pershing Square Sohn Cancer Foundation, a Leuekmia and Lymphoma Society Scholar award, and NIH/NCI R01 CA201247-01. MP is supported by the BMBF-funded competence network of multiple sclerosis (KKNMS), the Sobek-Foundation, the DFG (SFB 992, SFB1140, SFB/TRR167, Reinhart-Koselleck-Grant) and the Ministry of Science, Research and Arts, Baden-Wuerttemberg (Sonderlinie “Neuroinflammation”)
Footnotes
Author contribution.
FG, EM designed the study, analyzed data and wrote the manuscript. OAW and MP participated in study design and analysis. EM performed and analyzed murine experiments, cell sorting, flow cytometry, confocal microscopy of murine and human samples, western blotting, and behavioral assays with the help of CEJG, and TL. TB and MS performed neuropathological analysis of murine (Csf1rMeriCreMer; BRAFLSL-V600E; Rosa26LSL-YFP mice) and human brain and spinal cords. BHD performed pathological examination of CD11cCre; BRAFLSL-V600E and Csf1rMeriCreMer; BRAFLSL-V600E; Rosa26LSL-YFP mice. MKR and NO diagnosed and performed morphologic and immunophenotypic evaluation of brain biopsies from ECD patients. AP performed primary and differential analysis of the RNA-seq data. YRC helped with mouse handling. All authors contributed to the manuscript.
The authors declare no competing financial interests.
References
- 1.Ransohoff RM. How neuroinflammation contributes to neurodegeneration. Science. 2016;353:777–783. doi: 10.1126/science.aag2590. [DOI] [PubMed] [Google Scholar]
- 2.Wang Y, et al. TREM2 lipid sensing sustains the microglial response in an Alzheimer's disease model. Cell. 2015;160:1061–1071. doi: 10.1016/j.cell.2015.01.049. [DOI] [PMC free article] [PubMed] [Google Scholar]
- 3.Hong S, et al. Complement and microglia mediate early synapse loss in Alzheimer mouse models. Science. 2016;352:712–716. doi: 10.1126/science.aad8373. [DOI] [PMC free article] [PubMed] [Google Scholar]
- 4.Paloneva J, et al. Mutations in two genes encoding different subunits of a receptor signaling complex result in an identical disease phenotype. Am J Hum Genet. 2002;71:656–662. doi: 10.1086/342259. [DOI] [PMC free article] [PubMed] [Google Scholar]
- 5.Rademakers R, et al. Mutations in the colony stimulating factor 1 receptor (CSF1R) gene cause hereditary diffuse leukoencephalopathy with spheroids. Nature genetics. 2011;44:200–205. doi: 10.1038/ng.1027. [DOI] [PMC free article] [PubMed] [Google Scholar]
- 6.Jonsson T, et al. Variant of TREM2 associated with the risk of Alzheimer's disease. The New England journal of medicine. 2013;368:107–116. doi: 10.1056/NEJMoa1211103. [DOI] [PMC free article] [PubMed] [Google Scholar]
- 7.Guerreiro R, et al. TREM2 variants in Alzheimer's disease. The New England journal of medicine. 2013;368:117–127. doi: 10.1056/NEJMoa1211851. [DOI] [PMC free article] [PubMed] [Google Scholar]
- 8.Hellwig S, Heinrich A, Biber K. The brain's best friend: microglial neurotoxicity revisited. Frontiers in cellular neuroscience. 2013;7:71. doi: 10.3389/fncel.2013.00071. [DOI] [PMC free article] [PubMed] [Google Scholar]
- 9.Lachenal F, et al. Neurological manifestations and neuroradiological presentation of Erdheim-Chester disease: report of 6 cases and systematic review of the literature. J Neurol. 2006;253:1267–1277. doi: 10.1007/s00415-006-0160-9. [DOI] [PubMed] [Google Scholar]
- 10.Laurencikas E, et al. Incidence and pattern of radiological central nervous system Langerhans cell histiocytosis in children: a population based study. Pediatric blood & cancer. 2011;56:250–257. doi: 10.1002/pbc.22791. [DOI] [PubMed] [Google Scholar]
- 11.Wnorowski M, et al. Pattern and course of neurodegeneration in Langerhans cell histiocytosis. The Journal of pediatrics. 2008;153:127–132. doi: 10.1016/j.jpeds.2007.12.042. [DOI] [PubMed] [Google Scholar]
- 12.Rigaud C, et al. Langerhans cell histiocytosis: therapeutic strategy and outcome in a 30-year nationwide cohort of 1478 patients under 18 years of age. British journal of haematology. 2016;174:887–898. doi: 10.1111/bjh.14140. [DOI] [PubMed] [Google Scholar]
- 13.Heritier S, et al. BRAF Mutation Correlates With High-Risk Langerhans Cell Histiocytosis and Increased Resistance to First-Line Therapy. J Clin Oncol. 2016;34:3023–3030. doi: 10.1200/JCO.2015.65.9508. [DOI] [PMC free article] [PubMed] [Google Scholar]
- 14.Badalian-Very G, et al. Recurrent BRAF mutations in Langerhans cell histiocytosis. Blood. 2010;116:1919–1923. doi: 10.1182/blood-2010-04-279083. [DOI] [PMC free article] [PubMed] [Google Scholar]
- 15.Satoh T, et al. B-RAF Mutant Alleles Associated with Langerhans Cell Histiocytosis, a Granulomatous Pediatric Disease. PloS one. 2012;7:e33891. doi: 10.1371/journal.pone.0033891. [DOI] [PMC free article] [PubMed] [Google Scholar]
- 16.Haroche J, et al. High prevalence of BRAF V600E mutations in Erdheim-Chester disease but not in other non-Langerhans cell histiocytoses. Blood. 2012;120:2700–2703. doi: 10.1182/blood-2012-05-430140. [DOI] [PubMed] [Google Scholar]
- 17.Diamond EL, et al. Diverse and Targetable Kinase Alterations Drive Histiocytic Neoplasms. Cancer discovery. 2016;6:154–165. doi: 10.1158/2159-8290.CD-15-0913. [DOI] [PMC free article] [PubMed] [Google Scholar]
- 18.Berres ML, et al. BRAF-V600E expression in precursor versus differentiated dendritic cells defines clinically distinct LCH risk groups. The Journal of experimental medicine. 2014;211:669–683. doi: 10.1084/jem.20130977. [DOI] [PMC free article] [PubMed] [Google Scholar]
- 19.Chung SS, et al. Hematopoietic stem cell origin of BRAFV600E mutations in hairy cell leukemia. Science translational medicine. 2014;6:238ra271. doi: 10.1126/scitranslmed.3008004. [DOI] [PMC free article] [PubMed] [Google Scholar]
- 20.Schulz C, et al. A lineage of myeloid cells independent of Myb and hematopoietic stem cells. Science. 2012;336:86–90. doi: 10.1126/science.1219179. [DOI] [PubMed] [Google Scholar]
- 21.Kierdorf K, et al. Microglia emerge from erythromyeloid precursors via Pu.1- and Irf8-dependent pathways. Nat Neurosci. 2013;16:273–280. doi: 10.1038/nn.3318. [DOI] [PubMed] [Google Scholar]
- 22.Gomez Perdiguero E, et al. Tissue-resident macrophages originate from yolk-sac-derived erythro-myeloid progenitors. Nature. 2015;518:547–551. doi: 10.1038/nature13989. [DOI] [PMC free article] [PubMed] [Google Scholar]
- 23.Mass E, et al. Specification of tissue-resident macrophages during organogenesis. Science. 2016;353 doi: 10.1126/science.aaf4238. [DOI] [PMC free article] [PubMed] [Google Scholar]
- 24.Behjati S, et al. Genome sequencing of normal cells reveals developmental lineages and mutational processes. Nature. 2014;513:422–425. doi: 10.1038/nature13448. [DOI] [PMC free article] [PubMed] [Google Scholar]
- 25.Martincorena I, et al. Tumor evolution. High burden and pervasive positive selection of somatic mutations in normal human skin. Science. 2015;348:880–886. doi: 10.1126/science.aaa6806. [DOI] [PMC free article] [PubMed] [Google Scholar]
- 26.Mercer K, et al. Expression of endogenous oncogenic V600EB-raf induces proliferation and developmental defects in mice and transformation of primary fibroblasts. Cancer Res. 2005;65:11493–11500. doi: 10.1158/0008-5472.CAN-05-2211. [DOI] [PMC free article] [PubMed] [Google Scholar]
- 27.Qian BZ, et al. CCL2 recruits inflammatory monocytes to facilitate breast-tumour metastasis. Nature. 2011;475:222–225. doi: 10.1038/nature10138. [DOI] [PMC free article] [PubMed] [Google Scholar]
- 28.Patel HC, Boutin H, Allan SM. Interleukin-1 in the brain: mechanisms of action in acute neurodegeneration. Annals of the New York Academy of Sciences. 2003;992:39–47. doi: 10.1111/j.1749-6632.2003.tb03136.x. [DOI] [PubMed] [Google Scholar]
- 29.Campbell IL, et al. Neurologic disease induced in transgenic mice by cerebral overexpression of interleukin 6. Proceedings of the National Academy of Sciences of the United States of America. 1993;90:10061–10065. doi: 10.1073/pnas.90.21.10061. [DOI] [PMC free article] [PubMed] [Google Scholar]
- 30.Waisman A, Hauptmann J, Regen T. The role of IL-17 in CNS diseases. Acta neuropathologica. 2015;129:625–637. doi: 10.1007/s00401-015-1402-7. [DOI] [PubMed] [Google Scholar]
- 31.Caton ML, Smith-Raska MR, Reizis B. Notch-RBP-J signaling controls the homeostasis of CD8- dendritic cells in the spleen. The Journal of experimental medicine. 2007;204:1653–1664. doi: 10.1084/jem.20062648. [DOI] [PMC free article] [PubMed] [Google Scholar]
- 32.Deng L, et al. A novel mouse model of inflammatory bowel disease links mammalian target of rapamycin-dependent hyperproliferation of colonic epithelium to inflammation-associated tumorigenesis. The American journal of pathology. 2010;176:952–967. doi: 10.2353/ajpath.2010.090622. [DOI] [PMC free article] [PubMed] [Google Scholar]
- 33.Tsai J, et al. Discovery of a selective inhibitor of oncogenic B-Raf kinase with potent antimelanoma activity. Proceedings of the National Academy of Sciences of the United States of America. 2008;105:3041–3046. doi: 10.1073/pnas.0711741105. [DOI] [PMC free article] [PubMed] [Google Scholar]
- 34.Guyenet SJ, et al. A simple composite phenotype scoring system for evaluating mouse models of cerebellar ataxia. Journal of visualized experiments : JoVE. 2010 doi: 10.3791/1787. [DOI] [PMC free article] [PubMed] [Google Scholar]
- 35.Bittner S, Afzali AM, Wiendl H, Meuth SG. Myelin oligodendrocyte glycoprotein (MOG35-55) induced experimental autoimmune encephalomyelitis (EAE) in C57BL/6 mice. Journal of visualized experiments : JoVE. 2014 doi: 10.3791/51275. [DOI] [PMC free article] [PubMed] [Google Scholar]
- 36.Carter RJ, et al. Characterization of progressive motor deficits in mice transgenic for the human Huntington's disease mutation. The Journal of neuroscience : the official journal of the Society for Neuroscience. 1999;19:3248–3257. doi: 10.1523/JNEUROSCI.19-08-03248.1999. [DOI] [PMC free article] [PubMed] [Google Scholar]
- 37.Dobin A, et al. STAR: ultrafast universal RNA-seq aligner. Bioinformatics. 2013;29:15–21. doi: 10.1093/bioinformatics/bts635. [DOI] [PMC free article] [PubMed] [Google Scholar]
- 38.Patro R, Mount SM, Kingsford C. Sailfish enables alignment-free isoform quantification from RNA-seq reads using lightweight algorithms. Nat Biotechnol. 2014;32:462–464. doi: 10.1038/nbt.2862. [DOI] [PMC free article] [PubMed] [Google Scholar]
- 39.Love MI, Huber W, Anders S. Moderated estimation of fold change and dispersion for RNA-seq data with DESeq2. Genome biology. 2014;15:550. doi: 10.1186/s13059-014-0550-8. [DOI] [PMC free article] [PubMed] [Google Scholar]
- 40.Yu G, Wang LG, Han Y, He QY. clusterProfiler: an R package for comparing biological themes among gene clusters. OMICS. 2012;16:284–287. doi: 10.1089/omi.2011.0118. [DOI] [PMC free article] [PubMed] [Google Scholar]
- 41.Diamond EL, et al. Consensus guidelines for the diagnosis and clinical management of Erdheim-Chester disease. Blood. 2014;124:483–492. doi: 10.1182/blood-2014-03-561381. [DOI] [PMC free article] [PubMed] [Google Scholar]
Associated Data
This section collects any data citations, data availability statements, or supplementary materials included in this article.
Supplementary Materials
Data Availability Statement
Gene expression data is deposited on the GEO database (accession number GSE95734). The data that support the findings of this study are available from the corresponding author upon reasonable request.