

Abstract
Background
The residency match is increasingly competitive. The interview is an essential component, yet little has been documented about the costs applicants incur during the interview process and it is unclear how they manage these expenses.
Objective
The purpose of this study was to define the economic burden of residency interviews for United States (U.S.) allopathic students participating in the 2016 Main Residency Match. We hypothesized that the financial burden of residency interviews varies based on specialty and plays a role in the applicant’s ability to participate in all desired interviews.
Methods
A 26 question electronic survey was developed following pilot study of applicants to a single residency program. Following validation, the survey was distributed to administrative officials at all U.S. allopathic medical schools for circulation to senior students. Results were pooled for statistical analysis.
Results
We received responses from 759 U.S. allopathic seniors. A single interview most commonly costs $250 - $499. Most applicants incurred substantial interview related costs. Sixtyfour percent of respondents spent at least $2,500, while 13% spent $7,500 or more. Specialty competitiveness was predictive of higher interview costs. Seventy-one percent of respondents borrowed money to fund interview costs, and 41% declined interviews for financial reasons.
Conclusions
Senior medical students incur substantial costs to participate in residency interviews, often adding to already burdensome educational debt. We encourage residency programs, especially those in competitive specialty fields, to pursue cost reduction strategies. Additionally, medical schools should provide financial counseling to allow students to anticipate interview costs.
Introduction
Each year, thousands of medical students apply for post-graduate training through the National Resident Matching Program’s (NRMP) Main Residency Match. Despite modest increases in available PGY-1 positions, the number of applicants continues to outpace the number of available positions. In the 2016 Match, 24% of all active applicants went unmatched to PGY-1 positions.1
The interview is an essential component of the matching process. An interview is required for applicants to include a program on their rank order list, and thus potentially match there. Analysis of recent match data demonstrates a direct correlation between the number of programs an applicant ranks and their probability of matching. For example, in 2016 the mean number of contiguous ranks of matched U.S. allopathic seniors was 12, compared to only 4 for unmatched applicants.2 Thus, there is incentive for applicants to participate in as many interviews as possible. The interview is also critical in the evaluation process. In 2016, residency program directors reported interactions with faculty and house staff during the interview as the first and third most important factors when ranking applicants.3
Interviewing is time consuming and financially taxing for applicants. Because students are responsible for all expenses associated with the interview, such as transportation and lodging, costs accumulate rapidly. Recent literature has attempted to define interview costs within specific specialties. Our group recently found that most applicants to our orthopaedic surgery program spent over $7,000 on interviews.4 This figure was similar to interview costs documented for neurosurgery and urology applicants.5-7 Aside from these few studies, there is a paucity of information on the variance in interview costs by specialty, and even more, how applicants balance the cost of interviewing with the competition of matching into residency. The primary purpose of this study was to define the economic burden of the residency interview process for U.S. allopathic seniors participating in the 2016 Main Residency Match. Secondary objectives were to determine how applicants finance this expense and if specialty type impacted the cost of interviewing. We hypothesized that the financial burden of residency interviews varies based on specialty and influences applicants’ ability to complete desired interviews.
Materials and Methods
Study Participants and Survey Administration
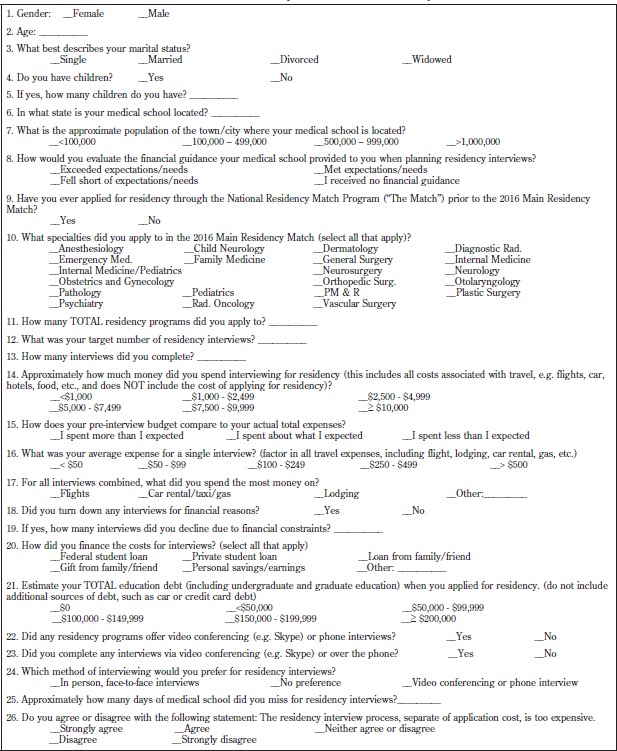
A 26 question survey of interview costs and applicant demographics [Table 1] was developed following administration of a pilot survey of a single specialty at our institution.4 The survey subsequently underwent validation by three attending physicians (KW, APS, and LMN), with attention to representativeness, clarity, relevance, and distribution strategy.8,9 The survey (Survey Monkey, Palo Alto, CA) was e-mailed to administrative officials at every allopathic medical school in the contiguous U.S. with requested distribution to senior students. The voluntary and anonymous survey was open for completion for one month before and one month after Match Day 2016. This study received exemption status from our Institutional Review Board.
Table I.
Residency Interview Costs Survey
|
The 26 question survey tool was developed in response to feedback on a small scale pilot study measuring interview costs incurred by orthopaedic surgery applicants, and subsequently underwent expert validation.
Data Collection and Analysis
Upon conclusion of the survey period, data was pooled for analysis. Chi-square tests were used for categorical comparison. Comparison across specialty groups and tiers was performed using non-parametric Kruskal-Wallis tests with follow-up Dwass, Steel, Critchlow-Flinger multiple comparison analysis. ANOVA was used to identify differences in average application characteristic across tiers. A Tukey-Kramer test was used to assess group differences while controlling for Type I experiment wise error rate.
Results
Descriptive Statistics
Seven-hundred-fifty-nine U.S allopathic students responded to the survey. Respondents included 392 women (52%) and 367 men (48%) attending medical schools in 22 states and applying to 21 different specialties. Most (696, 92%) were applying for residency for the first time. Applicants applied to a mean 45 programs (SD 28.4), and completed an average 13 interviews (SD 4.9). A single interview most commonly cost $250 - $499. Total cost of interviews as well as total educational debt is reported in Table 2. To fund these expenses, 540 applicants (71%) utilized loans while 203 (27%) used gifts and/ or personal savings. Airfare was the greatest expense for 65% of respondents, followed by lodging (21%) and car/ taxi/gas (13%).
Table II.
Accrued Educational Debt and Total Interview Costs
| Total Cost of Interviews | Total Accrued Educational Debt | ||
|---|---|---|---|
| 69 (9%) | <$1000 | 115 (15%) | No Educational Debt |
| 206 (27%) | $1,000 - $2,499 | 46 (6%) | <$50,000 |
| 259 (34%) | $2,500 - $4,999 | 36 (5%) | $50,000 - $99,999 |
| 120 (16%) | $5,000 - $7,499 | 74 (10%) | $100,000 - $149,000 |
| 50 (7%) | $7,500 - $9,999 | 152 (20%) | $150,000 - $199,999 |
| 51 (7%) | >$10,000 | 334 (44%) | >$200,000 |
| 4 (.5%) | Undisclosed | ||
Respondents documented their estimated total accrued educational debt, as well as the total cost of attending interviews, not including application costs.
Three-hundred-nine applicants (41%) turned down an average 3 (IQR 2-4) interviews for financial reasons. Six-hundred-thirty-eight (84%) respondents either strongly agreed or agreed that interview costs are too expensive and 407 (54%) reported receiving less than expected or no financial guidance from their medical school. An average of 12 school days were missed for interviews, although many used discretionary or vacation time or simultaneously participated in online courses. Only 54 (7%) respondents were offered a videoconference or phone interview and 31 (4%) actually completed one. Meanwhile, 652 (85%) of respondents noted that they prefer in-person interviews.
Statistical Analysis
To determine the potential impact of a specialty’s competitiveness on interview costs, applicants were grouped into quartiles based on their chosen specialty’s mean 2014 USMLE Step 1 score of matched U.S. seniors10 [Table 3]. On average, respondents who applied to Tier 1 (i.e. most competitive) specialties applied to significantly more programs than respondents represented by Tiers 2, 3 and 4 (adjusted p<0.05) [Table 3]. Similarly, those who applied to Tier 1 or 2 specialties targeted and completed significantly more interviews compared to Tiers 3 and 4 (adjusted p<0.05). Respondents who applied to more competitive specialty areas spent significantly more on interview costs than their counterparts in less competitive tiers (p<0.0001) [Figure 1].
Table III.
Interview Characteristics Across Specialty Tiers
| Tier 1 (n=89) Otolaryngology (248/14)* Dermatology (247/15) Orthopedic Surgery (245/48) Plastic Surgery (245/6) Neurosurgery (244/6) |
Tier 2 (n=131) Diagnostic Radiology (241/35) Radiation Oncology (241/7) Vascular Surgery (237/5) Internal Med/Peds (233/22) General Surgery (232/62) |
Tier 3 (n=271) Internal Medicine (231/137) Pathology (231/11) Anesthesiology (230/45) Emergency Medicine (230/61) Neurology (230/17) |
Tier 4 (n=245) Child Neurology (229/3) Obstetrics & Gynecology (226/74) Pediatrics (226/74) Physical Medicine & Rehabilitation (220/11) Psychiatry (220/31) Family Medicine (218/52) |
p-value | |
|---|---|---|---|---|---|
| Gender | |||||
| Female | 18 (20.2%) | 66 (50.4%) | 122 (45.5%) | 177 (72.2%) | |
| Male | 71 (79.8%) | 65 (49.6%) | 149 (55.5%) | 68 (27.8%) | <0.0001 |
| Number Applications of Completed (mean, SD) | 90.0 (31.98) | 48.66 (23.49) | 38.08 (21.42) | 34.44 (18.86) | <0.0001 |
| Number (mean, SD) of Interviews Targeted | 15.15 (6.42) | 15.42 (5.27) | 13.11 (3.76) | 12.94 (3.86) | <0.0001 |
| Number Completed of Interviews (mean, SD) | 14.61 (5.56) | 15.11 (5.43) | 12.89 (4.51) | 12.62 (4.42) | <0.0001 |
| Turned Financial Down Reasons Interview For | 22 (24.7%) | 59 (45.0%) | 122 (45.0%) | 96 (39.2%) | 0.01 |
| Number Down For of Financial Interviews Reasons Turned | 2 (IQR 1-4) | 3 (IQR 2-4) | 3 (IQR 2-4) | 2 (IQR 2-4) | 0.45 |
Specialties were grouped into quartiles based on 2014 mean USMLE Step 1 scores10 for matched U.S. Seniors and ranked according to competitiveness, where Tier 1 = “most competitive.” Applicants applying to more than one specialty were categorized by the specialty with the higher mean Step 1 score. To look for differences in the average number of residency programs to which respondents applied, the target number of interviews, and the number of interviews completed across tiers, an ANOVA was performed. A non-parametric Kruskal-Wallis Test was used to look for differences in the number of interviews turned down for financial reasons across each tier.
Figure 1. Total Interview Cost Across Specialty Tiers.
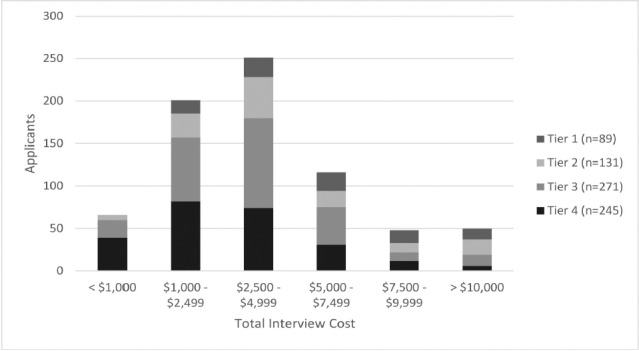
To determine if respondents from any specialty tiers spent significantly more on interview costs, a non-parametric Kruskal-Wallis Test was performed. A DSCF multiple comparison analysis was then conducted to look for specific group differences. Respondents who applied to more competitive specialty areas spent significantly more money on interview costs than their counterparts in lower tiers (p<0.0001). Tier 1 respondents spent significantly more than those in Tier 3 (adjusted p<0.0001) or Tier 4 (adjusted p<0.0001). Similarly, Tier 2 respondents spent significantly more than those in Tier 3 (adjusted p=0.03) or Tier 4 (adjusted p<0.0001). Tier 3 respondents also spent significantly more on interview costs than Tier 4 respondents (adjusted p=0.01).
Lastly, survey respondents were grouped by specialty type [Table 4]. Respondents pursuing primary care (n=255) spent significantly less than many of their peers, including those selecting radiologic specialties (n=42; adjusted p<0.0001), surgical specialties (n=115; adjusted p<0.0001), emergency medicine (n=61; adjusted p=0.03), and “other” specialty areas (n=37; adjusted p<0.001). Respondents who selected neurology or psychiatry (n=51) also spent significantly less on interview costs than those pursuing radiologic specialties (n=42; adjusted p=0.03).
Table IV.
Total Interview Cost Across Specialty Areas
| Primary Care (n=285) | Surgical (n=215) | Anesthesiology (n=45) | Neurology & Psychiatry (n=51) | Radiology & Radiation Oncology (n=42) | Emergency Medicine (n=61) | Other (n=37) | |
|---|---|---|---|---|---|---|---|
| Family Medicine (n=52) Internal Medicine (n=137) Internal Medicine/ Pediatrics (n=22) Pediatrics (n=74) |
General Surgery (n=62) Neurourgery (n=6) Obstetrics & Gynecology (n=74) Orthopedic Surgery (n=48) Plastic Surgery (n=6) Otolaryngology (n=14) Vascular Surgery (n=5) |
Child Neurology (n=3) Neurology (n=17) Psychiatry (n=31) |
Diagnostic Radiology (n=35) Radiation Oncology (n=31) |
Dermatology (n=15) Pathology (n=11) PM & R (n=11) |
|||
| < $1,000 | 49 (17.2%) | 5 (2.3%) | 2 (4.4%) | 5 (9.8%) | 0 (0.0%) | 5 (8.2%) | 0 (0.0%) |
| $1,000 - $2,499 | 100 (35.1%) | 49 (22.8%) | 10 (22.2%) | 13 (25.5%) | 6 (14.3%) | 13 (21.3%) | 10 (27.0%) |
| $2,500 - $4,999 | 87 (30.5%) | 70 (32.6%) | 22 (48.9%) | 21 (41.2%) | 16 (38.1%) | 27 (44.3%) | 8 (21.6%) |
| $5,000 - $7,499 | 39 (13.7%) | 37 (17.2%) | 7 (15.6%) | 8 (15.7%) | 10 (23.8%) | 6 (9.8%) | 9 (24.3%) |
| $7,500 - $9,999 | 3 (1.1%) | 28 (13.0%) | 1 (2.2%) | 4 (7.8%) | 3 (7.1%) | 5 (8.2%) | 4 (10.8%) |
| > $10,000 | 7 (2.5%) | 25 (11.6%) | 2 (4.4%) | 0 (0.0%) | 7 (16.7%) | 4 (6.6%) | 5 (13.5%) |
| No Response | 0 (0.0%) | 1 (0.5%) | 1 (2.2%) | 0 (0.0%) | 0 (0.0%) | 1 (1.6%) | 1 (2.7%) |
Respondents were divided into groups based on specialty likeness. A non-parametric Kruskal-Wallis Test was performed to determine if respondents from any of the specialty areas spent significantly more on interview costs. A follow-up DSCF multiple comparison analysis was then conducted to look for specific group differences. Respondents pursuing a primary care specialty spent significantly less on interview costs than those who selected radiology or radiation oncology (adjusted p<0.0001), surgical specialties (adjusted p<0.0001), emergency medicine (adjusted p=0.03), and other specialty areas (adjusted p<0.001). Respondents who selected neurology or psychiatry also spent significantly less on interview costs than those who selected Radiology or Radiation Oncology (adjusted p=0.03).
Discussion
The purpose of this investigation was to gain insight into the expense residency interviews pose to graduating medical students. Because an applicant’s chance of matching directly correlates with their number of contiguous ranks, applicants feel obligated to complete as many interviews as possible.2 According to NRMP data, 13 interviews corresponds to a match rate of greater than 90% for all specialties except neurosurgery. Nonetheless, in our study, applicants targeted an average of 14 (SD 4.6) interviews and even applicants to tier 4 (i.e. least competitive) specialties set a target of an average of 13 interviews (SD 3.9).
Total interview costs were substantial for the majority of applicants: 64% spent at least $2,500 while 13% incurred costs of $7,500 or more. These costs are comparable to those described in prior studies.4-7 Considering that the median accrued educational debt for graduating medical students is $170,000, interviewing costs represent a meaningful addition to already burdensome debt.11
Respondents who applied to more competitive residencies as determined by mean USMLE Step 1 scores targeted and completed significantly more interviews and spent significantly more than their peers applying to less competitive specialties. Furthermore, those applying to surgical, radiological, and emergency medicine specialties spent significantly more than those applying to primary care specialties. While we believe all residency programs should consider cost reducing strategies, those in more competitive fields should be particularly sensitive to this financial burden on applicants.
Lastly, we found that an overwhelming majority (84%) of respondents either strongly agreed or agreed that interview costs were too expensive. Forty-one percent of applicants turned down an interview for financial reasons. If cost can limit a candidate’s ability to attend an interview, it is imperative that students receive appropriate financial guidance from their medical school. With the ability to anticipate interview costs, students can weigh the benefits of an additional interview against the cost of attending.
Since interviews are an indispensable part of the application process, the focus should be on cost-saving strategies, and this begins with understanding how applicants spend their money. In our study, 65% noted airfare to be the largest expense, while 21% cited lodging. A logical option then is replacing traditional in-person interviews with videoconferencing or phone interviews. When University of New Mexico’s Urology program trialed web based interviews, they documented a nearly 50% reduction in applicant costs, as well as a reduction in medical school days missed by applicants.12 Similarly, a family medicine residency program found that videoconference-based interviewing not only saved applicants money, but also saved the program over $5,000 in direct cash and indirect salary savings.13
Despite the potential savings, only 7% of our respondents were offered a videoconference or phone interview. Perhaps more importantly, though, 85% stated they prefer in-person interviews. The obvious drawback to “virtual” interviews is that applicants don’t meet faculty and residents or tour the program’s facilities. To this point, one study that trialed videoconferencing saw no difference in applicant’s costs when factoring in the subsequent site visits most applicants independently scheduled.14 Videoconferencing or phone interviews may therefore be best utilized as a preliminary assessment tool to identify a smaller pool of candidates to invite for a visit.
Another option that reduces applicant cost while maintaining the in-person interviewing format is co-locating interviews, where representatives from several programs convene at a single location to interview all applicants. This strategy was previously trialed in the Canadian Urology match, and while savings were demonstrated, once again these savings did not account for subsequent program visits by many of the interviewees.15 Additionally, co-located interviews pose substantial logistical challenges. While the Canadian Urology Fair only involved nine programs and 28 candidates, the 2014 internal medicine match, for example, included over 9,300 applicants. Simply put, coordinating and hosting wide participation by so many applicants and residency programs may prove to be too difficult.
An alternative and more practical option then is a city or region-based approach. If programs in the same area were to schedule their interviews on sequential days, students could travel to a city or region once rather than several times.
One easily implemented cost saving technique utilized by our own residency program is to interview any visiting student at the end of their rotation. Although away rotations are not required, they are common amongst applicants, with a reported 67.4% of all applicants performing at least one visiting rotation and 21.7% performing 3 or more.16,17 Routinely interviewing an applicant at the end of their rotation saves the students a return trip and is also convenient for the residency program. We estimate that we save our rotating students $344 with this practice.4
There are several limitations to this study. Respondents attended medical schools in only twenty two of the forty three states (51.5%) in the contiguous U.S. with graduating seniors. It is unclear why there were no responses from schools in twenty one states, and why many of these schools were in the Pacific region. It is possible the lack of Western participants skewed our data, but it is unclear if these applicants would have less, equal, or greater interview costs than our respondents. Our goal was to distribute our survey to as many senior allopathic medical students as possible. However, because many school officials did not communicate their willingness or refusal to participate, we are unable to accurately calculate the response rate. There was an over-representation of applicants to Tier 1 and 2 programs when compared to NRMP match data,7 but this was not statistically significant. This may be related to both participation and recall biases inherent to any questionnaire based study, as students who chose to participate may have had particularly negative or positive experiences, making them more inclined to respond. Since the distribution of responses amongst individual specialty choice and demographics is similar to published NRMP data,7,18 we feel our data set is representative of the graduating class in general.
Conclusion
This study examined residency interview costs incurred by U.S. allopathic medical students and the potential implications of these costs. A single interview most commonly cost $250 - $499 and total cost was $2,500 or greater for 64% of applicants. Costs were significantly higher for those pursuing more competitive specialties. A majority of students borrow money for interviews and four in ten decline interviews for financial reasons. We encourage residency programs, especially those in more competitive fields, to utilize cost reducing strategies and for medical schools to become more active in counseling students.
References
- 1. National Resident Matching Program, Results and Data: 2016 Main Residency Match®. National Resident Matching Program, Washington, DC. 2016.
- 2. National Resident Matching Program, Charting Outcomes in the Match for U.S. Allopathic Seniors, 2016. National Resident Matching Program, Washington, DC 2016.
- 3. National Resident Matching Program, Data Release and Research Committee: Results of the 2016 NRMP Program Director Survey. National Resident Matching Program, Washington, DC. 2016.
- 4.Fogel HA, Finkler ES, Wu K, Schiff AP, Nystrom LM. The Economic Burden of Orthopedic Surgery Residency Interviews on Applicants. Iowa Orthop J. 2016;36:26–30. [PMC free article] [PubMed] [Google Scholar]
- 5.Agarwal N, Choi PA, Okonkwo DO, Barrow DL, Friedlander RM. Financial burden associated with the residency match in neurological surgery. J Neurosurg. 2016 Apr;8:1–7. doi: 10.3171/2015.12.JNS15488. [Epub ahead of print] [DOI] [PubMed] [Google Scholar]
- 6.Nikonow TN, Lyon TD, Jackman SV, Averch TD. Survey of Applicant Experience and Cost in the Urology Match: Opportunities for Reform. J Urol. 2015 Oct;194(4):1063–7. doi: 10.1016/j.juro.2015.04.074. [DOI] [PubMed] [Google Scholar]
- 7. National Resident Matching Program, Cost of Applying to Residency Questionnaire Report. National Resident Matching Program, Washington, DC. 2015.
- 8.Artino AR Jr, La Rochelle JS, Dezee KJ, Gehlbach H. Developing questionnaires for educational research: AMEE Guide No. 87. Med Teach. 2014 Jun;36(6):463–74. doi: 10.3109/0142159X.2014.889814. [DOI] [PMC free article] [PubMed] [Google Scholar]
- 9.Magee C, Rickards G, A Byars L, Artino AR Jr. Tracing the steps of survey design: a graduate medical education research example. J Grad Med Educ. 2013 Mar;5(1):1–5. doi: 10.4300/JGME-D-12-00364.1. [DOI] [PMC free article] [PubMed] [Google Scholar]
- 10. National Resident Matching Program, Results and Data: 2014 Main Residency Match®. National Resident Matching Program, Washington, DC. 2014.
- 11. Physician Education Debt and the Cost to Attend Medical School: 2012 Update. Association of American Medical Colleges (AAMC). Feb 2013. Available at: https://members.aamc.org/eweb/upload/Physician%20Education%20Debt%20and%20the%20Cost%20to%20Attend%20Medical%20School,%202012%20Update.pdf. Accessed 2016 Sep 25.
- 12.Shah SK, Arora S, Skipper B, Kalishman S, Timm TC, Smith AY. Randomized evaluation of a web based interview process for urology resident selection. J Urol. 2012 Apr;187(4):1380–4. doi: 10.1016/j.juro.2011.11.108. [DOI] [PubMed] [Google Scholar]
- 13.Edje L, Miller C, Kiefer J, Oram D. Using skype as an alternative for residency selection interviews. J Grad Med Educ. 2013 Sep;5(3):503–5. doi: 10.4300/JGME-D-12-00152.1. [DOI] [PMC free article] [PubMed] [Google Scholar]
- 14.Pasadhika S, Altenbernd T, Ober RR, Harvey EM, Miller JM. Residency interview video conferencing. Ophthalmology. 2012 Feb;119(2):426–426. doi: 10.1016/j.ophtha.2011.09.032. e5. [DOI] [PubMed] [Google Scholar]
- 15.Grober ED, Matsumoto ED, Jewett MA, Chin JL. Canadian Urology Program Directors. The Canadian Urology Fair: a model for minimizing the financial and academic costs of the residency selection process. Can J Surg. 2003 Dec;46(6):458–62. [PMC free article] [PubMed] [Google Scholar]
- 16.Winterton M, Ahn J, Bernstein J. The prevalence and cost of medical student visiting rotations. BMC Med Educ. 2016 Nov 14;16(1):291.. doi: 10.1186/s12909-016-0805-z. [DOI] [PMC free article] [PubMed] [Google Scholar]
- 17.Baldwin K, Weidner Z, Ahn J, Mehta S. Are away rotations critical for a successful match in orthopaedic surgery? Clin Orthop Relat Res. 2009 Dec;467(12):3340–45. doi: 10.1007/s11999-009-0920-9. [DOI] [PMC free article] [PubMed] [Google Scholar]
- 18. Association of American Medical Colleges, Total Graduates by U.S. Medical School and Sex, 2011- 2012 through 2015- 2016. Association of American Medical Colleges. Dec 2016. https://www.aamc.org/download/321532/data/factstableb2- 2.pdf. Accessed 2016 Feb 25.